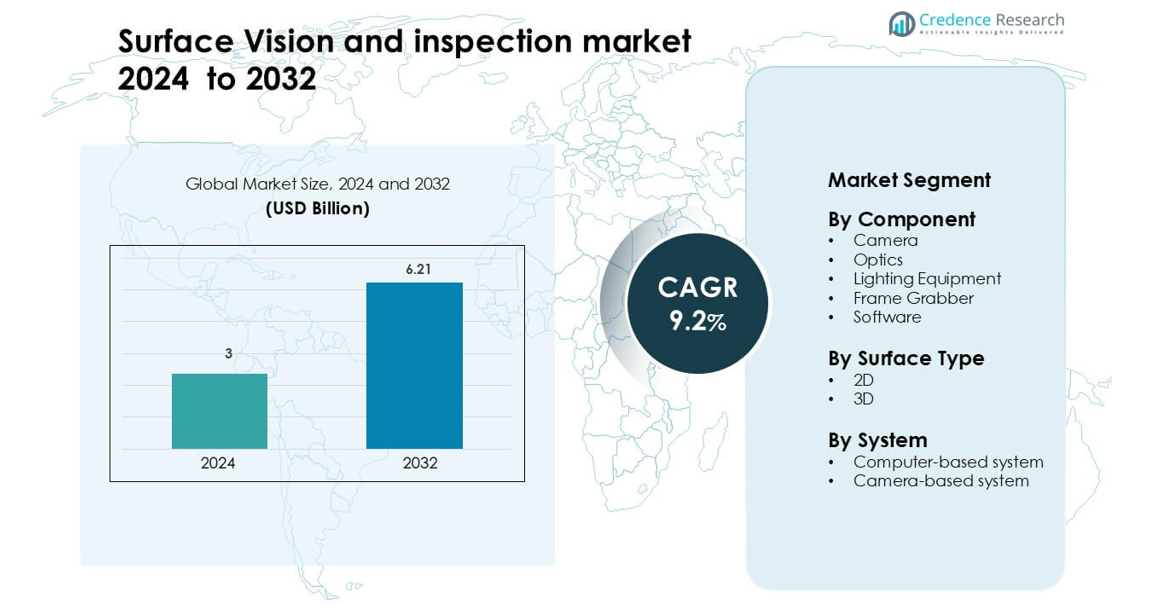
Home » Information and Communications Technology » Surface Vision and Inspection Market

Surface Vision and Inspection Market By Technology (Machine Vision Systems, Computer Vision Systems) By Application (Quality Control and Inspection, Measurement and Metrology, Defect Detection and Classification, Surface Texture Analysis, Pattern Recognition, Assembly Verification, Code Reading and Verification)-Growth, Future Prospects & Competitive Analysis, 2016 – 2030

Price: $4999

Published: | Report ID: 21595 | Report Format : PDF

Market Insights

  • The global demand for surface vision and inspection was valued at USD 2215.9 million in 2022 and is expected to reach USD 3952 million in 2030, growing at a CAGR of 7.50% between 2023 and 2030.
  • Software is the leading segment by component, while the hardware segment is expected to display a significant CAGR during the forecast period.
  • Machine vision systems are the leading segment by technology.
  • During the forecast period, the quality control and inspection category is expected to grow at the highest CAGR.
  • The manufacturing category is anticipated to grow at the highest CAGR during the projection period.
  • The 3D inspection category is anticipated to expand at the highest CAGR throughout the forecast period.
  • The direct sales category is anticipated to increase at the highest CAGR during the forecast period.
  • The standalone systems category is anticipated to grow at the highest CAGR throughout the forecast period.
  • North America dominated the surface vision and inspection market with a 41.3% market share as of 2022.
  • Europe is anticipated to be the second-largest region in the surface vision and inspection market.
  • In the surface vision and inspection market, Asia Pacific is anticipated to grow fastest.
  • The surface vision and inspection market is expanding due to the rising demands for quality assurance, healthcare spending, industry regulations, manufacturing automation, and growing technological advancements.
  • The surface vision and inspection market has a lot of opportunities for growth due to enhanced software capabilities, international expansion, industry 4.0 integration, remote monitoring and diagnostics, and miniaturization and microelectronics.

Surface vision and inspection market

Executive Summary

Market Definition

The surface vision and inspection market designates a specialized area of the more general field of industrial automation and quality control. In manufacturing and production environments, it includes a variety of technologies, methods, and solutions built to visually inspect and analyze the surfaces of different products, materials, or components. These technologies use sophisticated imaging techniques, such as cameras, sensors, and computer vision software, to check surfaces for flaws, abnormalities, or deviations from predetermined criteria.

Market Overview

The market for surface vision and inspection has been expanding steadily in recent years, and between 2023 and 2030, it is anticipated to rise at a CAGR of 7.50%. The market was estimated to be worth USD 2215.9 million in 2022, and it is anticipated to be worth USD 3952 million in 2030.

Increasing manufacturing automation, rising quality assurance demands, growing industry regulations, rising healthcare spending and growing technological advancements are some of the main drivers boosting the growth of the surface vision and inspection market. Many industries are subject to stringent rules and quality requirements, including the automobile, pharmaceutical, aerospace, and food and beverage sectors. Surface vision and inspection systems ensure that goods adhere to these criteria, helping businesses avoid fines and keep market access.

Technology advancement is a major factor in the growth of the surface vision and inspection market. Surface vision systems can capture more precise and comprehensive pictures for inspection due to improvements in camera technology, such as greater resolutions, faster frame rates, and increased light sensitivity. Surface vision systems can detect flaws and anomalies that might not be visible to the human eye due to innovative sensor technologies, like multispectral and hyperspectral sensors, which increase their applicability in various industries.

Surface vision systems can verify microscopic components and guarantee their quality due to the trend toward miniaturization and the growing complexity of electronic components.

Design Element 2

Access crucial information at unmatched prices!

Request your free sample report today & start making informed decisions powered by Credence Research!

Download Free Sample
CTA Design Element 3

Segmentation by Component

  • Software is the leading segment by component. Software is further segmented into image processing, analysis and reporting, integration, and connectivity software. Camera-captured images are improved and prepared using image processing software. It has filters, noise-reduction tools, contrast-boosting tools, and image rectification tools to increase the quality of photos for analysis.
  • The hardware segment is anticipated to grow significantly during the projection period. Clear and consistent photos must be captured, which requires proper lighting. The inspection area is illuminated, and the visibility of surface flaws is improved using various lighting systems, such as LED, ring, or strobe lights.

Segmentation by Technology

  • Machine vision systems are the leading segment by technology. Pattern recognition algorithms are used by machine vision technology to spot particular patterns, features, or defects in the images.
  • The computer vision systems category is expected to grow significantly during the forecast period. Computer vision systems can follow objects or features across video frames. This is especially helpful for monitoring moving objects or following changes over time.

Segmentation by Application

  • The quality control and inspection segment is anticipated to grow at the highest CAGR during the forecast period. Surface vision and inspection systems check the legibility and correctness of text, barcodes, labels, and graphics printed on packaging, labels, and product surfaces.
  • Other applications, such as measurement and metrology, defect detection and classification, surface texture analysis, pattern recognition, assembly verification, code reading and verification, also contribute to the demand for surface vision and inspection.

Segmentation by Industry Vertical

  • The manufacturing segment is predicted to register the greatest CAGR during the forecast period. Automotive components and finished goods are checked for quality and safety using surface vision and inspection devices. They examine the paint’s quality, look for body panel flaws, confirm that the assembly is correct, and judge the surface finish.
  • Other industry verticals, such as healthcare and life sciences, agriculture, logistics and transportation, retail, energy and utilities, also contribute to the demand for surface vision and inspection.

Segmentation by Inspection Type

  • The 3D inspection segment is anticipated to register the highest CAGR during the forecast period. The comprehensive study of complex surfaces, particularly those with curved, contoured, or irregular shapes, is made possible through 3D inspection.
  • Other inspection types, such as 2D inspection, automated optical inspection (AOI), in-line inspection, and offline inspection, also contribute to the demand for surface vision and inspection.

Segmentation by Distribution Channels

  • The direct sales segment is predicted to register the greatest CAGR during the forecast period. Direct sales channels offer consumers technical assistance and knowledge to help them select the best solution for their needs. They offer post-sales support, advise on system integration, and respond to technical inquiries.
  • Other distribution channels, such as distributors and resellers, also contribute to the demand for surface vision and inspection.

Segmentation by Integration

  • The standalone systems segment is expected to register the highest CAGR during the forecast period. All connected standalone inspection systems are managed and watched over by a single software platform or centralized control interface. Operators have access to a single interface from which they can initiate inspections, change settings, and control each system remotely.
  • Other integration, such as integrated systems (embedded in production lines), also contribute to the demand for surface vision and inspection.

Segmentation by Region

  • North America dominated the surface vision and inspection market with a 41.3% market share as of 2022. Industry regulations and rigorous standards are maintained in North America, demanding advanced quality control and inspection procedures.
  • Europe is anticipated to be the second-largest region in the surface vision and inspection market.
  • Asia Pacific is predicted to be the fastest-growing region in the surface vision and inspection market.
  • The rest of the demand for surface vision and inspection is met by the rest of the world, which includes Latin America, the Middle East, and Africa.

Surface vision and inspection market regional analysis

Rising demands for quality assurance, rising healthcare spending, increasing industry regulations, increasing manufacturing automation, and growing technological advancements are some of the key drivers boosting the growth of the surface vision and inspection market.

The North American region will dominate the surface vision and inspection market throughout the forecast period. Manufacturing is a robust industry in North America, with strong sectors represented by the auto, aircraft, electronics, pharmaceuticals, food, and beverage industries. To ensure product quality, regulatory compliance, and competitiveness in these industries, surface vision and inspection systems play a significant role. High-quality standards and regulatory requirements are maintained by North American industries, demanding sophisticated quality control and inspection procedures. Systems for surface vision and inspection are crucial in achieving these high standards. The United States has a robust ecosystem of research facilities, start-ups, and established technology corporations and is a global leader in technical innovation. This environment encourages the creation of innovative inspection technologies, which promote the use of cutting-edge surface vision systems.

Asia Pacific is expected to increase fastest during the projection period. Asia-Pacific is rapidly industrializing, especially in nations like China, India, and Southeast Asian countries. The need for surface vision and inspection systems to verify product quality and compliance with international standards is driven by this industrial growth. Rising disposable incomes and an expanding middle-class population in India drive the demand for consumer electronics. To ensure these items’ quality and dependability, surface vision and inspection technologies are crucial.

Surface vision systems rapidly integrate collaborative robotics (cobots) and augmented reality (AR) technologies. This trend allows humans and machines to work together on inspection jobs, increasing accuracy and efficiency.

The increased production speed is the main driver of the rising demand for surface vision and inspection. These technologies allow manufacturers to maintain or enhance production rates while maintaining quality by quickly inspecting items.

Key Highlights of the Report

The global surface vision and inspection market is segmented by component, technology, application, industry vertical, inspection type, distribution channels, integration and region. Software is the leading segment by component. Machine vision systems are the leading segment by technology. During the forecast period, the quality control and inspection category is anticipated to have the greatest CAGR. The manufacturing category will experience the highest CAGR during the projection period. The 3D inspection category is anticipated to have the highest CAGR during the forecast period. North America is driving the surface vision and inspection market growth.

Rising demand for automated manufacturing procedures can work continuously without interruption, increasing productivity and production efficiency. Even in high-speed production, surface vision and inspection technologies assist in preserving product quality and lower faults. Automation reduces the need for manual labor, which saves money on wages, benefits, and training. Surface vision systems can be human inspectors, especially for tedious and repeated inspection jobs.

However, North America is predicted to hold the largest market share for surface vision and inspection globally because industry regulations and rigorous standards are maintained in North America, demanding advanced quality control and inspection procedures. Moreover, the market is anticipated to expand at the highest rate in the Asia-Pacific (APAC) region because surface vision systems are essential for checking complex electronic parts, semiconductors, and printed circuit boards.

What Are the Main Factors Driving the Surface Vision and Inspection Market Globally?

The main factors boosting the growth of the surface vision and inspection market are rising demands for quality assurance, rising healthcare spending, increasing industry regulations, increasing manufacturing automation, and growing technological advancements. Businesses and customers alike anticipate constant product quality. By spotting flaws and deviations from norms and correcting them, surface vision and inspection systems assist producers in maintaining consistent product quality. This quality assurance is essential for a brand’s reputation and client happiness.

What Are The Main Challenges In The Global Surface Vision And Inspection Market?

The challenges limiting the growth of the surface vision and inspection market are high initial costs, integration difficulties, the need for a skilled workforce, a lack of flexibility, and data management and analysis.

What Market Opportunities Exist For Surface Vision and Inspection Globally?

The surface vision and inspection market has a lot of opportunities for growth due to enhanced software capabilities, international expansion, industry 4.0 integration, remote monitoring and diagnostics, and miniaturization and microelectronics.

Market Drivers

Several factors influence the global market for surface vision and inspection. The following are the main global market drivers for surface vision and inspection:

Rising Demands For Quality Control In Manufacturing Processes

Manufacturers in a variety of industries are under increasing pressure to create products that are reliable and of a high caliber. Surface vision and inspection systems are essential tools that help firms keep a competitive edge by ensuring that every product meets or exceeds quality standards. Strict laws and guidelines governing the quality and safety of products apply to many businesses. Surface vision and inspection systems assist businesses in complying with these requirements, helping them avoid fines, legal troubles, and reputational harm. Human inspection-based quality control procedures are naturally prone to error. Surface vision and inspection systems offer extremely precise and reliable defect identification, greatly lowering the possibility that customers would receive defective products. Automated inspection systems can operate quickly and with little downtime, increasing production effectiveness. Cost reductions and higher output are possible outcomes of this efficiency enhancement. Delivering high-quality goods regularly builds customer trust and improves brand reputation. This good reputation may result in growth in repeat business and client loyalty.

Market Restraints

Several challenges may arise when the surface vision and inspection sector expands globally. These are a few of them:

Integration Challenges

Surface vision and inspection system integration can be a challenging and time-consuming procedure in manufacturing. The manufacturing line may need to be modified, which could cause disruptions in operations and frequently calls for coordination with multiple departments. New inspection technologies might not be easily compatible with existing production equipment and systems. Ensuring flawless integration and communication across various hardware and software might be difficult.

Surface vision and inspection system integration may involve downtime, which could cause production delays and financial losses. While minimizing downtime is important, doing so can be difficult. Surface vision and inspection systems adoption can be significantly more expensive due to integration costs, which include labor, engineering, hardware, and software expenditures, especially for smaller enterprises.

Opportunities

The global industry offers multiple opportunities for surface vision and inspection. One of these is demonstrated here:

The Demand For Industry 4.0 Integration

The fourth industrial revolution, “Industry 4.0,” is highlighted by incorporating digital technologies, automation, and data analytics into manufacturing processes. Systems for surface vision and inspection are essential components of smart manufacturing because they offer real-time data for process and quality control. Making decisions in Industry 4.0 requires data. Systems for surface vision and inspection produce a lot of information on product quality, flaws, and manufacturing procedures. Making better decisions is made possible by integrating this data into the larger data analytics ecosystem.

Surface vision and inspection systems can help with preventive maintenance programs in Industry 4.0. Maintenance can be planned ahead of time, decreasing downtime, by monitoring the operation of inspection equipment and seeing early warning signals of problems. The interconnection of systems and machines is highlighted by Industry 4.0. To establish a coordinated and responsive manufacturing environment, surface vision and inspection systems can easily interact with other production machinery, robotics, and sensors.

Competitive Landscape

surface vision and inspection market Competitive Scenario

Key Players

Many significant companies engage severely in the global surface vision and inspection market. The following list includes some of the top market players and their related market shares:

  • Adept Technology, Inc.
  • Cognex Corporation
  • Baumer Inspection
  • Edmund Optics Inc.
  • ISRA Vision AG
  • ETS SuperVision BV
  • Matrox Imaging
  • Industrial Vision Systems Ltd.
  • Microscan Systems, Inc.
  • Panasonic Corporation
  • Omron Corporation
  • Teledyne DALSA Inc.
  • Perceptron Inc.
  • Vitronic GmbH

These businesses prioritize mergers and acquisitions, distribution channel development, and product innovation to stay competitive.

The top competitors in the global surface vision and inspection market constantly seek to gain an advantage by releasing new products and innovations.

In August 2022, An updated version of the multispectral Camera Link HS (CLHS) line scan camera from Teledyne DALSA, a Teledyne Technologies subsidiary, has just been released. By identifying flaws on and beneath the surface of diverse materials, components, and products, this innovative camera is made to tackle difficult inspection applications.

In April 2022, A special camera cluster system created by IMS Messsysteme (Germany) ensured the best accuracy for flatness testing, even on highly reflective materials. The topography of each measuring object is found and captured using high-performance cameras.

Shape Your Report to Specific Countries or Regions & Enjoy 30% Off!

Summary of Key Findings

  • The main factors boosting the growth of the surface vision and inspection market are rising demands for quality assurance, rising healthcare spending, increasing industry regulations, increasing manufacturing automation, and growing technological advancements.
  • Market segmented by component, technology, application, industry vertical, inspection type, distribution channels, integration, and region.
  • Software is the leading segment by component.
  • Machine vision systems are the leading segment by technology.
  • The quality control and inspection segment is anticipated to register the greatest CAGR during the forecast period.
  • The manufacturing segment is expected to grow at the highest CAGR during the projection period.
  • North America is leading market growth; the market is highly competitive with key players including Adept Technology, Inc., Cognex Corporation, Baumer Inspection, Edmund Optics Inc., ISRA Vision AG, ETS SuperVision BV, Matrox Imaging, Industrial Vision Systems Ltd., Microscan Systems, Inc., Panasonic Corporation, Omron Corporation, Teledyne DALSA Inc., Perceptron Inc., Vitronic GmbH, and others.

Future Outlook

  • Positive outlook for the global surface vision and inspection market with significant growth potential in the North American region.
  • The rising demand for quality control in manufacturing processes is a key driver of the growth of the surface vision and inspection market.
  • The integration challenges connected with surface vision and inspection might be a major barrier to the market’s growth during the forecast period.
  • Major companies must concentrate on product innovation, expanding their market reach, and maintaining competitive pricing to stay ahead.

Segmentation

  • By Component
    • Hardware
      • Cameras
      • Lighting Systems
      • Optics and Lenses
      • Frame Grabbers
      • Processors
      • Others
    • Software
      • Image Processing Software
      • Analysis and Reporting Software
      • Integration and Connectivity Software
    • By Technology
      • Machine Vision Systems
      • Computer Vision Systems
    • By Application
      • Quality Control and Inspection
      • Measurement and Metrology
      • Defect Detection and Classification
      • Surface Texture Analysis
      • Pattern Recognition
      • Assembly Verification
      • Code Reading and Verification
    • By Industry Vertical
      • Manufacturing
        • Automotive
        • Electronics and Semiconductors
        • Aerospace and Defense
        • Pharmaceuticals
        • Food and Beverage
        • Packaging
        • Others
      • Healthcare and Life Sciences
      • Agriculture
      • Logistics and Transportation
      • Retail
      • Energy and Utilities
    • By Inspection Type
      • 2D Inspection
      • 3D Inspection
      • Automated Optical Inspection (AOI)
      • In-Line Inspection
      • Offline Inspection
    • By Distribution Channels
      • Direct Sales
      • Distributors and Resellers
    • By Integration
      • Standalone Systems
      • Integrated Systems (Embedded in Production Lines)
    • By Region
      • North America
        • The US.
        • Canada
        • Mexico
      • Europe
        • Germany
        • France
        • The U.K.
        • Italy
        • Spain
        • Rest of Europe
      • Asia Pacific
        • China
        • Japan
        • India
        • South Korea
        • South-east Asia
        • Rest of Asia Pacific
      • Latin America
        • Brazil
        • Argentina
        • Rest of Latin America
      • Middle East & Africa
        • GCC Countries
        • South Africa
        • Rest of the Middle East and Africa

Adjacent Markets

The surface vision and inspection industry has several linked markets with high potential for revenue growth. The major markets adjacent to the surface vision and inspection market –

surface vision and inspection market adjacent market

1. Preface

1.1. Report Description

1.1.1. Purpose of the Report

1.1.2. Target Audience

1.1.3. USP and Key Offerings

1.2. Research Scope

1.3. Market Introduction


2. Executive Summary

2.1. Market Snapshot: Global Surface Vision and Inspection Market

2.1.1. Global Surface Vision and Inspection Market, By Component

2.1.2. Global Surface Vision and Inspection Market, By Technology

2.1.3. Global Surface Vision and Inspection Market, By Application

2.1.4. Global Surface Vision and Inspection Market, By Industry Vertical

2.1.5. Global Surface Vision and Inspection Market, By Inspection Type

2.1.6. Global Surface Vision and Inspection Market, By Distribution Channels

2.1.7. Global Surface Vision and Inspection Market, By Integration

2.1.8. Global Surface Vision and Inspection Market, By Region

2.2. Insights from Primary Respondents


3. Market Dynamics & Factors Analysis

3.1. Introduction

3.1.1. Global Surface Vision and Inspection Market Value, 2017-2030, (US$ Mn)

3.1.2. Y-o-Y Growth Trend Analysis

3.2. Market Dynamics

3.2.1. Surface Vision and Inspection Market Drivers

3.2.2. Surface Vision and Inspection Market Restraints

3.2.3. Surface Vision and Inspection Market Opportunities

3.2.4. Major Surface Vision and Inspection Industry Challenges

3.3. Growth and Development Patterns

3.4. Investment Feasibility Analysis

3.5. Market Opportunity Analysis

3.5.1. Component

3.5.2. Technology

3.5.3. Application

3.5.4. Industry Vertical

3.5.5. Inspection Type

3.5.6. Distribution Channels

3.5.7. Integration

3.5.8. Geography


4. Market Competitive Landscape Analysis

4.1. Company Market Share Analysis, 2022

4.1.1. Global Surface Vision and Inspection Market: Company Market Share, Value 2022

4.1.2. Global Surface Vision and Inspection Market: Top 6 Company Market Share, Value 2022

4.1.3. Global Surface Vision and Inspection Market: Top 3 Company Market Share, Value 2022

4.2. Global Surface Vision and Inspection Market: Company Revenue Share Analysis, 2022

4.3. Company Assessment Metrics, 2022

4.3.1. Stars

4.3.2. Emerging Leaders

4.3.3. Pervasive Players

4.3.4. Participants

4.4. Startups/ SMEs Assessment Metrics, 2022

4.4.1. Progressive Companies

4.4.2. Responsive Companies

4.4.3. Dynamic Companies

4.4.4. Starting Blocks

4.5. Strategic Development

4.5.1. Acquisition and Mergers

4.5.2. New Product Launch

4.5.3. Regional Expansion

4.5.4. Partnerships

4.6. Key Player Product Matrix

4.7. Potential for New Players in the Global Surface Vision and Inspection Market


5. Premium Insights

5.1. STAR (Situation, Task, Action, Results) Analysis

5.2. Porter’s Five Forces Analysis

5.2.1. Threat of New Entrants

5.2.2. Bargaining Power of Buyers/Consumers

5.2.3. Bargaining Power of Suppliers

5.2.4. Threat of Substitute Types

5.2.5. Intensity of Competitive Rivalry

5.3. PESTEL Analysis

5.3.1. Political Factors

5.3.2. Economic Factors

5.3.3. Social Factors

5.3.4. Technological Factors

5.3.5. Environmental Factors

5.3.6. Legal Factors

5.4. Key Market Trends

5.4.1. Demand Side Trends

5.4.2. Supply Side Trends

5.5. Value Chain Analysis

5.6. Industry Vertical Analysis

5.6.1. Research and development in the global market

5.6.2. Patent Analysis

5.6.3. Emerging technologies and their potential disruption to the market

5.7. Consumer Behaviour Analysis

5.7.1. Consumer Preferences and Expectations

5.7.2. Factors Influencing Consumer Buying Decisions

5.7.2.1. North America

5.7.2.2. Europe

5.7.2.3. Asia Pacific

5.7.2.4. Latin America

5.7.2.5. Middle East and Africa

5.7.3. Consumer Pain Points

5.8. Analysis and Recommendations

5.9. Adjacent Market Analysis


6. Market Positioning of Key Players, 2022

6.1. Company market share of key players, 2022

6.2. Competitive Benchmarking

6.3. Market Positioning of Key Vendors

6.4. Geographical Presence Analysis

6.5. Major Strategies Adopted by Key Players

6.5.1. Key Strategies Analysis

6.5.2. Mergers and Acquisitions

6.5.3. Partnerships

6.5.4. Product Launch

6.5.5. Geographical Expansion

6.5.6. Others


7. Impact Analysis of COVID 19 and Russia – Ukraine War on Surface Vision and Inspection Market

7.1. Ukraine-Russia War Impact

7.1.1. Uncertainty and Economic Instability

7.1.2. Supply chain disruptions

7.1.3. Regional market shifts

7.1.4. Shift in government priorities

7.2. COVID-19 Impact Analysis

7.2.1. Supply Chain Disruptions

7.2.2. Demand Fluctuations

7.2.3. Shift in Product Mix

7.2.4. Reduced Industrial Activity

7.2.5. Regional Impact Analysis

7.2.5.1. North America

7.2.5.2. Europe

7.2.5.3. Asia Pacific

7.2.5.4. Latin America

7.2.5.5. Middle East and Africa


8. Global Surface Vision and Inspection Market, By Component

8.1. Global Surface Vision and Inspection Market Overview, by Component

8.1.1. Global Surface Vision and Inspection Market Revenue Share, By Component, 2022 Vs 2030 (in %)

8.2. Hardware

8.2.1. Global Surface Vision and Inspection Market, By Hardware, By Region, 2017-2030 (US$ Mn)

8.2.2. Market Dynamics for Hardware

8.2.2.1. Drivers

8.2.2.2. Restraints

8.2.2.3. Opportunities

8.2.2.4. Trends

8.3. Software

8.3.1. Global Surface Vision and Inspection Market, By Software, By Region, 2017-2030 (US$ Mn)

8.3.2. Market Dynamics for Software

8.3.2.1. Drivers

8.3.2.2. Restraints

8.3.2.3. Opportunities

8.3.2.4. Trends


9. Global Surface Vision and Inspection Market, By Technology

9.1. Global Surface Vision and Inspection Market Overview, by Technology

9.1.1. Global Surface Vision and Inspection Market Revenue Share, By Technology, 2022 Vs 2030 (in %)

9.2. Machine Vision Systems

9.2.1. Global Surface Vision and Inspection Market, By Machine Vision Systems, By Region, 2017-2030 (US$ Mn)

9.2.2. Market Dynamics for Machine Vision Systems

9.2.2.1. Drivers

9.2.2.2. Restraints

9.2.2.3. Opportunities

9.2.2.4. Trends

9.3. Computer Vision Systems

9.3.1. Global Surface Vision and Inspection Market, By Computer Vision Systems, By Region, 2017-2030 (US$ Mn)

9.3.2. Market Dynamics for Computer Vision Systems

9.3.2.1. Drivers

9.3.2.2. Restraints

9.3.2.3. Opportunities

9.3.2.4. Trends


10. Global Surface Vision and Inspection Market, By Application

10.1. Global Surface Vision and Inspection Market Overview, by Application

10.1.1. Global Surface Vision and Inspection Market Revenue Share, By Application, 2022 Vs 2030 (in %)

10.2. Quality Control and Inspection

10.2.1. Global Surface Vision and Inspection Market, By Quality Control and Inspection, By Region, 2017-2030 (US$ Mn)

10.2.2. Market Dynamics for Quality Control and Inspection

10.2.2.1. Drivers

10.2.2.2. Restraints

10.2.2.3. Opportunities

10.2.2.4. Trends

10.3. Measurement and Metrology

10.3.1. Global Surface Vision and Inspection Market, By Measurement and Metrology, By Region, 2017-2030 (US$ Mn)

10.3.2. Market Dynamics for Measurement and Metrology

10.3.2.1. Drivers

10.3.2.2. Restraints

10.3.2.3. Opportunities

10.3.2.4. Trends

10.4. Defect Detection and Classification

10.4.1. Global Surface Vision and Inspection Market, By Defect Detection and Classification, By Region, 2017-2030 (US$ Mn)

10.4.2. Market Dynamics for Defect Detection and Classification

10.4.2.1. Drivers

10.4.2.2. Restraints

10.4.2.3. Opportunities

10.4.2.4. Trends

10.5. Surface Texture Analysis

10.5.1. Global Surface Vision and Inspection Market, By Surface Texture Analysis, By Region, 2017-2030 (US$ Mn)

10.5.2. Market Dynamics for Surface Texture Analysis

10.5.2.1. Drivers

10.5.2.2. Restraints

10.5.2.3. Opportunities

10.5.2.4. Trends

10.6. Pattern Recognition

10.6.1. Global Surface Vision and Inspection Market, By Pattern Recognition, By Region, 2017-2030 (US$ Mn)

10.6.2. Market Dynamics for Pattern Recognition

10.6.2.1. Drivers

10.6.2.2. Restraints

10.6.2.3. Opportunities

10.6.2.4. Trends

10.7. Assembly Verification

10.7.1. Global Surface Vision and Inspection Market, By Assembly Verification, By Region, 2017-2030 (US$ Mn)

10.7.2. Market Dynamics for Assembly Verification

10.7.2.1. Drivers

10.7.2.2. Restraints

10.7.2.3. Opportunities

10.7.2.4. Trends

10.8. Code Reading and Verification

10.8.1. Global Surface Vision and Inspection Market, By Code Reading and Verification, By Region, 2017-2030 (US$ Mn)

10.8.2. Market Dynamics for Code Reading and Verification

10.8.2.1. Drivers

10.8.2.2. Restraints

10.8.2.3. Opportunities

10.8.2.4. Trends


11. Global Surface Vision and Inspection Market, By Industry Vertical

11.1. Global Surface Vision and Inspection Market Overview, by Industry Vertical

11.1.1. Global Surface Vision and Inspection Market Revenue Share, By Industry Vertical, 2022 Vs 2030 (in %)

11.2. Manufacturing

11.2.1. Global Surface Vision and Inspection Market, By Manufacturing, By Region, 2017-2030 (US$ Mn)

11.2.2. Market Dynamics for Manufacturing

11.2.2.1. Drivers

11.2.2.2. Restraints

11.2.2.3. Opportunities

11.2.2.4. Trends

11.3. Healthcare and Life Sciences

11.3.1. Global Surface Vision and Inspection Market, By Healthcare and Life Sciences, By Region, 2017-2030 (US$ Mn)

11.3.2. Market Dynamics for Healthcare and Life Sciences

11.3.2.1. Drivers

11.3.2.2. Restraints

11.3.2.3. Opportunities

11.3.2.4. Trends

11.4. Agriculture

11.4.1. Global Surface Vision and Inspection Market, By Agriculture, By Region, 2017-2030 (US$ Mn)

11.4.2. Market Dynamics for Agriculture

11.4.2.1. Drivers

11.4.2.2. Restraints

11.4.2.3. Opportunities

11.4.2.4. Trends

11.5. Logistics and Transportation

11.5.1. Global Surface Vision and Inspection Market, By Logistics and Transportation, By Region, 2017-2030 (US$ Mn)

11.5.2. Market Dynamics for Logistics and Transportation

11.5.2.1. Drivers

11.5.2.2. Restraints

11.5.2.3. Opportunities

11.5.2.4. Trends

11.6. Retail

11.6.1. Global Surface Vision and Inspection Market, By Retail, By Region, 2017-2030 (US$ Mn)

11.6.2. Market Dynamics for Retail

11.6.2.1. Drivers

11.6.2.2. Restraints

11.6.2.3. Opportunities

11.6.2.4. Trends

11.7. Energy and Utilities

11.7.1. Global Surface Vision and Inspection Market, By Energy and Utilities, By Region, 2017-2030 (US$ Mn)

11.7.2. Market Dynamics for Energy and Utilities

11.7.2.1. Drivers

11.7.2.2. Restraints

11.7.2.3. Opportunities

11.7.2.4. Trends


12. Global Surface Vision and Inspection Market, By Inspection Type

12.1. Global Surface Vision and Inspection Market Overview, by Inspection Type

12.1.1. Global Surface Vision and Inspection Market Revenue Share, By Inspection Type, 2022 Vs 2030 (in %)

12.2. 2D Inspection

12.2.1. Global Surface Vision and Inspection Market, By 2D Inspection, By Region, 2017-2030 (US$ Mn)

12.2.2. Market Dynamics for 2D Inspection

12.2.2.1. Drivers

12.2.2.2. Restraints

12.2.2.3. Opportunities

12.2.2.4. Trends

12.3. 3D Inspection

12.3.1. Global Surface Vision and Inspection Market, By 3D Inspection, By Region, 2017-2030 (US$ Mn)

12.3.2. Market Dynamics for 3D Inspection

12.3.2.1. Drivers

12.3.2.2. Restraints

12.3.2.3. Opportunities

12.3.2.4. Trends

12.4. Automated Optical Inspection (AOI)

12.4.1. Global Surface Vision and Inspection Market, By Automated Optical Inspection (AOI), By Region, 2017-2030 (US$ Mn)

12.4.2. Market Dynamics for Automated Optical Inspection (AOI)

12.4.2.1. Drivers

12.4.2.2. Restraints

12.4.2.3. Opportunities

12.4.2.4. Trends

12.5. In-Line Inspection

12.5.1. Global Surface Vision and Inspection Market, By In-Line Inspection, By Region, 2017-2030 (US$ Mn)

12.5.2. Market Dynamics for In-Line Inspection

12.5.2.1. Drivers

12.5.2.2. Restraints

12.5.2.3. Opportunities

12.5.2.4. Trends

12.6. Offline Inspection

12.6.1. Global Surface Vision and Inspection Market, By Offline Inspection, By Region, 2017-2030 (US$ Mn)

12.6.2. Market Dynamics for Offline Inspection

12.6.2.1. Drivers

12.6.2.2. Restraints

12.6.2.3. Opportunities

12.6.2.4. Trends


13. Global Surface Vision and Inspection Market, By Distribution Channels

13.1. Global Surface Vision and Inspection Market Overview, by Distribution Channels

13.1.1. Global Surface Vision and Inspection Market Revenue Share, By Distribution Channels, 2022 Vs 2030 (in %)

13.2. Direct Sales

13.2.1. Global Surface Vision and Inspection Market, By Direct Sales, By Region, 2017-2030 (US$ Mn)

13.2.2. Market Dynamics for Direct Sales

13.2.2.1. Drivers

13.2.2.2. Restraints

13.2.2.3. Opportunities

13.2.2.4. Trends

13.3. Distributors and Resellers

13.3.1. Global Surface Vision and Inspection Market, By Distributors and Resellers, By Region, 2017-2030 (US$ Mn)

13.3.2. Market Dynamics for Distributors and Resellers

13.3.2.1. Drivers

13.3.2.2. Restraints

13.3.2.3. Opportunities

13.3.2.4. Trends


14. Global Surface Vision and Inspection Market, By Integration

14.1. Global Surface Vision and Inspection Market Overview, by Integration

14.1.1. Global Surface Vision and Inspection Market Revenue Share, By Integration, 2022 Vs 2030 (in %)

14.2. Standalone Systems

14.2.1. Global Surface Vision and Inspection Market, By Standalone Systems, By Region, 2017-2030 (US$ Mn)

14.2.2. Market Dynamics for Standalone Systems

14.2.2.1. Drivers

14.2.2.2. Restraints

14.2.2.3. Opportunities

14.2.2.4. Trends

14.3. Integrated Systems (Embedded in Production Lines)

14.3.1. Global Surface Vision and Inspection Market, By Integrated Systems (Embedded in Production Lines), By Region, 2017-2030 (US$ Mn)

14.3.2. Market Dynamics for Integrated Systems (Embedded in Production Lines)

14.3.2.1. Drivers

14.3.2.2. Restraints

14.3.2.3. Opportunities

14.3.2.4. Trends


15. Global Surface Vision and Inspection Market, By Region

15.1. Global Surface Vision and Inspection Market Overview, by Region

15.1.1. Global Surface Vision and Inspection Market, By Region, 2022 vs 2030 (in%)

15.2. Component

15.2.1. Global Surface Vision and Inspection Market, By Component, 2017-2030 (US$ Mn)

15.3. Technology

15.3.1. Global Surface Vision and Inspection Market, By Technology, 2017-2030 (US$ Mn)

15.4. Application

15.4.1. Global Surface Vision and Inspection Market, By Application, 2017-2030 (US$ Mn)

15.5. Industry Vertical

15.5.1. Global Surface Vision and Inspection Market, By Industry Vertical, 2017-2030 (US$ Mn)

15.6. Inspection Type

15.6.1. Global Surface Vision and Inspection Market, By Inspection Type, 2017-2030 (US$ Mn)

15.7. Distribution Channels

15.7.1. Global Surface Vision and Inspection Market, By Distribution Channels, 2017-2030 (US$ Mn)

15.8. Integration

15.8.1. Global Surface Vision and Inspection Market, By Integration, 2017-2030 (US$ Mn)


16. North America Surface Vision and Inspection Market Analysis

16.1. Overview

16.1.1. Market Dynamics for North America

16.1.1.1. Drivers

16.1.1.2. Restraints

16.1.1.3. Opportunities

16.1.1.4. Trends

16.2. North America Surface Vision and Inspection Market, by Component, 2017-2030(US$ Mn)

16.2.1. Overview

16.2.2. SRC Analysis

16.3. North America Surface Vision and Inspection Market, by Technology, 2017-2030(US$ Mn)

16.3.1. Overview

16.3.2. SRC Analysis

16.4. North America Surface Vision and Inspection Market, by Application, 2017-2030(US$ Mn)

16.4.1. Overview

16.4.2. SRC Analysis

16.5. North America Surface Vision and Inspection Market, by Industry Vertical, 2017-2030(US$ Mn)

16.5.1. Overview

16.5.2. SRC Analysis

16.6. North America Surface Vision and Inspection Market, by Inspection Type, 2017-2030(US$ Mn)

16.6.1. Overview

16.6.2. SRC Analysis

16.7. North America Surface Vision and Inspection Market, by Distribution Channels, 2017-2030(US$ Mn)

16.7.1. Overview

16.7.2. SRC Analysis

16.8. North America Surface Vision and Inspection Market, by Integration, 2017-2030(US$ Mn)

16.8.1. Overview

16.8.2. SRC Analysis

16.9. North America Surface Vision and Inspection Market, by Country, 2017-2030 (US$ Mn)

16.9.1. North America Surface Vision and Inspection Market, by Country, 2022 Vs 2030 (in%)

16.9.2. U.S.

16.9.3. Canada

16.9.4. Mexico


17. Europe Surface Vision and Inspection Market Analysis

17.1. Overview

17.1.1. Market Dynamics for Europe

17.1.1.1. Drivers

17.1.1.2. Restraints

17.1.1.3. Opportunities

17.1.1.4. Trends

17.2. Europe Surface Vision and Inspection Market, by Component, 2017-2030(US$ Mn)

17.2.1. Overview

17.2.2. SRC Analysis

17.3. Europe Surface Vision and Inspection Market, by Technology, 2017-2030(US$ Mn)

17.3.1. Overview

17.3.2. SRC Analysis

17.4. Europe Surface Vision and Inspection Market, by Application, 2017-2030(US$ Mn)

17.4.1. Overview

17.4.2. SRC Analysis

17.5. Europe Surface Vision and Inspection Market, by Industry Vertical, 2017-2030(US$ Mn)

17.5.1. Overview

17.5.2. SRC Analysis

17.6. Europe Surface Vision and Inspection Market, by Inspection Type, 2017-2030(US$ Mn)

17.6.1. Overview

17.6.2. SRC Analysis

17.7. Europe Surface Vision and Inspection Market, by Distribution Channels, 2017-2030(US$ Mn)

17.7.1. Overview

17.7.2. SRC Analysis

17.8. Europe Surface Vision and Inspection Market, by Integration, 2017-2030(US$ Mn)

17.8.1. Overview

17.8.2. SRC Analysis

17.9. Europe Surface Vision and Inspection Market, by Country, 2017-2030 (US$ Mn)

17.9.1. Europe Surface Vision and Inspection Market, by Country, 2022 Vs 2030 (in%)

17.9.2. UK

17.9.3. France

17.9.4. Germany

17.9.5. Italy

17.9.6. Spain

17.9.7. Benelux

17.9.8. Russia

17.9.9. Rest of Europe


18. Asia Pacific Surface Vision and Inspection Market Analysis

18.1. Overview

18.1.1. Market Dynamics for Asia Pacific

18.1.1.1. Drivers

18.1.1.2. Restraints

18.1.1.3. Opportunities

18.1.1.4. Trends

18.2. Asia Pacific Surface Vision and Inspection Market, by Component, 2017-2030(US$ Mn)

18.2.1. Overview

18.2.2. SRC Analysis

18.3. Asia Pacific Surface Vision and Inspection Market, by Technology, 2017-2030(US$ Mn)

18.3.1. Overview

18.3.2. SRC Analysis

18.4. Asia Pacific Surface Vision and Inspection Market, by Application, 2017-2030(US$ Mn)

18.4.1. Overview

18.4.2. SRC Analysis

18.5. Asia Pacific Surface Vision and Inspection Market, by Industry Vertical, 2017-2030(US$ Mn)

18.5.1. Overview

18.5.2. SRC Analysis

18.6. Asia Pacific Surface Vision and Inspection Market, by Inspection Type, 2017-2030(US$ Mn)

18.6.1. Overview

18.6.2. SRC Analysis

18.7. Asia Pacific Surface Vision and Inspection Market, by Distribution Channels, 2017-2030(US$ Mn)

18.7.1. Overview

18.7.2. SRC Analysis

18.8. Asia Pacific Surface Vision and Inspection Market, by Integration, 2017-2030(US$ Mn)

18.8.1. Overview

18.8.2. SRC Analysis

18.9. Asia Pacific Surface Vision and Inspection Market, by Country, 2017-2030 (US$ Mn)

18.9.1. Asia Pacific Surface Vision and Inspection Market, by Country, 2022 Vs 2030 (in%)

18.9.2. China

18.9.3. Japan

18.9.4. India

18.9.5. South Korea

18.9.6. South East Asia

18.9.7. Rest of Asia Pacific


19. Latin America Surface Vision and Inspection Market Analysis

19.1. Overview

19.1.1. Market Dynamics for Latin America

19.1.1.1. Drivers

19.1.1.2. Restraints

19.1.1.3. Opportunities

19.1.1.4. Trends

19.2. Latin America Surface Vision and Inspection Market, by Component, 2017-2030(US$ Mn)

19.2.1. Overview

19.2.2. SRC Analysis

19.3. Latin America Surface Vision and Inspection Market, by Technology, 2017-2030(US$ Mn)

19.3.1. Overview

19.3.2. SRC Analysis

19.4. Latin America Surface Vision and Inspection Market, by Application, 2017-2030(US$ Mn)

19.4.1. Overview

19.4.2. SRC Analysis

19.5. Latin America Surface Vision and Inspection Market, by Industry Vertical, 2017-2030(US$ Mn)

19.5.1. Overview

19.5.2. SRC Analysis

19.6. Latin America Surface Vision and Inspection Market, by Inspection Type, 2017-2030(US$ Mn)

19.6.1. Overview

19.6.2. SRC Analysis

19.7. Latin America Surface Vision and Inspection Market, by Distribution Channels, 2017-2030(US$ Mn)

19.7.1. Overview

19.7.2. SRC Analysis

19.8. Latin America Surface Vision and Inspection Market, by Integration, 2017-2030(US$ Mn)

19.8.1. Overview

19.8.2. SRC Analysis

19.9. Latin America Surface Vision and Inspection Market, by Country, 2017-2030 (US$ Mn)

19.9.1. Latin America Surface Vision and Inspection Market, by Country, 2022 Vs 2030 (in%)

19.9.2. Brazil

19.9.3. Argentina

19.9.4. Rest of Latin America


20. Middle East Surface Vision and Inspection Market Analysis

20.1. Overview

20.1.1. Market Dynamics for Middle East

20.1.1.1. Drivers

20.1.1.2. Restraints

20.1.1.3. Opportunities

20.1.1.4. Trends

20.2. Middle East Surface Vision and Inspection Market, by Component, 2017-2030(US$ Mn)

20.2.1. Overview

20.2.2. SRC Analysis

20.3. Middle East Surface Vision and Inspection Market, by Technology, 2017-2030(US$ Mn)

20.3.1. Overview

20.3.2. SRC Analysis

20.4. Middle East Surface Vision and Inspection Market, by Application, 2017-2030(US$ Mn)

20.4.1. Overview

20.4.2. SRC Analysis

20.5. Middle East Surface Vision and Inspection Market, by Industry Vertical, 2017-2030(US$ Mn)

20.5.1. Overview

20.5.2. SRC Analysis

20.6. Middle East Surface Vision and Inspection Market, by Inspection Type, 2017-2030(US$ Mn)

20.6.1. Overview

20.6.2. SRC Analysis

20.7. Middle East Surface Vision and Inspection Market, by Distribution Channels, 2017-2030(US$ Mn)

20.7.1. Overview

20.7.2. SRC Analysis

20.8. Middle East Surface Vision and Inspection Market, by Integration, 2017-2030(US$ Mn)

20.8.1. Overview

20.8.2. SRC Analysis

20.9. Middle East Surface Vision and Inspection Market, by Country, 2017-2030 (US$ Mn)

20.9.1. Middle East Surface Vision and Inspection Market, by Country, 2022 Vs 2030 (in%)

20.9.2. UAE

20.9.3. Saudi Arabia

20.9.4. Rest of Middle East


21. Africa Surface Vision and Inspection Market Analysis

21.1. Overview

21.1.1. Market Dynamics for Africa

21.1.1.1. Drivers

21.1.1.2. Restraints

21.1.1.3. Opportunities

21.1.1.4. Trends

21.2. Africa Surface Vision and Inspection Market, by Component, 2017-2030(US$ Mn)

21.2.1. Overview

21.2.2. SRC Analysis

21.3. Africa Surface Vision and Inspection Market, by Technology, 2017-2030(US$ Mn)

21.3.1. Overview

21.3.2. SRC Analysis

21.4. Africa Surface Vision and Inspection Market, by Application, 2017-2030(US$ Mn)

21.4.1. Overview

21.4.2. SRC Analysis

21.5. Africa Surface Vision and Inspection Market, by Industry Vertical, 2017-2030(US$ Mn)

21.5.1. Overview

21.5.2. SRC Analysis

21.6. Africa Surface Vision and Inspection Market, by Inspection Type, 2017-2030(US$ Mn)

21.6.1. Overview

21.6.2. SRC Analysis

21.7. Africa Surface Vision and Inspection Market, by Distribution Channels, 2017-2030(US$ Mn)

21.7.1. Overview

21.7.2. SRC Analysis

21.8. Africa Surface Vision and Inspection Market, by Integration, 2017-2030(US$ Mn)

21.8.1. Overview

21.8.2. SRC Analysis

21.9. Africa Surface Vision and Inspection Market, by Country, 2017-2030 (US$ Mn)

21.9.1. Africa Surface Vision and Inspection Market, by Country, 2022 Vs 2030 (in%)

21.9.2. South Africa

21.9.3. Egypt

21.9.4. Rest of Africa


22. Company Profiles

22.1. Adept Technology, Inc.

22.1.1. Company Overview

22.1.2. Products/Services Portfolio

22.1.3. Geographical Presence

22.1.4. SWOT Analysis

22.1.5. Financial Summary

22.1.5.1. Market Revenue and Net Profit (2019-2022)

22.1.5.2. Business Segment Revenue Analysis

22.1.5.3. Geographical Revenue Analysis

22.2. Cognex Corporation

22.3. Baumer Inspection

22.4. Edmund Optics Inc.

22.5. ISRA Vision AG

22.6. ETS SuperVision BV

22.7. Matrox Imaging

22.8. Industrial Vision Systems Ltd.

22.9. Microscan Systems, Inc.

22.10. Panasonic Corporation

22.11. Omron Corporation

22.12. Teledyne DALSA Inc.

22.13. Perceptron Inc.

22.14. Vitronic GmbH

22.15. Others


23. Research Methodology

23.1. Research Methodology

23.2. Phase I – Secondary Research

23.3. Phase II – Data Modelling

23.3.1. Company Share Analysis Model

23.3.2. Revenue Based Modelling

23.4. Phase III – Primary Research

23.5. Research Limitations

23.5.1. Assumptions


List of Figures

FIG. 1 Global Surface Vision and Inspection Market: Research Methodology

FIG. 2 Market Size Estimation – Top Down & Bottom up Approach

FIG. 3 Global Surface Vision and Inspection Market Segmentation

FIG. 4 Global Surface Vision and Inspection Market, by Component, 2022 (US$ Mn)

FIG. 5 Global Surface Vision and Inspection Market, by Technology, 2022 (US$ Mn)

FIG. 6 Global Surface Vision and Inspection Market, by Application, 2022 (US$ Mn)

FIG. 7 Global Surface Vision and Inspection Market, by Industry Vertical, 2022 (US$ Mn)

FIG. 8 Global Surface Vision and Inspection Market, by Inspection Type, 2022 (US$ Mn)

FIG. 9 Global Surface Vision and Inspection Market, by Distribution Channels, 2022 (US$ Mn)

FIG. 10 Global Surface Vision and Inspection Market, by Integration, 2022 (US$ Mn)

FIG. 11 Global Surface Vision and Inspection Market, by Geography, 2022 (US$ Mn)

FIG. 12 Attractive Investment Proposition, by Component, 2022

FIG. 13 Attractive Investment Proposition, by Technology, 2022

FIG. 14 Attractive Investment Proposition, by Application, 2022

FIG. 15 Attractive Investment Proposition, by Industry Vertical, 2022

FIG. 16 Attractive Investment Proposition, by Inspection Type, 2022

FIG. 17 Attractive Investment Proposition, by Distribution Channels, 2022

FIG. 18 Attractive Investment Proposition, by Integration, 2022

FIG. 19 Attractive Investment Proposition, by Geography, 2022

FIG. 20 Global Market Share Analysis of Key Surface Vision and Inspection Market Manufacturers, 2022

FIG. 21 Global Market Positioning of Key Surface Vision and Inspection Market Manufacturers, 2022

FIG. 22 Global Surface Vision and Inspection Market Value Contribution, By Component, 2022 & 2030 (Value %)

FIG. 23 Global Surface Vision and Inspection Market, by Hardware, Value, 2017-2030 (US$ Mn)

FIG. 24 Global Surface Vision and Inspection Market, by Software, Value, 2017-2030 (US$ Mn)

FIG. 25 Global Surface Vision and Inspection Market Value Contribution, By Technology, 2022 & 2030 (Value %)

FIG. 26 Global Surface Vision and Inspection Market, by Machine Vision Systems, Value, 2017-2030 (US$ Mn)

FIG. 27 Global Surface Vision and Inspection Market, by Computer Vision Systems, Value, 2017-2030 (US$ Mn)

FIG. 28 Global Surface Vision and Inspection Market Value Contribution, By Application, 2022 & 2030 (Value %)

FIG. 29 Global Surface Vision and Inspection Market, by Quality Control and Inspection, Value, 2017-2030 (US$ Mn)

FIG. 30 Global Surface Vision and Inspection Market, by Measurement and Metrology, Value, 2017-2030 (US$ Mn)

FIG. 31 Global Surface Vision and Inspection Market, by Defect Detection and Classification, Value, 2017-2030 (US$ Mn)

FIG. 32 Global Surface Vision and Inspection Market, by Surface Texture Analysis, Value, 2017-2030 (US$ Mn)

FIG. 33 Global Surface Vision and Inspection Market, by Pattern Recognition, Value, 2017-2030 (US$ Mn)

FIG. 34 Global Surface Vision and Inspection Market, by Assembly Verification, Value, 2017-2030 (US$ Mn)

FIG. 35 Global Surface Vision and Inspection Market, by Code Reading and Verification, Value, 2017-2030 (US$ Mn)

FIG. 36 Global Surface Vision and Inspection Market Value Contribution, By Industry Vertical, 2022 & 2030 (Value %)

FIG. 37 Global Surface Vision and Inspection Market, by Manufacturing, Value, 2017-2030 (US$ Mn)

FIG. 38 Global Surface Vision and Inspection Market, by Healthcare and Life Sciences, Value, 2017-2030 (US$ Mn)

FIG. 39 Global Surface Vision and Inspection Market, by Agriculture, Value, 2017-2030 (US$ Mn)

FIG. 40 Global Surface Vision and Inspection Market, by Logistics and Transportation, Value, 2017-2030 (US$ Mn)

FIG. 41 Global Surface Vision and Inspection Market, by Retail, Value, 2017-2030 (US$ Mn)

FIG. 42 Global Surface Vision and Inspection Market, by Energy and Utilities, Value, 2017-2030 (US$ Mn)

FIG. 43 Global Surface Vision and Inspection Market Value Contribution, By Inspection Type, 2022 & 2030 (Value %)

FIG. 44 Global Surface Vision and Inspection Market, by 2D Inspection, Value, 2017-2030 (US$ Mn)

FIG. 45 Global Surface Vision and Inspection Market, by 3D Inspection, Value, 2017-2030 (US$ Mn)

FIG. 46 Global Surface Vision and Inspection Market, by Automated Optical Inspection (AOI), Value, 2017-2030 (US$ Mn)

FIG. 47 Global Surface Vision and Inspection Market, by In-Line Inspection, Value, 2017-2030 (US$ Mn)

FIG. 48 Global Surface Vision and Inspection Market, by Offline Inspection, Value, 2017-2030 (US$ Mn)

FIG. 49 Global Surface Vision and Inspection Market Value Contribution, By Distribution Channels, 2022 & 2030 (Value %)

FIG. 50 Global Surface Vision and Inspection Market, by Direct Sales, Value, 2017-2030 (US$ Mn)

FIG. 51 Global Surface Vision and Inspection Market, by Distributors and Resellers, Value, 2017-2030 (US$ Mn)

FIG. 52 Global Surface Vision and Inspection Market Value Contribution, By Integration, 2022 & 2030 (Value %)

FIG. 53 Global Surface Vision and Inspection Market, by Standalone Systems, Value, 2017-2030 (US$ Mn)

FIG. 54 Global Surface Vision and Inspection Market, by Integrated Systems (Embedded in Production Lines), Value, 2017-2030 (US$ Mn)

FIG. 55 North America Surface Vision and Inspection Market, 2017-2030 (US$ Mn)

FIG. 56 U.S. Surface Vision and Inspection Market, 2017-2030 (US$ Mn)

FIG. 57 Canada Surface Vision and Inspection Market, 2017-2030 (US$ Mn)

FIG. 58 Mexico Surface Vision and Inspection Market, 2017-2030 (US$ Mn)

FIG. 59 Europe Surface Vision and Inspection Market, 2017-2030 (US$ Mn)

FIG. 60 Germany Surface Vision and Inspection Market, 2017-2030 (US$ Mn)

FIG. 61 France Surface Vision and Inspection Market, 2017-2030 (US$ Mn)

FIG. 62 U.K. Surface Vision and Inspection Market, 2017-2030 (US$ Mn)

FIG. 63 Italy Surface Vision and Inspection Market, 2017-2030 (US$ Mn)

FIG. 64 Spain Surface Vision and Inspection Market, 2017-2030 (US$ Mn)

FIG. 65 Benelux Surface Vision and Inspection Market, 2017-2030 (US$ Mn)

FIG. 66 Russia Surface Vision and Inspection Market, 2017-2030 (US$ Mn)

FIG. 67 Rest of Europe Surface Vision and Inspection Market, 2017-2030 (US$ Mn)

FIG. 68 Asia Pacific Surface Vision and Inspection Market, 2017-2030 (US$ Mn)

FIG. 69 China Surface Vision and Inspection Market, 2017-2030 (US$ Mn)

FIG. 70 Japan Surface Vision and Inspection Market, 2017-2030 (US$ Mn)

FIG. 71 India Surface Vision and Inspection Market, 2017-2030 (US$ Mn)

FIG. 72 South Korea Surface Vision and Inspection Market, 2017-2030 (US$ Mn)

FIG. 73 South-East Asia Surface Vision and Inspection Market, 2017-2030 (US$ Mn)

FIG. 74 Rest of Asia Pacific Surface Vision and Inspection Market, 2017-2030 (US$ Mn)

FIG. 75 Latin America Surface Vision and Inspection Market, 2017-2030 (US$ Mn)

FIG. 76 Brazil Surface Vision and Inspection Market, 2017-2030 (US$ Mn)

FIG. 77 Argentina Surface Vision and Inspection Market, 2017-2030 (US$ Mn)

FIG. 78 Rest of Latin America Surface Vision and Inspection Market, 2017-2030 (US$ Mn)

FIG. 79 Middle East Surface Vision and Inspection Market, 2017-2030 (US$ Mn)

FIG. 80 UAE Surface Vision and Inspection Market, 2017-2030 (US$ Mn)

FIG. 81 Saudi Arabia Surface Vision and Inspection Market, 2017-2030 (US$ Mn)

FIG. 82 Rest of Middle East Surface Vision and Inspection Market, 2017-2030 (US$ Mn)

FIG. 83 Africa Surface Vision and Inspection Market, 2017-2030 (US$ Mn)

FIG. 84 South Africa Surface Vision and Inspection Market, 2017-2030 (US$ Mn)

FIG. 85 Egypt Surface Vision and Inspection Market, 2017-2030 (US$ Mn)

FIG. 86 Rest of Africa Surface Vision and Inspection Market, 2017-2030 (US$ Mn)


List of Tables

TABLE 1 Market Snapshot: Global Surface Vision and Inspection Market

TABLE 2 Global Surface Vision and Inspection Market: Market Drivers Impact Analysis

TABLE 3 Global Surface Vision and Inspection Market: Market Restraints Impact Analysis

TABLE 4 Global Surface Vision and Inspection Market, by Competitive Benchmarking, 2022

TABLE 5 Global Surface Vision and Inspection Market, by Geographical Presence Analysis, 2022

TABLE 6 Global Surface Vision and Inspection Market, by Key Strategies Analysis, 2022

TABLE 7 Global Surface Vision and Inspection Market, by Hardware, By Region, 2017-2022 (US$ Mn)

TABLE 8 Global Surface Vision and Inspection Market, by Hardware, By Region, 2023-2030 (US$ Mn)

TABLE 9 Global Surface Vision and Inspection Market, by Software, By Region, 2017-2022 (US$ Mn)

TABLE 10 Global Surface Vision and Inspection Market, by Software, By Region, 2023-2030 (US$ Mn)

TABLE 11 Global Surface Vision and Inspection Market, by Machine Vision Systems, By Region, 2017-2022 (US$ Mn)

TABLE 12 Global Surface Vision and Inspection Market, by Machine Vision Systems, By Region, 2023-2030 (US$ Mn)

TABLE 13 Global Surface Vision and Inspection Market, by Computer Vision Systems, By Region, 2017-2022 (US$ Mn)

TABLE 14 Global Surface Vision and Inspection Market, by Computer Vision Systems, By Region, 2023-2030 (US$ Mn)

TABLE 15 Global Surface Vision and Inspection Market, by Quality Control and Inspection, By Region, 2017-2022 (US$ Mn)

TABLE 16 Global Surface Vision and Inspection Market, by Quality Control and Inspection, By Region, 2023-2030 (US$ Mn)

TABLE 17 Global Surface Vision and Inspection Market, by Measurement and Metrology, By Region, 2017-2022 (US$ Mn)

TABLE 18 Global Surface Vision and Inspection Market, by Measurement and Metrology, By Region, 2023-2030 (US$ Mn)

TABLE 19 Global Surface Vision and Inspection Market, by Defect Detection and Classification, By Region, 2017-2022 (US$ Mn)

TABLE 20 Global Surface Vision and Inspection Market, by Defect Detection and Classification, By Region, 2023-2030 (US$ Mn)

TABLE 21 Global Surface Vision and Inspection Market, by Surface Texture Analysis, By Region, 2017-2022 (US$ Mn)

TABLE 22 Global Surface Vision and Inspection Market, by Surface Texture Analysis, By Region, 2023-2030 (US$ Mn)

TABLE 23 Global Surface Vision and Inspection Market, by Pattern Recognition, By Region, 2017-2022 (US$ Mn)

TABLE 24 Global Surface Vision and Inspection Market, by Pattern Recognition, By Region, 2023-2030 (US$ Mn)

TABLE 25 Global Surface Vision and Inspection Market, by Assembly Verification, By Region, 2017-2022 (US$ Mn)

TABLE 26 Global Surface Vision and Inspection Market, by Assembly Verification, By Region, 2023-2030 (US$ Mn)

TABLE 27 Global Surface Vision and Inspection Market, by Code Reading and Verification, By Region, 2017-2022 (US$ Mn)

TABLE 28 Global Surface Vision and Inspection Market, by Code Reading and Verification, By Region, 2023-2030 (US$ Mn)

TABLE 29 Global Surface Vision and Inspection Market, by Manufacturing, By Region, 2017-2022 (US$ Mn)

TABLE 30 Global Surface Vision and Inspection Market, by Manufacturing, By Region, 2023-2030 (US$ Mn)

TABLE 31 Global Surface Vision and Inspection Market, by Healthcare and Life Sciences, By Region, 2017-2022 (US$ Mn)

TABLE 32 Global Surface Vision and Inspection Market, by Healthcare and Life Sciences, By Region, 2023-2030 (US$ Mn)

TABLE 33 Global Surface Vision and Inspection Market, by Agriculture, By Region, 2017-2022 (US$ Mn)

TABLE 34 Global Surface Vision and Inspection Market, by Agriculture, By Region, 2023-2030 (US$ Mn)

TABLE 35 Global Surface Vision and Inspection Market, by Logistics and Transportation, By Region, 2017-2022 (US$ Mn)

TABLE 36 Global Surface Vision and Inspection Market, by Logistics and Transportation, By Region, 2023-2030 (US$ Mn)

TABLE 37 Global Surface Vision and Inspection Market, by Retail, By Region, 2017-2022 (US$ Mn)

TABLE 38 Global Surface Vision and Inspection Market, by Retail, By Region, 2023-2030 (US$ Mn)

TABLE 39 Global Surface Vision and Inspection Market, by Energy and Utilities, By Region, 2017-2022 (US$ Mn)

TABLE 40 Global Surface Vision and Inspection Market, by Energy and Utilities, By Region, 2023-2030 (US$ Mn)

TABLE 41 Global Surface Vision and Inspection Market, by 2D Inspection, By Region, 2017-2022 (US$ Mn)

TABLE 42 Global Surface Vision and Inspection Market, by 2D Inspection, By Region, 2023-2030 (US$ Mn)

TABLE 43 Global Surface Vision and Inspection Market, by 3D Inspection, By Region, 2017-2022 (US$ Mn)

TABLE 44 Global Surface Vision and Inspection Market, by 3D Inspection, By Region, 2023-2030 (US$ Mn)

TABLE 45 Global Surface Vision and Inspection Market, by Automated Optical Inspection (AOI), By Region, 2017-2022 (US$ Mn)

TABLE 46 Global Surface Vision and Inspection Market, by Automated Optical Inspection (AOI), By Region, 2023-2030 (US$ Mn)

TABLE 47 Global Surface Vision and Inspection Market, by In-Line Inspection, By Region, 2017-2022 (US$ Mn)

TABLE 48 Global Surface Vision and Inspection Market, by In-Line Inspection, By Region, 2023-2030 (US$ Mn)

TABLE 49 Global Surface Vision and Inspection Market, by Offline Inspection, By Region, 2017-2022 (US$ Mn)

TABLE 50 Global Surface Vision and Inspection Market, by Offline Inspection, By Region, 2023-2030 (US$ Mn)

TABLE 51 Global Surface Vision and Inspection Market, by Direct Sales, By Region, 2017-2022 (US$ Mn)

TABLE 52 Global Surface Vision and Inspection Market, by Direct Sales, By Region, 2023-2030 (US$ Mn)

TABLE 53 Global Surface Vision and Inspection Market, by Distributors and Resellers, By Region, 2017-2022 (US$ Mn)

TABLE 54 Global Surface Vision and Inspection Market, by Distributors and Resellers, By Region, 2023-2030 (US$ Mn)

TABLE 55 Global Surface Vision and Inspection Market, by Standalone Systems, By Region, 2017-2022 (US$ Mn)

TABLE 56 Global Surface Vision and Inspection Market, by Standalone Systems, By Region, 2023-2030 (US$ Mn)

TABLE 57 Global Surface Vision and Inspection Market, by Integrated Systems (Embedded in Production Lines), By Region, 2017-2022 (US$ Mn)

TABLE 58 Global Surface Vision and Inspection Market, by Integrated Systems (Embedded in Production Lines), By Region, 2023-2030 (US$ Mn)

TABLE 59 Global Surface Vision and Inspection Market, by Component, 2017-2022 (US$ Mn)

TABLE 60 Global Surface Vision and Inspection Market, by Component, 2023-2030 (US$ Mn)

TABLE 61 Global Surface Vision and Inspection Market, by Technology, 2017-2022 (US$ Mn)

TABLE 62 Global Surface Vision and Inspection Market, by Technology, 2023-2030 (US$ Mn)

TABLE 63 Global Surface Vision and Inspection Market, by Application, 2017-2022 (US$ Mn)

TABLE 64 Global Surface Vision and Inspection Market, by Application, 2023-2030 (US$ Mn)

TABLE 65 Global Surface Vision and Inspection Market, by Industry Vertical, 2017-2022 (US$ Mn)

TABLE 66 Global Surface Vision and Inspection Market, by Industry Vertical, 2023-2030 (US$ Mn)

TABLE 67 Global Surface Vision and Inspection Market, by Inspection Type, 2017-2022 (US$ Mn)

TABLE 68 Global Surface Vision and Inspection Market, by Inspection Type, 2023-2030 (US$ Mn)

TABLE 69 Global Surface Vision and Inspection Market, by Distribution Channels, 2017-2022 (US$ Mn)

TABLE 70 Global Surface Vision and Inspection Market, by Distribution Channels, 2023-2030 (US$ Mn)

TABLE 71 Global Surface Vision and Inspection Market, by Integration, 2017-2022 (US$ Mn)

TABLE 72 Global Surface Vision and Inspection Market, by Integration, 2023-2030 (US$ Mn)

TABLE 73 Global Surface Vision and Inspection Market, by Region, 2017-2022 (US$ Mn)

TABLE 74 Global Surface Vision and Inspection Market, by Region, 2023-2030 (US$ Mn)

TABLE 75 North America Surface Vision and Inspection Market, by Component, 2017-2022 (US$ Mn)

TABLE 76 North America Surface Vision and Inspection Market, by Component, 2023-2030 (US$ Mn)

TABLE 77 North America Surface Vision and Inspection Market, by Technology, 2017-2022 (US$ Mn)

TABLE 78 North America Surface Vision and Inspection Market, by Technology, 2023-2030 (US$ Mn)

TABLE 79 North America Surface Vision and Inspection Market, by Application, 2017-2022 (US$ Mn)

TABLE 80 North America Surface Vision and Inspection Market, by Application, 2023-2030 (US$ Mn)

TABLE 81 North America Surface Vision and Inspection Market, by Industry Vertical, 2017-2022 (US$ Mn)

TABLE 82 North America Surface Vision and Inspection Market, by Industry Vertical, 2023-2030 (US$ Mn)

TABLE 83 North America Surface Vision and Inspection Market, by Inspection Type, 2017-2022 (US$ Mn)

TABLE 84 North America Surface Vision and Inspection Market, by Inspection Type, 2023-2030 (US$ Mn)

TABLE 85 North America Surface Vision and Inspection Market, by Distribution Channels, 2017-2022 (US$ Mn)

TABLE 86 North America Surface Vision and Inspection Market, by Distribution Channels, 2023-2030 (US$ Mn)

TABLE 87 North America Surface Vision and Inspection Market, by Integration, 2017-2022 (US$ Mn)

TABLE 88 North America Surface Vision and Inspection Market, by Integration, 2023-2030 (US$ Mn)

TABLE 89 North America Surface Vision and Inspection Market, by Country, 2017-2022 (US$ Mn)

TABLE 90 North America Surface Vision and Inspection Market, by Country, 2023-2030 (US$ Mn)

TABLE 91 United States Surface Vision and Inspection Market, by Component, 2017-2022 (US$ Mn)

TABLE 92 United States Surface Vision and Inspection Market, by Component, 2023-2030 (US$ Mn)

TABLE 93 United States Surface Vision and Inspection Market, by Technology, 2017-2022 (US$ Mn)

TABLE 94 United States Surface Vision and Inspection Market, by Technology, 2023-2030 (US$ Mn)

TABLE 95 United States Surface Vision and Inspection Market, by Application, 2017-2022 (US$ Mn)

TABLE 96 United States Surface Vision and Inspection Market, by Application, 2023-2030 (US$ Mn)

TABLE 97 United States Surface Vision and Inspection Market, by Industry Vertical, 2017-2022 (US$ Mn)

TABLE 98 United States Surface Vision and Inspection Market, by Industry Vertical, 2023-2030 (US$ Mn)

TABLE 99 United States Surface Vision and Inspection Market, by Inspection Type, 2017-2022 (US$ Mn)

TABLE 100 United States Surface Vision and Inspection Market, by Inspection Type, 2023-2030 (US$ Mn)

TABLE 101 United States Surface Vision and Inspection Market, by Distribution Channels, 2017-2022 (US$ Mn)

TABLE 102 United States Surface Vision and Inspection Market, by Distribution Channels, 2023-2030 (US$ Mn)

TABLE 103 United States Surface Vision and Inspection Market, by Integration, 2017-2022 (US$ Mn)

TABLE 104 United States Surface Vision and Inspection Market, by Integration, 2023-2030 (US$ Mn)

TABLE 105 Canada Surface Vision and Inspection Market, by Component, 2017-2022 (US$ Mn)

TABLE 106 Canada Surface Vision and Inspection Market, by Component, 2023-2030 (US$ Mn)

TABLE 107 Canada Surface Vision and Inspection Market, by Technology, 2017-2022 (US$ Mn)

TABLE 108 Canada Surface Vision and Inspection Market, by Technology, 2023-2030 (US$ Mn)

TABLE 109 Canada Surface Vision and Inspection Market, by Application, 2017-2022 (US$ Mn)

TABLE 110 Canada Surface Vision and Inspection Market, by Application, 2023-2030 (US$ Mn)

TABLE 111 Canada Surface Vision and Inspection Market, by Industry Vertical, 2017-2022 (US$ Mn)

TABLE 112 Canada Surface Vision and Inspection Market, by Industry Vertical, 2023-2030 (US$ Mn)

TABLE 113 Canada Surface Vision and Inspection Market, by Inspection Type, 2017-2022 (US$ Mn)

TABLE 114 Canada Surface Vision and Inspection Market, by Inspection Type, 2023-2030 (US$ Mn)

TABLE 115 Canada Surface Vision and Inspection Market, by Distribution Channels, 2017-2022 (US$ Mn)

TABLE 116 Canada Surface Vision and Inspection Market, by Distribution Channels, 2023-2030 (US$ Mn)

TABLE 117 Canada Surface Vision and Inspection Market, by Integration, 2017-2022 (US$ Mn)

TABLE 118 Canada Surface Vision and Inspection Market, by Integration, 2023-2030 (US$ Mn)

TABLE 119 Mexico Surface Vision and Inspection Market, by Component, 2017-2022 (US$ Mn)

TABLE 120 Mexico Surface Vision and Inspection Market, by Component, 2023-2030 (US$ Mn)

TABLE 121 Mexico Surface Vision and Inspection Market, by Technology, 2017-2022 (US$ Mn)

TABLE 122 Mexico Surface Vision and Inspection Market, by Technology, 2023-2030 (US$ Mn)

TABLE 123 Mexico Surface Vision and Inspection Market, by Application, 2017-2022 (US$ Mn)

TABLE 124 Mexico Surface Vision and Inspection Market, by Application, 2023-2030 (US$ Mn)

TABLE 125 Mexico Surface Vision and Inspection Market, by Industry Vertical, 2017-2022 (US$ Mn)

TABLE 126 Mexico Surface Vision and Inspection Market, by Industry Vertical, 2023-2030 (US$ Mn)

TABLE 127 Mexico Surface Vision and Inspection Market, by Inspection Type, 2017-2022 (US$ Mn)

TABLE 128 Mexico Surface Vision and Inspection Market, by Inspection Type, 2023-2030 (US$ Mn)

TABLE 129 Mexico Surface Vision and Inspection Market, by Distribution Channels, 2017-2022 (US$ Mn)

TABLE 130 Mexico Surface Vision and Inspection Market, by Distribution Channels, 2023-2030 (US$ Mn)

TABLE 131 Mexico Surface Vision and Inspection Market, by Integration, 2017-2022 (US$ Mn)

TABLE 132 Mexico Surface Vision and Inspection Market, by Integration, 2023-2030 (US$ Mn)

TABLE 133 Europe Surface Vision and Inspection Market, by Component, 2017-2022 (US$ Mn)

TABLE 134 Europe Surface Vision and Inspection Market, by Component, 2023-2030 (US$ Mn)

TABLE 135 Europe Surface Vision and Inspection Market, by Technology, 2017-2022 (US$ Mn)

TABLE 136 Europe Surface Vision and Inspection Market, by Technology, 2023-2030 (US$ Mn)

TABLE 137 Europe Surface Vision and Inspection Market, by Application, 2017-2022 (US$ Mn)

TABLE 138 Europe Surface Vision and Inspection Market, by Application, 2023-2030 (US$ Mn)

TABLE 139 Europe Surface Vision and Inspection Market, by Industry Vertical, 2017-2022 (US$ Mn)

TABLE 140 Europe Surface Vision and Inspection Market, by Industry Vertical, 2023-2030 (US$ Mn)

TABLE 141 Europe Surface Vision and Inspection Market, by Inspection Type, 2017-2022 (US$ Mn)

TABLE 142 Europe Surface Vision and Inspection Market, by Inspection Type, 2023-2030 (US$ Mn)

TABLE 143 Europe Surface Vision and Inspection Market, by Distribution Channels, 2017-2022 (US$ Mn)

TABLE 144 Europe Surface Vision and Inspection Market, by Distribution Channels, 2023-2030 (US$ Mn)

TABLE 145 Europe Surface Vision and Inspection Market, by Integration, 2017-2022 (US$ Mn)

TABLE 146 Europe Surface Vision and Inspection Market, by Integration, 2023-2030 (US$ Mn)

TABLE 147 Europe Surface Vision and Inspection Market, by Country, 2017-2022 (US$ Mn)

TABLE 148 Europe Surface Vision and Inspection Market, by Country, 2023-2030 (US$ Mn)

TABLE 149 Germany Surface Vision and Inspection Market, by Component, 2017-2022 (US$ Mn)

TABLE 150 Germany Surface Vision and Inspection Market, by Component, 2023-2030 (US$ Mn)

TABLE 151 Germany Surface Vision and Inspection Market, by Technology, 2017-2022 (US$ Mn)

TABLE 152 Germany Surface Vision and Inspection Market, by Technology, 2023-2030 (US$ Mn)

TABLE 153 Germany Surface Vision and Inspection Market, by Application, 2017-2022 (US$ Mn)

TABLE 154 Germany Surface Vision and Inspection Market, by Application, 2023-2030 (US$ Mn)

TABLE 155 Germany Surface Vision and Inspection Market, by Industry Vertical, 2017-2022 (US$ Mn)

TABLE 156 Germany Surface Vision and Inspection Market, by Industry Vertical, 2023-2030 (US$ Mn)

TABLE 157 Germany Surface Vision and Inspection Market, by Inspection Type, 2017-2022 (US$ Mn)

TABLE 158 Germany Surface Vision and Inspection Market, by Inspection Type, 2023-2030 (US$ Mn)

TABLE 159 Germany Surface Vision and Inspection Market, by Distribution Channels, 2017-2022 (US$ Mn)

TABLE 160 Germany Surface Vision and Inspection Market, by Distribution Channels, 2023-2030 (US$ Mn)

TABLE 161 Germany Surface Vision and Inspection Market, by Integration, 2017-2022 (US$ Mn)

TABLE 162 Germany Surface Vision and Inspection Market, by Integration, 2023-2030 (US$ Mn)

TABLE 163 France Surface Vision and Inspection Market, by Component, 2017-2022 (US$ Mn)

TABLE 164 France Surface Vision and Inspection Market, by Component, 2023-2030 (US$ Mn)

TABLE 165 France Surface Vision and Inspection Market, by Technology, 2017-2022 (US$ Mn)

TABLE 166 France Surface Vision and Inspection Market, by Technology, 2023-2030 (US$ Mn)

TABLE 167 France Surface Vision and Inspection Market, by Application, 2017-2022 (US$ Mn)

TABLE 168 France Surface Vision and Inspection Market, by Application, 2023-2030 (US$ Mn)

TABLE 169 France Surface Vision and Inspection Market, by Industry Vertical, 2017-2022 (US$ Mn)

TABLE 170 France Surface Vision and Inspection Market, by Industry Vertical, 2023-2030 (US$ Mn)

TABLE 171 France Surface Vision and Inspection Market, by Inspection Type, 2017-2022 (US$ Mn)

TABLE 172 France Surface Vision and Inspection Market, by Inspection Type, 2023-2030 (US$ Mn)

TABLE 173 France Surface Vision and Inspection Market, by Distribution Channels, 2017-2022 (US$ Mn)

TABLE 174 France Surface Vision and Inspection Market, by Distribution Channels, 2023-2030 (US$ Mn)

TABLE 175 France Surface Vision and Inspection Market, by Integration, 2017-2022 (US$ Mn)

TABLE 176 France Surface Vision and Inspection Market, by Integration, 2023-2030 (US$ Mn)

TABLE 177 United Kingdom Surface Vision and Inspection Market, by Component, 2017-2022 (US$ Mn)

TABLE 178 United Kingdom Surface Vision and Inspection Market, by Component, 2023-2030 (US$ Mn)

TABLE 179 United Kingdom Surface Vision and Inspection Market, by Technology, 2017-2022 (US$ Mn)

TABLE 180 United Kingdom Surface Vision and Inspection Market, by Technology, 2023-2030 (US$ Mn)

TABLE 181 United Kingdom Surface Vision and Inspection Market, by Application, 2017-2022 (US$ Mn)

TABLE 182 United Kingdom Surface Vision and Inspection Market, by Application, 2023-2030 (US$ Mn)

TABLE 183 United Kingdom Surface Vision and Inspection Market, by Industry Vertical, 2017-2022 (US$ Mn)

TABLE 184 United Kingdom Surface Vision and Inspection Market, by Industry Vertical, 2023-2030 (US$ Mn)

TABLE 185 United Kingdom Surface Vision and Inspection Market, by Inspection Type, 2017-2022 (US$ Mn)

TABLE 186 United Kingdom Surface Vision and Inspection Market, by Inspection Type, 2023-2030 (US$ Mn)

TABLE 187 United Kingdom Surface Vision and Inspection Market, by Distribution Channels, 2017-2022 (US$ Mn)

TABLE 188 United Kingdom Surface Vision and Inspection Market, by Distribution Channels, 2023-2030 (US$ Mn)

TABLE 189 United Kingdom Surface Vision and Inspection Market, by Integration, 2017-2022 (US$ Mn)

TABLE 190 United Kingdom Surface Vision and Inspection Market, by Integration, 2023-2030 (US$ Mn)

TABLE 191 Italy Surface Vision and Inspection Market, by Component, 2017-2022 (US$ Mn)

TABLE 192 Italy Surface Vision and Inspection Market, by Component, 2023-2030 (US$ Mn)

TABLE 193 Italy Surface Vision and Inspection Market, by Technology, 2017-2022 (US$ Mn)

TABLE 194 Italy Surface Vision and Inspection Market, by Technology, 2023-2030 (US$ Mn)

TABLE 195 Italy Surface Vision and Inspection Market, by Application, 2017-2022 (US$ Mn)

TABLE 196 Italy Surface Vision and Inspection Market, by Application, 2023-2030 (US$ Mn)

TABLE 197 Italy Surface Vision and Inspection Market, by Industry Vertical, 2017-2022 (US$ Mn)

TABLE 198 Italy Surface Vision and Inspection Market, by Industry Vertical, 2023-2030 (US$ Mn)

TABLE 199 Italy Surface Vision and Inspection Market, by Inspection Type, 2017-2022 (US$ Mn)

TABLE 200 Italy Surface Vision and Inspection Market, by Inspection Type, 2023-2030 (US$ Mn)

TABLE 201 Italy Surface Vision and Inspection Market, by Distribution Channels, 2017-2022 (US$ Mn)

TABLE 202 Italy Surface Vision and Inspection Market, by Distribution Channels, 2023-2030 (US$ Mn)

TABLE 203 Italy Surface Vision and Inspection Market, by Integration, 2017-2022 (US$ Mn)

TABLE 204 Italy Surface Vision and Inspection Market, by Integration, 2023-2030 (US$ Mn)

TABLE 205 Spain Surface Vision and Inspection Market, by Component, 2017-2022 (US$ Mn)

TABLE 206 Spain Surface Vision and Inspection Market, by Component, 2023-2030 (US$ Mn)

TABLE 207 Spain Surface Vision and Inspection Market, by Technology, 2017-2022 (US$ Mn)

TABLE 208 Spain Surface Vision and Inspection Market, by Technology, 2023-2030 (US$ Mn)

TABLE 209 Spain Surface Vision and Inspection Market, by Application, 2017-2022 (US$ Mn)

TABLE 210 Spain Surface Vision and Inspection Market, by Application, 2023-2030 (US$ Mn)

TABLE 211 Spain Surface Vision and Inspection Market, by Industry Vertical, 2017-2022 (US$ Mn)

TABLE 212 Spain Surface Vision and Inspection Market, by Industry Vertical, 2023-2030 (US$ Mn)

TABLE 213 Spain Surface Vision and Inspection Market, by Inspection Type, 2017-2022 (US$ Mn)

TABLE 214 Spain Surface Vision and Inspection Market, by Inspection Type, 2023-2030 (US$ Mn)

TABLE 215 Spain Surface Vision and Inspection Market, by Distribution Channels, 2017-2022 (US$ Mn)

TABLE 216 Spain Surface Vision and Inspection Market, by Distribution Channels, 2023-2030 (US$ Mn)

TABLE 217 Spain Surface Vision and Inspection Market, by Integration, 2017-2022 (US$ Mn)

TABLE 218 Spain Surface Vision and Inspection Market, by Integration, 2023-2030 (US$ Mn)

TABLE 219 Benelux Surface Vision and Inspection Market, by Component, 2017-2022 (US$ Mn)

TABLE 220 Benelux Surface Vision and Inspection Market, by Component, 2023-2030 (US$ Mn)

TABLE 221 Benelux Surface Vision and Inspection Market, by Technology, 2017-2022 (US$ Mn)

TABLE 222 Benelux Surface Vision and Inspection Market, by Technology, 2023-2030 (US$ Mn)

TABLE 223 Benelux Surface Vision and Inspection Market, by Application, 2017-2022 (US$ Mn)

TABLE 224 Benelux Surface Vision and Inspection Market, by Application, 2023-2030 (US$ Mn)

TABLE 225 Benelux Surface Vision and Inspection Market, by Industry Vertical, 2017-2022 (US$ Mn)

TABLE 226 Benelux Surface Vision and Inspection Market, by Industry Vertical, 2023-2030 (US$ Mn)

TABLE 227 Benelux Surface Vision and Inspection Market, by Inspection Type, 2017-2022 (US$ Mn)

TABLE 228 Benelux Surface Vision and Inspection Market, by Inspection Type, 2023-2030 (US$ Mn)

TABLE 229 Benelux Surface Vision and Inspection Market, by Distribution Channels, 2017-2022 (US$ Mn)

TABLE 230 Benelux Surface Vision and Inspection Market, by Distribution Channels, 2023-2030 (US$ Mn)

TABLE 231 Benelux Surface Vision and Inspection Market, by Integration, 2017-2022 (US$ Mn)

TABLE 232 Benelux Surface Vision and Inspection Market, by Integration, 2023-2030 (US$ Mn)

TABLE 233 Russia Surface Vision and Inspection Market, by Component, 2017-2022 (US$ Mn)

TABLE 234 Russia Surface Vision and Inspection Market, by Component, 2023-2030 (US$ Mn)

TABLE 235 Russia Surface Vision and Inspection Market, by Technology, 2017-2022 (US$ Mn)

TABLE 236 Russia Surface Vision and Inspection Market, by Technology, 2023-2030 (US$ Mn)

TABLE 237 Russia Surface Vision and Inspection Market, by Application, 2017-2022 (US$ Mn)

TABLE 238 Russia Surface Vision and Inspection Market, by Application, 2023-2030 (US$ Mn)

TABLE 239 Russia Surface Vision and Inspection Market, by Industry Vertical, 2017-2022 (US$ Mn)

TABLE 240 Russia Surface Vision and Inspection Market, by Industry Vertical, 2023-2030 (US$ Mn)

TABLE 241 Russia Surface Vision and Inspection Market, by Inspection Type, 2017-2022 (US$ Mn)

TABLE 242 Russia Surface Vision and Inspection Market, by Inspection Type, 2023-2030 (US$ Mn)

TABLE 243 Russia Surface Vision and Inspection Market, by Distribution Channels, 2017-2022 (US$ Mn)

TABLE 244 Russia Surface Vision and Inspection Market, by Distribution Channels, 2023-2030 (US$ Mn)

TABLE 245 Russia Surface Vision and Inspection Market, by Integration, 2017-2022 (US$ Mn)

TABLE 246 Russia Surface Vision and Inspection Market, by Integration, 2023-2030 (US$ Mn)

TABLE 247 Rest of Europe Surface Vision and Inspection Market, by Component, 2017-2022 (US$ Mn)

TABLE 248 Rest of Europe Surface Vision and Inspection Market, by Component, 2023-2030 (US$ Mn)

TABLE 249 Rest of Europe Surface Vision and Inspection Market, by Technology, 2017-2022 (US$ Mn)

TABLE 250 Rest of Europe Surface Vision and Inspection Market, by Technology, 2023-2030 (US$ Mn)

TABLE 251 Rest of Europe Surface Vision and Inspection Market, by Application, 2017-2022 (US$ Mn)

TABLE 252 Rest of Europe Surface Vision and Inspection Market, by Application, 2023-2030 (US$ Mn)

TABLE 253 Rest of Europe Surface Vision and Inspection Market, by Industry Vertical, 2017-2022 (US$ Mn)

TABLE 254 Rest of Europe Surface Vision and Inspection Market, by Industry Vertical, 2023-2030 (US$ Mn)

TABLE 255 Rest of Europe Surface Vision and Inspection Market, by Inspection Type, 2017-2022 (US$ Mn)

TABLE 256 Rest of Europe Surface Vision and Inspection Market, by Inspection Type, 2023-2030 (US$ Mn)

TABLE 257 Rest of Europe Surface Vision and Inspection Market, by Distribution Channels, 2017-2022 (US$ Mn)

TABLE 258 Rest of Europe Surface Vision and Inspection Market, by Distribution Channels, 2023-2030 (US$ Mn)

TABLE 259 Rest of Europe Surface Vision and Inspection Market, by Integration, 2017-2022 (US$ Mn)

TABLE 260 Rest of Europe Surface Vision and Inspection Market, by Integration, 2023-2030 (US$ Mn)

TABLE 261 Asia Pacific Surface Vision and Inspection Market, by Component, 2017-2022 (US$ Mn)

TABLE 262 Asia Pacific Surface Vision and Inspection Market, by Component, 2023-2030 (US$ Mn)

TABLE 263 Asia Pacific Surface Vision and Inspection Market, by Technology, 2017-2022 (US$ Mn)

TABLE 264 Asia Pacific Surface Vision and Inspection Market, by Technology, 2023-2030 (US$ Mn)

TABLE 265 Asia Pacific Surface Vision and Inspection Market, by Application, 2017-2022 (US$ Mn)

TABLE 266 Asia Pacific Surface Vision and Inspection Market, by Application, 2023-2030 (US$ Mn)

TABLE 267 Asia Pacific Surface Vision and Inspection Market, by Industry Vertical, 2017-2022 (US$ Mn)

TABLE 268 Asia Pacific Surface Vision and Inspection Market, by Industry Vertical, 2023-2030 (US$ Mn)

TABLE 269 Asia Pacific Surface Vision and Inspection Market, by Inspection Type, 2017-2022 (US$ Mn)

TABLE 270 Asia Pacific Surface Vision and Inspection Market, by Inspection Type, 2023-2030 (US$ Mn)

TABLE 271 Asia Pacific Surface Vision and Inspection Market, by Distribution Channels, 2017-2022 (US$ Mn)

TABLE 272 Asia Pacific Surface Vision and Inspection Market, by Distribution Channels, 2023-2030 (US$ Mn)

TABLE 273 Asia Pacific Surface Vision and Inspection Market, by Integration, 2017-2022 (US$ Mn)

TABLE 274 Asia Pacific Surface Vision and Inspection Market, by Integration, 2023-2030 (US$ Mn)

TABLE 275 China Surface Vision and Inspection Market, by Component, 2017-2022 (US$ Mn)

TABLE 276 China Surface Vision and Inspection Market, by Component, 2023-2030 (US$ Mn)

TABLE 277 China Surface Vision and Inspection Market, by Technology, 2017-2022 (US$ Mn)

TABLE 278 China Surface Vision and Inspection Market, by Technology, 2023-2030 (US$ Mn)

TABLE 279 China Surface Vision and Inspection Market, by Application, 2017-2022 (US$ Mn)

TABLE 280 China Surface Vision and Inspection Market, by Application, 2023-2030 (US$ Mn)

TABLE 281 China Surface Vision and Inspection Market, by Industry Vertical, 2017-2022 (US$ Mn)

TABLE 282 China Surface Vision and Inspection Market, by Industry Vertical, 2023-2030 (US$ Mn)

TABLE 283 China Surface Vision and Inspection Market, by Inspection Type, 2017-2022 (US$ Mn)

TABLE 284 China Surface Vision and Inspection Market, by Inspection Type, 2023-2030 (US$ Mn)

TABLE 285 China Surface Vision and Inspection Market, by Distribution Channels, 2017-2022 (US$ Mn)

TABLE 286 China Surface Vision and Inspection Market, by Distribution Channels, 2023-2030 (US$ Mn)

TABLE 287 China Surface Vision and Inspection Market, by Integration, 2017-2022 (US$ Mn)

TABLE 288 China Surface Vision and Inspection Market, by Integration, 2023-2030 (US$ Mn)

TABLE 289 Japan Surface Vision and Inspection Market, by Component, 2017-2022 (US$ Mn)

TABLE 290 Japan Surface Vision and Inspection Market, by Component, 2023-2030 (US$ Mn)

TABLE 291 Japan Surface Vision and Inspection Market, by Technology, 2017-2022 (US$ Mn)

TABLE 292 Japan Surface Vision and Inspection Market, by Technology, 2023-2030 (US$ Mn)

TABLE 293 Japan Surface Vision and Inspection Market, by Application, 2017-2022 (US$ Mn)

TABLE 294 Japan Surface Vision and Inspection Market, by Application, 2023-2030 (US$ Mn)

TABLE 295 Japan Surface Vision and Inspection Market, by Industry Vertical, 2017-2022 (US$ Mn)

TABLE 296 Japan Surface Vision and Inspection Market, by Industry Vertical, 2023-2030 (US$ Mn)

TABLE 297 Japan Surface Vision and Inspection Market, by Inspection Type, 2017-2022 (US$ Mn)

TABLE 298 Japan Surface Vision and Inspection Market, by Inspection Type, 2023-2030 (US$ Mn)

TABLE 299 Japan Surface Vision and Inspection Market, by Distribution Channels, 2017-2022 (US$ Mn)

TABLE 300 Japan Surface Vision and Inspection Market, by Distribution Channels, 2023-2030 (US$ Mn)

TABLE 301 Japan Surface Vision and Inspection Market, by Integration, 2017-2022 (US$ Mn)

TABLE 302 Japan Surface Vision and Inspection Market, by Integration, 2023-2030 (US$ Mn)

TABLE 303 India Surface Vision and Inspection Market, by Component, 2017-2022 (US$ Mn)

TABLE 304 India Surface Vision and Inspection Market, by Component, 2023-2030 (US$ Mn)

TABLE 305 India Surface Vision and Inspection Market, by Technology, 2017-2022 (US$ Mn)

TABLE 306 India Surface Vision and Inspection Market, by Technology, 2023-2030 (US$ Mn)

TABLE 307 India Surface Vision and Inspection Market, by Application, 2017-2022 (US$ Mn)

TABLE 308 India Surface Vision and Inspection Market, by Application, 2023-2030 (US$ Mn)

TABLE 309 India Surface Vision and Inspection Market, by Industry Vertical, 2017-2022 (US$ Mn)

TABLE 310 India Surface Vision and Inspection Market, by Industry Vertical, 2023-2030 (US$ Mn)

TABLE 311 India Surface Vision and Inspection Market, by Inspection Type, 2017-2022 (US$ Mn)

TABLE 312 India Surface Vision and Inspection Market, by Inspection Type, 2023-2030 (US$ Mn)

TABLE 313 India Surface Vision and Inspection Market, by Distribution Channels, 2017-2022 (US$ Mn)

TABLE 314 India Surface Vision and Inspection Market, by Distribution Channels, 2023-2030 (US$ Mn)

TABLE 315 India Surface Vision and Inspection Market, by Integration, 2017-2022 (US$ Mn)

TABLE 316 India Surface Vision and Inspection Market, by Integration, 2023-2030 (US$ Mn)

TABLE 317 South Korea Surface Vision and Inspection Market, by Component, 2017-2022 (US$ Mn)

TABLE 318 South Korea Surface Vision and Inspection Market, by Component, 2023-2030 (US$ Mn)

TABLE 319 South Korea Surface Vision and Inspection Market, by Technology, 2017-2022 (US$ Mn)

TABLE 320 South Korea Surface Vision and Inspection Market, by Technology, 2023-2030 (US$ Mn)

TABLE 321 South Korea Surface Vision and Inspection Market, by Application, 2017-2022 (US$ Mn)

TABLE 322 South Korea Surface Vision and Inspection Market, by Application, 2023-2030 (US$ Mn)

TABLE 323 South Korea Surface Vision and Inspection Market, by Industry Vertical, 2017-2022 (US$ Mn)

TABLE 324 South Korea Surface Vision and Inspection Market, by Industry Vertical, 2023-2030 (US$ Mn)

TABLE 325 South Korea Surface Vision and Inspection Market, by Inspection Type, 2017-2022 (US$ Mn)

TABLE 326 South Korea Surface Vision and Inspection Market, by Inspection Type, 2023-2030 (US$ Mn)

TABLE 327 South Korea Surface Vision and Inspection Market, by Distribution Channels, 2017-2022 (US$ Mn)

TABLE 328 South Korea Surface Vision and Inspection Market, by Distribution Channels, 2023-2030 (US$ Mn)

TABLE 329 South Korea Surface Vision and Inspection Market, by Integration, 2017-2022 (US$ Mn)

TABLE 330 South Korea Surface Vision and Inspection Market, by Integration, 2023-2030 (US$ Mn)

TABLE 331 South-East Asia Surface Vision and Inspection Market, by Component, 2017-2022 (US$ Mn)

TABLE 332 South-East Asia Surface Vision and Inspection Market, by Component, 2023-2030 (US$ Mn)

TABLE 333 South-East Asia Surface Vision and Inspection Market, by Technology, 2017-2022 (US$ Mn)

TABLE 334 South-East Asia Surface Vision and Inspection Market, by Technology, 2023-2030 (US$ Mn)

TABLE 335 South-East Asia Surface Vision and Inspection Market, by Application, 2017-2022 (US$ Mn)

TABLE 336 South-East Asia Surface Vision and Inspection Market, by Application, 2023-2030 (US$ Mn)

TABLE 337 South-East Asia Surface Vision and Inspection Market, by Industry Vertical, 2017-2022 (US$ Mn)

TABLE 338 South-East Asia Surface Vision and Inspection Market, by Industry Vertical, 2023-2030 (US$ Mn)

TABLE 339 South-East Asia Surface Vision and Inspection Market, by Inspection Type, 2017-2022 (US$ Mn)

TABLE 340 South-East Asia Surface Vision and Inspection Market, by Inspection Type, 2023-2030 (US$ Mn)

TABLE 341 South-East Asia Surface Vision and Inspection Market, by Distribution Channels, 2017-2022 (US$ Mn)

TABLE 342 South-East Asia Surface Vision and Inspection Market, by Distribution Channels, 2023-2030 (US$ Mn)

TABLE 343 South-East Asia Surface Vision and Inspection Market, by Integration, 2017-2022 (US$ Mn)

TABLE 344 South-East Asia Surface Vision and Inspection Market, by Integration, 2023-2030 (US$ Mn)

TABLE 345 Rest of Asia Pacific Surface Vision and Inspection Market, by Component, 2017-2022 (US$ Mn)

TABLE 346 Rest of Asia Pacific Surface Vision and Inspection Market, by Component, 2023-2030 (US$ Mn)

TABLE 347 Rest of Asia Pacific Surface Vision and Inspection Market, by Technology, 2017-2022 (US$ Mn)

TABLE 348 Rest of Asia Pacific Surface Vision and Inspection Market, by Technology, 2023-2030 (US$ Mn)

TABLE 349 Rest of Asia Pacific Surface Vision and Inspection Market, by Application, 2017-2022 (US$ Mn)

TABLE 350 Rest of Asia Pacific Surface Vision and Inspection Market, by Application, 2023-2030 (US$ Mn)

TABLE 351 Rest of Asia Pacific Surface Vision and Inspection Market, by Industry Vertical, 2017-2022 (US$ Mn)

TABLE 352 Rest of Asia Pacific Surface Vision and Inspection Market, by Industry Vertical, 2023-2030 (US$ Mn)

TABLE 353 Rest of Asia Pacific Surface Vision and Inspection Market, by Inspection Type, 2017-2022 (US$ Mn)

TABLE 354 Rest of Asia Pacific Surface Vision and Inspection Market, by Inspection Type, 2023-2030 (US$ Mn)

TABLE 355 Rest of Asia Pacific Surface Vision and Inspection Market, by Distribution Channels, 2017-2022 (US$ Mn)

TABLE 356 Rest of Asia Pacific Surface Vision and Inspection Market, by Distribution Channels, 2023-2030 (US$ Mn)

TABLE 357 Rest of Asia Pacific Surface Vision and Inspection Market, by Integration, 2017-2022 (US$ Mn)

TABLE 358 Rest of Asia Pacific Surface Vision and Inspection Market, by Integration, 2023-2030 (US$ Mn)

TABLE 359 Latin America Surface Vision and Inspection Market, by Component, 2017-2022 (US$ Mn)

TABLE 360 Latin America Surface Vision and Inspection Market, by Component, 2023-2030 (US$ Mn)

TABLE 361 Latin America Surface Vision and Inspection Market, by Technology, 2017-2022 (US$ Mn)

TABLE 362 Latin America Surface Vision and Inspection Market, by Technology, 2023-2030 (US$ Mn)

TABLE 363 Latin America Surface Vision and Inspection Market, by Application, 2017-2022 (US$ Mn)

TABLE 364 Latin America Surface Vision and Inspection Market, by Application, 2023-2030 (US$ Mn)

TABLE 365 Latin America Surface Vision and Inspection Market, by Industry Vertical, 2017-2022 (US$ Mn)

TABLE 366 Latin America Surface Vision and Inspection Market, by Industry Vertical, 2023-2030 (US$ Mn)

TABLE 367 Latin America Surface Vision and Inspection Market, by Inspection Type, 2017-2022 (US$ Mn)

TABLE 368 Latin America Surface Vision and Inspection Market, by Inspection Type, 2023-2030 (US$ Mn)

TABLE 369 Latin America Surface Vision and Inspection Market, by Distribution Channels, 2017-2022 (US$ Mn)

TABLE 370 Latin America Surface Vision and Inspection Market, by Distribution Channels, 2023-2030 (US$ Mn)

TABLE 371 Latin America Surface Vision and Inspection Market, by Integration, 2017-2022 (US$ Mn)

TABLE 372 Latin America Surface Vision and Inspection Market, by Integration, 2023-2030 (US$ Mn)

TABLE 373 Brazil Surface Vision and Inspection Market, by Component, 2017-2022 (US$ Mn)

TABLE 374 Brazil Surface Vision and Inspection Market, by Component, 2023-2030 (US$ Mn)

TABLE 375 Brazil Surface Vision and Inspection Market, by Technology, 2017-2022 (US$ Mn)

TABLE 376 Brazil Surface Vision and Inspection Market, by Technology, 2023-2030 (US$ Mn)

TABLE 377 Brazil Surface Vision and Inspection Market, by Application, 2017-2022 (US$ Mn)

TABLE 378 Brazil Surface Vision and Inspection Market, by Application, 2023-2030 (US$ Mn)

TABLE 379 Brazil Surface Vision and Inspection Market, by Industry Vertical, 2017-2022 (US$ Mn)

TABLE 380 Brazil Surface Vision and Inspection Market, by Industry Vertical, 2023-2030 (US$ Mn)

TABLE 381 Brazil Surface Vision and Inspection Market, by Inspection Type, 2017-2022 (US$ Mn)

TABLE 382 Brazil Surface Vision and Inspection Market, by Inspection Type, 2023-2030 (US$ Mn)

TABLE 383 Brazil Surface Vision and Inspection Market, by Distribution Channels, 2017-2022 (US$ Mn)

TABLE 384 Brazil Surface Vision and Inspection Market, by Distribution Channels, 2023-2030 (US$ Mn)

TABLE 385 Brazil Surface Vision and Inspection Market, by Integration, 2017-2022 (US$ Mn)

TABLE 386 Brazil Surface Vision and Inspection Market, by Integration, 2023-2030 (US$ Mn)

TABLE 387 Argentina Surface Vision and Inspection Market, by Component, 2017-2022 (US$ Mn)

TABLE 388 Argentina Surface Vision and Inspection Market, by Component, 2023-2030 (US$ Mn)

TABLE 389 Argentina Surface Vision and Inspection Market, by Technology, 2017-2022 (US$ Mn)

TABLE 390 Argentina Surface Vision and Inspection Market, by Technology, 2023-2030 (US$ Mn)

TABLE 391 Argentina Surface Vision and Inspection Market, by Application, 2017-2022 (US$ Mn)

TABLE 392 Argentina Surface Vision and Inspection Market, by Application, 2023-2030 (US$ Mn)

TABLE 393 Argentina Surface Vision and Inspection Market, by Industry Vertical, 2017-2022 (US$ Mn)

TABLE 394 Argentina Surface Vision and Inspection Market, by Industry Vertical, 2023-2030 (US$ Mn)

TABLE 395 Argentina Surface Vision and Inspection Market, by Inspection Type, 2017-2022 (US$ Mn)

TABLE 396 Argentina Surface Vision and Inspection Market, by Inspection Type, 2023-2030 (US$ Mn)

TABLE 397 Argentina Surface Vision and Inspection Market, by Distribution Channels, 2017-2022 (US$ Mn)

TABLE 398 Argentina Surface Vision and Inspection Market, by Distribution Channels, 2023-2030 (US$ Mn)

TABLE 399 Argentina Surface Vision and Inspection Market, by Integration, 2017-2022 (US$ Mn)

TABLE 400 Argentina Surface Vision and Inspection Market, by Integration, 2023-2030 (US$ Mn)

TABLE 401 Rest of Latin America Surface Vision and Inspection Market, by Component, 2017-2022 (US$ Mn)

TABLE 402 Rest of Latin America Surface Vision and Inspection Market, by Component, 2023-2030 (US$ Mn)

TABLE 403 Rest of Latin America Surface Vision and Inspection Market, by Technology, 2017-2022 (US$ Mn)

TABLE 404 Rest of Latin America Surface Vision and Inspection Market, by Technology, 2023-2030 (US$ Mn)

TABLE 405 Rest of Latin America Surface Vision and Inspection Market, by Application, 2017-2022 (US$ Mn)

TABLE 406 Rest of Latin America Surface Vision and Inspection Market, by Application, 2023-2030 (US$ Mn)

TABLE 407 Rest of Latin America Surface Vision and Inspection Market, by Industry Vertical, 2017-2022 (US$ Mn)

TABLE 408 Rest of Latin America Surface Vision and Inspection Market, by Industry Vertical, 2023-2030 (US$ Mn)

TABLE 409 Rest of Latin America Surface Vision and Inspection Market, by Inspection Type, 2017-2022 (US$ Mn)

TABLE 410 Rest of Latin America Surface Vision and Inspection Market, by Inspection Type, 2023-2030 (US$ Mn)

TABLE 411 Rest of Latin America Surface Vision and Inspection Market, by Distribution Channels, 2017-2022 (US$ Mn)

TABLE 412 Rest of Latin America Surface Vision and Inspection Market, by Distribution Channels, 2023-2030 (US$ Mn)

TABLE 413 Rest of Latin America Surface Vision and Inspection Market, by Integration, 2017-2022 (US$ Mn)

TABLE 414 Rest of Latin America Surface Vision and Inspection Market, by Integration, 2023-2030 (US$ Mn)

TABLE 415 Middle East Surface Vision and Inspection Market, by Component, 2017-2022 (US$ Mn)

TABLE 416 Middle East Surface Vision and Inspection Market, by Component, 2023-2030 (US$ Mn)

TABLE 417 Middle East Surface Vision and Inspection Market, by Technology, 2017-2022 (US$ Mn)

TABLE 418 Middle East Surface Vision and Inspection Market, by Technology, 2023-2030 (US$ Mn)

TABLE 419 Middle East Surface Vision and Inspection Market, by Application, 2017-2022 (US$ Mn)

TABLE 420 Middle East Surface Vision and Inspection Market, by Application, 2023-2030 (US$ Mn)

TABLE 421 Middle East Surface Vision and Inspection Market, by Industry Vertical, 2017-2022 (US$ Mn)

TABLE 422 Middle East Surface Vision and Inspection Market, by Industry Vertical, 2023-2030 (US$ Mn)

TABLE 423 Middle East Surface Vision and Inspection Market, by Inspection Type, 2017-2022 (US$ Mn)

TABLE 424 Middle East Surface Vision and Inspection Market, by Inspection Type, 2023-2030 (US$ Mn)

TABLE 425 Middle East Surface Vision and Inspection Market, by Distribution Channels, 2017-2022 (US$ Mn)

TABLE 426 Middle East Surface Vision and Inspection Market, by Distribution Channels, 2023-2030 (US$ Mn)

TABLE 427 Middle East Surface Vision and Inspection Market, by Integration, 2017-2022 (US$ Mn)

TABLE 428 Middle East Surface Vision and Inspection Market, by Integration, 2023-2030 (US$ Mn)

TABLE 429 UAE Surface Vision and Inspection Market, by Component, 2017-2022 (US$ Mn)

TABLE 430 UAE Surface Vision and Inspection Market, by Component, 2023-2030 (US$ Mn)

TABLE 431 UAE Surface Vision and Inspection Market, by Technology, 2017-2022 (US$ Mn)

TABLE 432 UAE Surface Vision and Inspection Market, by Technology, 2023-2030 (US$ Mn)

TABLE 433 UAE Surface Vision and Inspection Market, by Application, 2017-2022 (US$ Mn)

TABLE 434 UAE Surface Vision and Inspection Market, by Application, 2023-2030 (US$ Mn)

TABLE 435 UAE Surface Vision and Inspection Market, by Industry Vertical, 2017-2022 (US$ Mn)

TABLE 436 UAE Surface Vision and Inspection Market, by Industry Vertical, 2023-2030 (US$ Mn)

TABLE 437 UAE Surface Vision and Inspection Market, by Inspection Type, 2017-2022 (US$ Mn)

TABLE 438 UAE Surface Vision and Inspection Market, by Inspection Type, 2023-2030 (US$ Mn)

TABLE 439 UAE Surface Vision and Inspection Market, by Distribution Channels, 2017-2022 (US$ Mn)

TABLE 440 UAE Surface Vision and Inspection Market, by Distribution Channels, 2023-2030 (US$ Mn)

TABLE 441 UAE Surface Vision and Inspection Market, by Integration, 2017-2022 (US$ Mn)

TABLE 442 UAE Surface Vision and Inspection Market, by Integration, 2023-2030 (US$ Mn)

TABLE 443 Saudi Arabia Surface Vision and Inspection Market, by Component, 2017-2022 (US$ Mn)

TABLE 444 Saudi Arabia Surface Vision and Inspection Market, by Component, 2023-2030 (US$ Mn)

TABLE 445 Saudi Arabia Surface Vision and Inspection Market, by Technology, 2017-2022 (US$ Mn)

TABLE 446 Saudi Arabia Surface Vision and Inspection Market, by Technology, 2023-2030 (US$ Mn)

TABLE 447 Saudi Arabia Surface Vision and Inspection Market, by Application, 2017-2022 (US$ Mn)

TABLE 448 Saudi Arabia Surface Vision and Inspection Market, by Application, 2023-2030 (US$ Mn)

TABLE 449 Saudi Arabia Surface Vision and Inspection Market, by Industry Vertical, 2017-2022 (US$ Mn)

TABLE 450 Saudi Arabia Surface Vision and Inspection Market, by Industry Vertical, 2023-2030 (US$ Mn)

TABLE 451 Saudi Arabia Surface Vision and Inspection Market, by Inspection Type, 2017-2022 (US$ Mn)

TABLE 452 Saudi Arabia Surface Vision and Inspection Market, by Inspection Type, 2023-2030 (US$ Mn)

TABLE 453 Saudi Arabia Surface Vision and Inspection Market, by Distribution Channels, 2017-2022 (US$ Mn)

TABLE 454 Saudi Arabia Surface Vision and Inspection Market, by Distribution Channels, 2023-2030 (US$ Mn)

TABLE 455 Saudi Arabia Surface Vision and Inspection Market, by Integration, 2017-2022 (US$ Mn)

TABLE 456 Saudi Arabia Surface Vision and Inspection Market, by Integration, 2023-2030 (US$ Mn)

TABLE 457 Rest of Middle East Surface Vision and Inspection Market, by Component, 2017-2022 (US$ Mn)

TABLE 458 Rest of Middle East Surface Vision and Inspection Market, by Component, 2023-2030 (US$ Mn)

TABLE 459 Rest of Middle East Surface Vision and Inspection Market, by Technology, 2017-2022 (US$ Mn)

TABLE 460 Rest of Middle East Surface Vision and Inspection Market, by Technology, 2023-2030 (US$ Mn)

TABLE 461 Rest of Middle East Surface Vision and Inspection Market, by Application, 2017-2022 (US$ Mn)

TABLE 462 Rest of Middle East Surface Vision and Inspection Market, by Application, 2023-2030 (US$ Mn)

TABLE 463 Rest of Middle East Surface Vision and Inspection Market, by Industry Vertical, 2017-2022 (US$ Mn)

TABLE 464 Rest of Middle East Surface Vision and Inspection Market, by Industry Vertical, 2023-2030 (US$ Mn)

TABLE 465 Rest of Middle East Surface Vision and Inspection Market, by Inspection Type, 2017-2022 (US$ Mn)

TABLE 466 Rest of Middle East Surface Vision and Inspection Market, by Inspection Type, 2023-2030 (US$ Mn)

TABLE 467 Rest of Middle East Surface Vision and Inspection Market, by Distribution Channels, 2017-2022 (US$ Mn)

TABLE 468 Rest of Middle East Surface Vision and Inspection Market, by Distribution Channels, 2023-2030 (US$ Mn)

TABLE 469 Rest of Middle East Surface Vision and Inspection Market, by Integration, 2017-2022 (US$ Mn)

TABLE 470 Rest of Middle East Surface Vision and Inspection Market, by Integration, 2023-2030 (US$ Mn)

TABLE 471 Africa Surface Vision and Inspection Market, by Component, 2017-2022 (US$ Mn)

TABLE 472 Africa Surface Vision and Inspection Market, by Component, 2023-2030 (US$ Mn)

TABLE 473 Africa Surface Vision and Inspection Market, by Technology, 2017-2022 (US$ Mn)

TABLE 474 Africa Surface Vision and Inspection Market, by Technology, 2023-2030 (US$ Mn)

TABLE 475 Africa Surface Vision and Inspection Market, by Application, 2017-2022 (US$ Mn)

TABLE 476 Africa Surface Vision and Inspection Market, by Application, 2023-2030 (US$ Mn)

TABLE 477 Africa Surface Vision and Inspection Market, by Industry Vertical, 2017-2022 (US$ Mn)

TABLE 478 Africa Surface Vision and Inspection Market, by Industry Vertical, 2023-2030 (US$ Mn)

TABLE 479 Africa Surface Vision and Inspection Market, by Inspection Type, 2017-2022 (US$ Mn)

TABLE 480 Africa Surface Vision and Inspection Market, by Inspection Type, 2023-2030 (US$ Mn)

TABLE 481 Africa Surface Vision and Inspection Market, by Distribution Channels, 2017-2022 (US$ Mn)

TABLE 482 Africa Surface Vision and Inspection Market, by Distribution Channels, 2023-2030 (US$ Mn)

TABLE 483 Africa Surface Vision and Inspection Market, by Integration, 2017-2022 (US$ Mn)

TABLE 484 Africa Surface Vision and Inspection Market, by Integration, 2023-2030 (US$ Mn)

TABLE 485 South Africa Surface Vision and Inspection Market, by Component, 2017-2022 (US$ Mn)

TABLE 486 South Africa Surface Vision and Inspection Market, by Component, 2023-2030 (US$ Mn)

TABLE 487 South Africa Surface Vision and Inspection Market, by Technology, 2017-2022 (US$ Mn)

TABLE 488 South Africa Surface Vision and Inspection Market, by Technology, 2023-2030 (US$ Mn)

TABLE 489 South Africa Surface Vision and Inspection Market, by Application, 2017-2022 (US$ Mn)

TABLE 490 South Africa Surface Vision and Inspection Market, by Application, 2023-2030 (US$ Mn)

TABLE 491 South Africa Surface Vision and Inspection Market, by Industry Vertical, 2017-2022 (US$ Mn)

TABLE 492 South Africa Surface Vision and Inspection Market, by Industry Vertical, 2023-2030 (US$ Mn)

TABLE 493 South Africa Surface Vision and Inspection Market, by Inspection Type, 2017-2022 (US$ Mn)

TABLE 494 South Africa Surface Vision and Inspection Market, by Inspection Type, 2023-2030 (US$ Mn)

TABLE 495 South Africa Surface Vision and Inspection Market, by Distribution Channels, 2017-2022 (US$ Mn)

TABLE 496 South Africa Surface Vision and Inspection Market, by Distribution Channels, 2023-2030 (US$ Mn)

TABLE 497 South Africa Surface Vision and Inspection Market, by Integration, 2017-2022 (US$ Mn)

TABLE 498 South Africa Surface Vision and Inspection Market, by Integration, 2023-2030 (US$ Mn)

TABLE 499 Egypt Surface Vision and Inspection Market, by Component, 2017-2022 (US$ Mn)

TABLE 500 Egypt Surface Vision and Inspection Market, by Component, 2023-2030 (US$ Mn)

TABLE 501 Egypt Surface Vision and Inspection Market, by Technology, 2017-2022 (US$ Mn)

TABLE 502 Egypt Surface Vision and Inspection Market, by Technology, 2023-2030 (US$ Mn)

TABLE 503 Egypt Surface Vision and Inspection Market, by Application, 2017-2022 (US$ Mn)

TABLE 504 Egypt Surface Vision and Inspection Market, by Application, 2023-2030 (US$ Mn)

TABLE 505 Egypt Surface Vision and Inspection Market, by Industry Vertical, 2017-2022 (US$ Mn)

TABLE 506 Egypt Surface Vision and Inspection Market, by Industry Vertical, 2023-2030 (US$ Mn)

TABLE 507 Egypt Surface Vision and Inspection Market, by Inspection Type, 2017-2022 (US$ Mn)

TABLE 508 Egypt Surface Vision and Inspection Market, by Inspection Type, 2023-2030 (US$ Mn)

TABLE 509 Egypt Surface Vision and Inspection Market, by Distribution Channels, 2017-2022 (US$ Mn)

TABLE 510 Egypt Surface Vision and Inspection Market, by Distribution Channels, 2023-2030 (US$ Mn)

TABLE 511 Egypt Surface Vision and Inspection Market, by Integration, 2017-2022 (US$ Mn)

TABLE 512 Egypt Surface Vision and Inspection Market, by Integration, 2023-2030 (US$ Mn)

TABLE 513 Rest of Africa Surface Vision and Inspection Market, by Component, 2017-2022 (US$ Mn)

TABLE 514 Rest of Africa Surface Vision and Inspection Market, by Component, 2023-2030 (US$ Mn)

TABLE 515 Rest of Africa Surface Vision and Inspection Market, by Technology, 2017-2022 (US$ Mn)

TABLE 516 Rest of Africa Surface Vision and Inspection Market, by Technology, 2023-2030 (US$ Mn)

TABLE 517 Rest of Africa Surface Vision and Inspection Market, by Application, 2017-2022 (US$ Mn)

TABLE 518 Rest of Africa Surface Vision and Inspection Market, by Application, 2023-2030 (US$ Mn)

TABLE 519 Rest of Africa Surface Vision and Inspection Market, by Industry Vertical, 2017-2022 (US$ Mn)

TABLE 520 Rest of Africa Surface Vision and Inspection Market, by Industry Vertical, 2023-2030 (US$ Mn)

TABLE 521 Rest of Africa Surface Vision and Inspection Market, by Inspection Type, 2017-2022 (US$ Mn)

TABLE 522 Rest of Africa Surface Vision and Inspection Market, by Inspection Type, 2023-2030 (US$ Mn)

TABLE 523 Rest of Africa Surface Vision and Inspection Market, by Distribution Channels, 2017-2022 (US$ Mn)

TABLE 524 Rest of Africa Surface Vision and Inspection Market, by Distribution Channels, 2023-2030 (US$ Mn)

TABLE 525 Rest of Africa Surface Vision and Inspection Market, by Integration, 2017-2022 (US$ Mn)

TABLE 526 Rest of Africa Surface Vision and Inspection Market, by Integration, 2023-2030 (US$ Mn)

Frequently asked questions

How big is the global market for surface vision and inspection right now?

In 2022, the surface vision and inspection market was estimated to be worth USD 2215.9 million.

What is the surface vision and inspection market’s anticipated growth rate from 2023 to 2030?

The surface vision and inspection market is anticipated to increase at a CAGR of 7.50% from 2023 to 2030, reaching USD 3952 Million in 2030.

Which segment is leading the market in terms of components?

Software is the leading segment by component.

Which segment is leading the market in terms of technology?

Machine vision systems are the leading segment by technology.

Which application segment is anticipated to have the highest CAGR throughout the forecast period?

During the forecast period, the quality control and inspection segment is expected to register the highest CAGR.

In which region is the market for surface vision and inspection expanding?

North America dominated the surface vision and inspection market with a 41.3% market share as of 2022.

Who are the key participants in the market for surface vision and inspection globally?

The top players include Adept Technology, Inc., Cognex Corporation, Baumer Inspection, Edmund Optics Inc., ISRA Vision AG, ETS SuperVision BV, Matrox Imaging, Industrial Vision Systems Ltd., Microscan Systems, Inc., Panasonic Corporation, Omron Corporation, Teledyne DALSA Inc., Perceptron Inc., Vitronic GmbH, and others.

What are the main market factors driving the surface vision and inspection sector?

The significant factors driving the growth of the surface vision and inspection market include rising demands for quality assurance, healthcare spending, industry regulations, manufacturing automation, and growing technological advancements.

What main market challenges prevent the surface vision and inspection sector from growing?

The challenges limiting the surface vision and inspection market growth are high initial costs, integration difficulties, the need for a skilled workforce, a lack of flexibility, and data management and analysis.

What are the main market opportunities for the surface vision and inspection sector?

The surface vision and inspection market has a lot of opportunities for growth due to enhanced software capabilities, international expansion, industry 4.0 integration, remote monitoring and diagnostics, and miniaturization and microelectronics.

Supervisory Control and Data Acquisition (SCADA) Market

Published:
Report ID: 10131

India CCTV Camera Market

Published:
Report ID: 37170

Asia Pacific Microprocessor and GPU Market

Published:
Report ID: 37122

EDiscovery Market

Published:
Report ID: 4744

Simulation Software Market

Published:
Report ID: 36908

Bioinformatics Market

Published:
Report ID: 14530

Fish Hook Sensor Market

Published:
Report ID: 36774

Big Data Services Market

Published:
Report ID: 3020

Enterprise Asset Management Market

Published:
Report ID: 5338

South Korea Wifi Chipset Market

Published:
Report ID: 36535

Saudi Arabia Managed Security Services Market

Published:
Report ID: 36393

Purchase Options

$2999
Delivery Format: Excel.
$4999
Designed for the individual purchaser.
$6999
Users located at a single corporate site or regional office.
$7999
Allowed for unlimited sharing globally within one company.
Smallform of Sample request

Have a question?

User Profile

Don’t settle for less – trust Mitul to help you find the best solution.

Report delivery within 24 to 48 hours

– Other Info –

What people say?-

User Review

I am very impressed with the information in this report. The author clearly did their research when they came up with this product and it has already given me a lot of ideas.

Jana Schmidt
CEDAR CX Technologies

– Connect with us –

Phone

+91 6232 49 3207


support

24/7 Research Support


sales@credenceresearch.com

– Research Methodology –

Going beyond the basics: advanced techniques in research methodology

– Trusted By –

Pepshi, LG, Nestle
Motorola, Honeywell, Johnson and johnson
LG Chem, SIEMENS, Pfizer
Unilever, Samsonite, QIAGEN