
Market Overview:
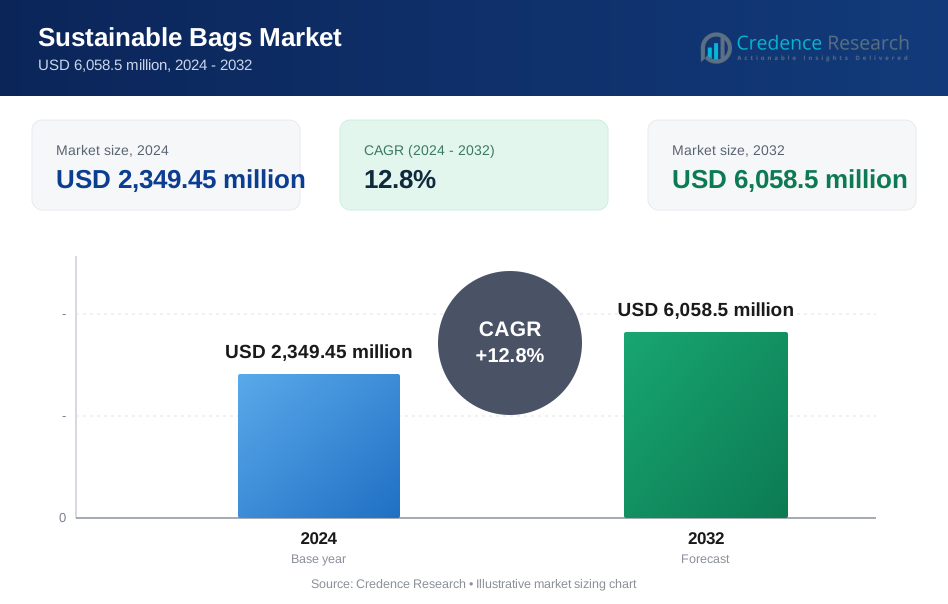
The global sustainable bags market was valued at USD 2,349.45 million in 2024 and is projected to reach USD 6,058.5 million by 2032, expanding at a CAGR of 12.8% during 2025–2032.
| REPORT ATTRIBUTE | DETAILS |
|---|---|
| Historical Period | 2020-2023 |
| Base Year | 2024 |
| Forecast Period | 2025-2032 |
| Sustainable Bags Market Size 2024 | USD 2,349.45 million |
| Sustainable Bags Market, CAGR | 12.8% |
| Sustainable Bags Market Size 2032 | USD 6,058.5 million |
The global sustainable bags market is led by major players such as Biopac India Corporation Ltd, Smurfit Kappa Group, Mondi Group, BASF SE, WestRock Company, Georgia-Pacific, Metabolix Inc, Cereplast Inc, Novolex, and Abbey Polythene Ltd. These companies dominate through strong product portfolios, advanced biodegradable materials, and strategic retail partnerships. Europe emerged as the leading region with a 35% market share in 2024, driven by stringent environmental policies and high consumer awareness. North America followed with 28%, supported by robust retail infrastructure and corporate sustainability initiatives, while Asia-Pacific showed strong growth momentum due to rising bans on plastic and expanding biopolymer production capacity.
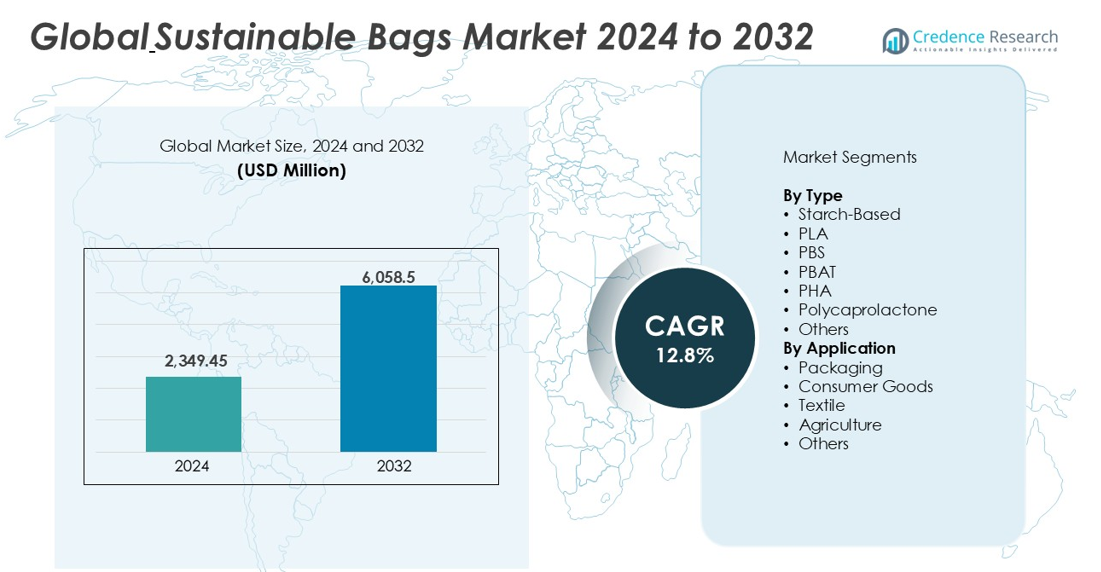
Market Insights
- The global sustainable bags market was valued at USD 2,349.45 million in 2024 and is projected to reach USD 6,058.5 million by 2032, growing at a CAGR of 12.8%.
- Increasing government bans on single-use plastics and rising consumer awareness about eco-friendly packaging are key drivers fueling market expansion.
- Biopolymer innovation, such as starch-based and PLA bags, is shaping major market trends, supported by brand-led sustainability campaigns.
- Leading players like Smurfit Kappa Group, BASF SE, Mondi Group, and Novolex dominate through technological advancements and strong retail partnerships.
- Europe holds 35% of the market, followed by North America with 28%, while Asia-Pacific grows fastest, driven by expanding packaging and retail sectors; the packaging segment accounts for 44% of total applications.
Market Segmentation Analysis:
By Type
Starch-based bags dominated the global sustainable bags market in 2024, accounting for over 32% of total revenue. Their dominance stems from strong biodegradability, low production cost, and compliance with plastic bans in Europe and Asia-Pacific. Starch-based polymers made from corn or potato starch are gaining traction due to reduced carbon emissions and easy compostability. Meanwhile, PLA and PBAT bags are witnessing rising demand in retail packaging for durability and moisture resistance. Companies are investing in PHA and polycaprolactone blends to improve flexibility and extend shelf life for premium applications.
- For instance, Novamont’s Mater-Bi production facility in Italy manufactures over 150,000 tons of starch-based biopolymers annually for eco-friendly packaging, while BASF’s ecovio® line combines PBAT and PLA to produce more than 70,000 tons of certified compostable films each year.
By Application
The packaging segment held the largest market share of around 44% in 2024, driven by widespread adoption in retail, e-commerce, and food delivery. Businesses increasingly use sustainable bags for branding and compliance with eco-labeling standards. Consumer goods and textile sectors follow, supported by the shift toward reusable and recyclable materials. Agriculture applications, including biodegradable mulch and seed bags, are growing steadily with the expansion of organic farming. The demand across diverse industries continues to rise as sustainability becomes a key purchasing factor.
- For instance, Smurfit Kappa is a leading manufacturer of sustainable e-commerce packaging, focusing on solutions that are renewable, recyclable, and biodegradable. Separately, the Mondi Group uses recycled Tesco warehouse waste to create EcoVantage paper for the retailer's shopping bags in Central Europe.
Key Growth Drivers
Rising Environmental Awareness and Plastic Bans
Growing consumer awareness of environmental pollution and the harmful impact of single-use plastics is a major driver of the sustainable bags market. Governments worldwide are enforcing strict regulations, including plastic bag bans and extended producer responsibility (EPR) programs, pushing retailers and manufacturers toward biodegradable and reusable alternatives. For instance, the European Union’s Single-Use Plastics Directive and India’s nationwide ban on plastic carry bags have accelerated demand for compostable options. Brands are increasingly shifting to paper, jute, cotton, and biopolymer-based bags to align with sustainability goals and eco-label standards. This growing emphasis on eco-conscious consumption continues to reshape the global packaging landscape.
- For instance, the European Union's Single-Use Plastics Directive has encouraged the bioplastics market, and manufacturers like BASF have adapted their product strategies. In India, a nationwide ban on specific single-use plastics has prompted companies like TGP Bioplastics to increase production of biodegradable alternatives.
Expanding Retail and E-commerce Sectors
The booming retail and e-commerce sectors are fueling rapid adoption of sustainable packaging materials. Online retailers are using biodegradable and reusable bags to enhance brand reputation and comply with environmental norms. Companies such as Amazon and Walmart are introducing recycled paper and fabric-based bags for deliveries and in-store packaging. This shift aligns with consumer preferences for green packaging and supports brand differentiation in competitive markets. Additionally, global e-commerce growth, particularly in Asia-Pacific, is increasing packaging waste concerns, driving sustainable innovations. Retailers are also integrating smart labeling and recyclable materials to reduce carbon footprints and improve circularity in supply chains.
- For instance, Amazon shipped over 1 billion recyclable paper mailers in 2024, eliminating plastic packaging in several key markets, while Walmart’s “Beyond the Bag” initiative replaced more than 10 million plastic bags monthly with reusable fabric alternatives across North America.
Innovation in Biopolymer and Eco-material Technologies
Advancements in biopolymer production and material innovation are boosting the sustainable bags industry. New biodegradable materials like PHA, PBS, and PBAT offer enhanced strength, flexibility, and faster compostability compared to traditional plastics. Manufacturers are adopting hybrid blends of natural starch and synthetic polymers to balance durability with eco-performance. For example, companies like BASF and NatureWorks are investing in high-performance biodegradable resins for packaging and consumer goods applications. These technological improvements reduce production costs and improve scalability, making sustainable bags more accessible to global brands. Continuous R&D investment ensures better end-of-life management and supports the shift toward circular economy models.
Key Trends & Opportunities
Circular Economy and Recycling Initiatives
The shift toward circular economy practices presents significant growth opportunities for sustainable bag manufacturers. Governments and corporations are focusing on recycling infrastructure and closed-loop systems to minimize waste. Leading retailers are introducing “return and reuse” programs to encourage circular consumption. For instance, IKEA and H&M have launched initiatives promoting reusable and recycled material-based shopping bags. The demand for post-consumer recycled (PCR) materials in bag manufacturing is also rising, reducing dependency on virgin resources. As sustainability reporting becomes a global standard, companies adopting circular design gain competitive advantages, driving long-term market growth.
- For instance, H&M collected over 17,000 tonnes of textiles in 2024 for reuse and recycling. The company's Garment Collecting program has repurposed over 172,000 tonnes of clothing and textiles since 2013.
Branding and Green Marketing Strategies
Eco-friendly packaging has evolved into a strategic marketing tool for brands. Consumers increasingly associate sustainable materials with quality and ethical responsibility. Major retailers are capitalizing on this trend by promoting reusable bags as part of their brand identity. For instance, fashion and grocery brands are launching limited-edition jute and cotton bags to attract environmentally conscious shoppers. This trend creates new opportunities for product customization, logo printing, and premium eco-designs. Sustainable bags now serve both functional and promotional roles, helping brands enhance visibility while reducing environmental impact.
Key Challenges
High Production Costs and Limited Material Availability
Despite strong demand, the high production cost of bioplastics and natural fibers limits mass adoption. Biodegradable polymers such as PLA and PHA are more expensive than traditional polyethylene due to complex processing and feedstock costs. Moreover, limited supply of raw materials like jute, hemp, and starch-based resins causes price volatility. Small manufacturers struggle to compete with low-cost plastic alternatives. Infrastructure gaps in composting and recycling facilities also restrict scalability. Overcoming these challenges requires policy incentives, technology investments, and partnerships to optimize production efficiency and ensure cost parity with conventional plastics.
Lack of Standardization and Mislabeling Issues
The absence of universal standards for biodegradability and recyclability poses a serious challenge in the sustainable bags market. Many products labeled as “eco-friendly” fail to meet compostability or lifecycle criteria, leading to greenwashing concerns. This inconsistency confuses consumers and undermines trust in sustainable products. Regional differences in certification systems such as ASTM D6400, EN 13432, and ISO 17088 further complicate trade and compliance. The lack of regulatory clarity also affects manufacturers’ investment confidence. Establishing global certification frameworks and stronger enforcement mechanisms will be crucial to maintaining product integrity and market credibility.
Regional Analysis
North America
North America held a market share of around 28% in 2024, driven by strong environmental regulations and consumer demand for eco-friendly packaging. The U.S. and Canada are leading adopters, supported by plastic bags and corporate sustainability programs. Retailers such as Walmart and Target promote reusable and compostable bags, accelerating market growth. The presence of key biopolymer producers and recyclers further strengthens the regional ecosystem. Increasing partnerships between packaging manufacturers and retail chains are enhancing product visibility and adoption, positioning North America as a major innovator in sustainable packaging practices.
Europe
Europe dominated the global sustainable bags market in 2024 with a market share of approximately 35%. The region’s leadership stems from strict EU policies such as the Single-Use Plastics Directive and Green Deal initiatives. Countries like Germany, France, and the U.K. are at the forefront of adopting biodegradable and compostable bags. Rising consumer awareness, combined with advanced recycling infrastructure, supports consistent growth. European manufacturers are investing in PHA and paper-based alternatives to meet circular economy goals. Government incentives and corporate commitments to zero-waste strategies continue to reinforce the region’s dominance.
Asia-Pacific
Asia-Pacific accounted for about 27% of the global market share in 2024, supported by rapid urbanization and growing environmental initiatives. China, India, and Japan are major contributors, implementing strict policies to curb plastic waste. The region’s vast retail and e-commerce industries are fueling high demand for reusable and biodegradable bags. Expanding biopolymer production facilities and government-led clean environment campaigns are further boosting adoption. Local manufacturers are scaling up starch-based and PLA-based bag production to meet domestic and export demand, making Asia-Pacific one of the fastest-growing regional markets.
Latin America
Latin America captured nearly 6% of the global sustainable bags market in 2024, driven by increasing awareness of plastic pollution and supportive policy measures. Brazil, Chile, and Mexico are leading the transition with municipal bans on single-use plastics. The region’s retail and food service industries are gradually adopting eco-friendly packaging materials. However, limited manufacturing capacity and high costs restrain faster growth. International collaborations and technology transfers are helping local producers expand bioplastic applications. Continued policy enforcement and foreign investment are expected to accelerate regional development in sustainable packaging solutions.
Middle East & Africa
The Middle East & Africa region held a market share of around 4% in 2024, showing gradual adoption of eco-friendly packaging solutions. Rising urban populations and growing retail sectors in the UAE, South Africa, and Saudi Arabia are encouraging demand for biodegradable bags. Governments are introducing plastic reduction programs and sustainability campaigns to address waste management challenges. Despite limited infrastructure for large-scale biopolymer production, international investments and regional recycling initiatives are improving accessibility. Increasing awareness and supportive legislation are likely to drive steady market growth over the coming years.
Market Segmentations:
By Type
- Starch-Based
- PLA
- PBS
- PBAT
- PHA
- Polycaprolactone
- Others
By Application
- Packaging
- Consumer Goods
- Textile
- Agriculture
- Others
By Geography
- North America
- U.S.
- Canada
- Europe
- Germany
- France
- U.K.
- Italy
- Spain
- Rest of Europe
- Asia Pacific
- China
- Japan
- India
- South Korea
- South-east Asia
- Rest of Asia Pacific
- Latin America
- Brazil
- Mexico
- Rest of Latin America
- Middle East & Africa
- GCC Countries
- South Africa
- Rest of the Middle East and Africa
Competitive Landscape
The global sustainable bags market is highly competitive, featuring a mix of international and regional players focusing on innovation, materials development, and sustainability compliance. Key participants include Biopac India Corporation Ltd, Smurfit Kappa Group, Mondi Group, BASF SE, WestRock Company, Georgia-Pacific, Metabolix Inc, Cereplast Inc, Novolex, and Abbey Polythene Ltd. These companies emphasize biodegradable polymers, recycled fibers, and circular design solutions to gain a competitive edge. Strategic collaborations, mergers, and product diversification are common to enhance market presence and reduce environmental impact. For instance, BASF and Mondi are investing in advanced biopolymer technologies, while Smurfit Kappa and WestRock focus on sustainable paper-based packaging. Regional players like Biopac India are strengthening their foothold in emerging economies through low-cost, compostable products and strong retail partnerships.
Key Player Analysis
- Biopac India Corporation Ltd
- Smurfit Kappa Group
- Mondi Group
- BASF SE
- WestRock Company
- Georgia-Pacific
- Metabolix Inc
- Cereplast Inc
- Novolex
- Abbey Polythene Ltd
Recent Developments
- In August 2023, Leading packaging manufacturer Sonoco Products Company has declared the launch of new sustainable packaging solutions with two EnviroFlex Paper Pre-qualifications, especially for the How2Recycle® Labeling range.
- In December 2022, BASF & StePac collaborated and launched a sustainable packaging solution for shelf-life extension of fresh produce. The partnership will help maintain a balance between generating plastic packaging that is as eco-friendly as possible and keeping fresh produce longer.
- In October 2022, Berry Global announced the new product offering with its bespoke 14-litre HDPE reusable container, an ideal refill solution. With the launch, the company plays a central role in a new refill packaging solution from the Refill Coalition.
- In June 2022, Ball Corporation declared the launch of its most sustainable aluminium aerosol can with only half the carbon footprint of a standard can. The launch will support the company’s ambition to achieve 2030 science-based targets & net-zero emissions before 2050.
- In April 2022, Amcor introduced innovative and sustainable packaging solutions, especially for the pharmaceutical industry. The new low-carbon, recycle-ready and High Shield laminates boost the product range in the company’s pharmaceutical packaging portfolio.
Report Coverage
The research report offers an in-depth analysis based on Type, Application and Geography. It details leading market players, providing an overview of their business, product offerings, investments, revenue streams, and key applications. Additionally, the report includes insights into the competitive environment, SWOT analysis, current market trends, as well as the primary drivers and constraints. Furthermore, it discusses various factors that have driven market expansion in recent years. The report also explores market dynamics, regulatory scenarios, and technological advancements that are shaping the industry. It assesses the impact of external factors and global economic changes on market growth. Lastly, it provides strategic recommendations for new entrants and established companies to navigate the complexities of the market.
Future Outlook
- The market will grow rapidly due to rising bans on single-use plastics.
- Biopolymer innovations will enhance bag durability and compostability.
- Retail and e-commerce sectors will continue driving large-scale adoption.
- Consumer demand for reusable and recyclable products will keep increasing.
- Manufacturers will invest more in PHA, PBS, and PBAT-based materials.
- Branding and eco-friendly packaging will become major marketing tools.
- Asia-Pacific will emerge as the fastest-growing regional market.
- Partnerships between retailers and green material producers will strengthen supply chains.
- Governments will tighten sustainability regulations across packaging industries.
- Advances in recycling and circular economy models will support long-term growth.
Request a Free Sample
Fill in your details and we'll send you a free sample report.
- Sample data tables & charts
- Research methodology
Need a Custom Version of This Report?
Tailor the scope, geography, or segments to your exact requirements.
- Custom geography or segment scope
- Direct access to our analyst team
Frequently Asked Questions
What is the current market size for the Global Sustainable Bags Market, and what is its projected size in 2032?
At what Compound Annual Growth Rate is the Global Sustainable Bags Market projected to grow between 2025 and 2032?
Which is the leading region of the market for sustainable bags?
What are the key drivers for the growth of the sustainable bags market?
Which is the major segment in the sustainable bags market by type?
Which is the major segment in the sustainable bags market by application?
Table of Content
Chapter 1. Report Introduction
- 1.1 Report Description & Purpose
- 1.1.1 Report Title & Market Definition
- 1.1.2 Unique Selling Propositions (USP) & Key Differentiators
- 1.1.3 Value Proposition for Stakeholders
- 1.2 Research Objectives
- 1.2.1 Market Sizing Objectives (Volume & Revenue) (Volume Where Applicable)
- 1.2.2 Segmentation Objectives
- 1.2.3 Competitive Intelligence Objectives
- 1.2.4 Forecast & Scenario Objectives
- 1.3 Report Scope
- 1.3.1 Sustainable Bags Scope – Segments & Subsegments Covered
- 1.3.2 Geographic Scope – Regions & Countries Covered
- 1.3.3 Historical Period, Base Year & Forecast Period (2024; forecast to 2032)
- 1.3.4 Inclusions & Exclusions
- 1.4 Industry Classification & Applicable Codes
- 1.5 Currency, Measurement Units & Valuation Basis
- 1.6 Target Stakeholders
- 1.7 Limitations & Assumptions
Chapter 2. Executive Summary
- 2.1 Global Sustainable Bags Market Snapshot
- 2.1.1 Market Size – Historical (2024) & Forecast (2024-2032) (2024: USD 2,349.45 million → 2032: USD 6,058.5 million)
- 2.1.2 Volume & Revenue – Global Totals (Volume Where Applicable)
- 2.1.3 Key Market Highlights – Top Five Facts
- 2.2 Sustainable Bags Market Segmentation Snapshot
- 2.2.1 Market Split by Region – 2024 vs. 2032
- 2.3 Competitive Snapshot
- 2.3.1 Top 10 Players by Revenue Share – 2024
- 2.3.2 Top 10 Players by Volume Share – 2024 (Volume Where Applicable)
- 2.3.3 Recent Strategic Developments (18-Month Summary)
- 2.4 Key Investment Highlights & Strategic Conclusions
Chapter 3. Sustainable Bags Market Dynamics & Industry Analysis
- 3.1 Market Overview & Context
- 3.1.1 Sustainable Bags Market Position in the Broader Industry Value Chain
- 3.1.2 Demand Structure & Purchasing Dynamics
- 3.1.3 Market Maturity & Development Stage by Region
- 3.2 Sustainable Bags Market Drivers
- 3.3 Sustainable Bags Market Restraints & Challenges
- 3.4 Sustainable Bags Market Opportunities
- 3.5 Porter's Five Forces Analysis
- 3.5.1 Threat of New Entrants
- 3.5.2 Bargaining Power of Suppliers
- 3.5.3 Bargaining Power of Buyers
- 3.5.4 Threat of Substitutes
- 3.5.5 Competitive Rivalry – Intensity Assessment
- 3.6 Sustainable Bags Value Chain Analysis
- 3.6.1 Upstream – Key Inputs, Resources & Suppliers
- 3.6.1.1 Key Input/Resource 1
- 3.6.1.2 Key Input/Resource 2
- 3.6.1.3 Key Input/Resource 3
- 3.6.2 Midstream – Core Operations & Value Creation
- 3.6.2.1 Operating Model & Process Overview
- 3.6.2.2 Key Operating Locations & Capabilities by Company
- 3.6.3 Downstream – Market Channels & End Users
- 3.6.3.1 Direct Sales & Customer Engagement Channels
- 3.6.3.2 Indirect Sales, Intermediaries & Partner Channels
- 3.6.4 Value Chain Profitability Analysis
- 3.6.1 Upstream – Key Inputs, Resources & Suppliers
- 3.7 PESTEL Analysis
- 3.7.1 Political Factors
- 3.7.2 Economic Factors
- 3.7.3 Social Factors
- 3.7.4 Technological Factors
- 3.7.5 Environmental Factors
- 3.7.6 Legal Factors
- 3.8 Sustainable Bags Supply Chain Analysis
- 3.8.1 Critical Input & Resource Availability Risk Assessment
- 3.8.2 Supplier & Operational Concentration Risk (Geographic Exposure)
- 3.8.3 Supply & Service Disruption Impact Analysis
- 3.9 Regulatory & Policy Landscape
Note: The regulatory and policy landscape section covers regulations based on their applicability to the market, Sustainable Bags category, geography, and scope of the study. Only regulatory frameworks with a material impact on operations, compliance, trade, sustainability, or market access are analyzed in detail.
Chapter 4. Key Investment Pockets & Opportunity Analysis
- 4.1 Sustainable Bags Market Attractiveness Analysis
- 4.1.1 By Region – Investment Attractiveness Matrix (Market Size × CAGR)
- 4.2 Absolute Revenue Growth Opportunity
- 4.2.1 By Region – Absolute Revenue Growth Through 2032
- 4.3 Incremental Demand Opportunity
- 4.3.1 By Region – Incremental Demand Through 2032
- 4.3.2 Segment – Incremental Demand
- 4.4 Emerging Submarket Opportunity Deep Dive (Subject to Applicability)
- 4.5 Priority Market Opportunity Scorecards
- 4.5.1 United States
- 4.5.2 Europe
- 4.5.3 Asia
- 4.5.4 Middle East & Africa
Note: Priority market opportunity scorecards reflect the geographic scope and strategic relevance of the study. Listed markets are indicative and may be adapted to the industry.
Chapter 5. Sustainable Bags Cross-Border Trade & Market Access Analysis
- 5.1 International Trade & Cross-Border Activity Overview
- 5.1.1 Global Export Value by Country (2024)
- 5.1.2 Global Export Volume by Country (2024) (Volume Where Applicable)
- 5.1.3 Global Import Value by Country (2024)
- 5.1.4 Global Import Volume by Country (2024) (Volume Where Applicable)
- 5.1.5 Net Trade Balance by Country (2024)
- 5.2 Export Analysis – Segment
- 5.2.1 Category 1 (Applicable Classification Code)
- 5.2.2 Category 2 (Applicable Classification Code)
- 5.2.3 Category 3 (Applicable Classification Code)
- 5.2.4 Category 4 (Applicable Classification Code)
- 5.2.5 Category 5 (Applicable Classification Code)
- 5.3 Import Analysis – Segment
- 5.3.1 Category 1 (Applicable Classification Code)
- 5.3.2 Category 2 (Applicable Classification Code)
- 5.3.3 Category 3 (Applicable Classification Code)
- 5.3.4 Category 4 (Applicable Classification Code)
- 5.3.5 Category 5 (Applicable Classification Code)
- 5.4 Cross-Border Pricing & Transaction Benchmarks
- 5.4.1 Export Pricing – Segment & Country
- 5.4.2 Import Pricing – Segment & Source Country
- 5.4.3 Price Trends (2024)
- 5.5 Key Cross-Border Trade & Delivery Routes
- 5.5.1 Cross-Border Trade/Delivery Route 1
- 5.5.2 Cross-Border Trade/Delivery Route 2
- 5.5.3 Cross-Border Trade/Delivery Route 3
- 5.5.4 Cross-Border Trade/Delivery Route 4
- 5.5.5 Cross-Border Trade/Delivery Route 5
- 5.6 Trade Policy & Market Access Impact Assessment
- 5.6.1 Tariff & Non-Tariff Barriers
- 5.6.2 Regional Trade & Economic Integration Frameworks
- 5.6.3 Bilateral & Multilateral Trade Agreements
- 5.6.4 Cross-Border Operating, Licensing & Localization Requirements
Note: This chapter applies where cross-border trade or delivery is relevant to Sustainable Bags. Goods, services, and digital offerings are assessed using applicable classifications and transaction measures. Import-export volumes, trade balances, and route analyses are included only where meaningful to the market.
Chapter 6. Competitive Landscape & Company Benchmarking
- 6.1 Sustainable Bags Market Concentration & Structure
- 6.1.1 Herfindahl-Hirschman Index (HHI) – vs. 2024
- 6.1.2 Leading, Mid-Sized & Emerging Player Structure
- 6.1.3 Global, Regional & Local Player Dynamics
- 6.2 Sustainable Bags Market Share Analysis – 2024
- 6.2.1 Global Revenue Share by Company
- 6.2.2 Global Volume Share by Company (Volume Where Applicable)
- 6.2.3 Regional Revenue Share
- 6.2.4 Market Share Evolution ( vs. 2024)
- 6.2.5 Company Market Share by Key Segment
- 6.2.6 Company Market Share by Customer Group
- 6.3 Operating Scale, Capacity & Infrastructure Analysis
- 6.3.1 Global Operating Scale & Supply Capacity
- 6.3.2 Resource Utilization & Operating Efficiency
- 6.3.3 Output, Service Delivery & Activity Metrics
- 6.3.4 Operating Footprint & Infrastructure Map
- 6.3.5 Planned Operational & Capacity Expansion
- 6.4 Sustainable Bags Competitive Benchmarking Matrix
- 6.4.1 Revenue, Growth, Profitability & Operating Metric Comparison
- 6.4.2 Channel Revenue Mix
- 6.4.3 Geographic Revenue Exposure
- 6.4.4 R&D Intensity
- 6.4.5 Sustainability Maturity
- 6.5 Strategic Developments in Sustainable Bags (Last 24 Months)
- 6.5.1 Mergers, Acquisitions & Divestments
- 6.5.2 New Products, Services & Solutions in Sustainable Bags
- 6.5.3 Operational & Infrastructure Expansions
- 6.5.4 Strategic Alliances, Joint Ventures & Partnerships
- 6.5.5 Distribution Expansion & Market Entry
- 6.5.6 Sustainability & ESG Initiatives
- 6.6 Competitive Strategy Mapping
- 6.6.1 Leader, Challenger, Follower & Niche Classification
- 6.6.2 Pricing Strategy Comparison
- 6.6.3 Channel Strategy Matrix
Note: Strategic developments are included based on their materiality and the availability of reliable information.
Chapter 7. Global Sustainable Bags Market – By Sales & Delivery Channel
- 7.1 Segment Overview
- 7.1.1 Volume & Revenue Split by Channel (2024 & 2032) (Volume Where Applicable)
- 7.1.2 Channel Mix Evolution (2024-2032)
Chapter 8. Regional Market Analysis – Global Overview
- 8.1 Global Regional Overview
- 8.1.1 Regional Volume Share (Volume Where Applicable)
- 8.1.2 Regional Revenue Share
- 8.1.3 Regional Volume by Region (Volume Where Applicable)
- 8.1.4 Regional Revenue by Region
- 8.1.5 Regional Forecast Through 2032
- 8.2 Cross-Regional Segment Analysis
- 8.2.1 By Sales & Delivery Channel
- 8.2.2 By Competitive Positioning & Price Tier
Chapter 9. North America Sustainable Bags Market
- 9.1 United States
- 9.2 Canada
- 9.3 Mexico
Chapter 10. Europe Sustainable Bags Market
- 10.1 Germany
- 10.2 France
- 10.3 Italy
- 10.4 United Kingdom
- 10.5 Spain
- 10.6 Poland
- 10.7 Russia
- 10.8 Netherlands
- 10.9 Belgium
- 10.10 Sweden
- 10.11 Denmark
- 10.12 Norway
- 10.13 Rest of Europe
Chapter 11. Asia Pacific Sustainable Bags Market
- 11.1 China
- 11.2 India
- 11.3 Japan
- 11.4 South Korea
- 11.5 Thailand
- 11.6 Indonesia
- 11.7 Vietnam
- 11.8 Malaysia
- 11.9 Australia
- 11.10 Rest of Asia Pacific
Chapter 12. Latin America Sustainable Bags Market
- 12.1 Brazil
- 12.2 Argentina
- 12.3 Colombia
- 12.4 Chile
- 12.5 Rest of Latin America
Chapter 13. Middle East Sustainable Bags Market
- 13.1 Saudi Arabia
- 13.2 United Arab Emirates
- 13.3 Turkey
- 13.4 Israel
- 13.5 Iran
- 13.6 Rest of the Middle East
Chapter 14. Africa Sustainable Bags Market
- 14.1 South Africa
- 14.2 Egypt
- 14.3 Nigeria
- 14.4 Morocco
- 14.5 Rest of Africa
Chapter 15. Sustainable Bags Company Profiles
- 15.1 [Company 01]
- 15.1.1 Company Overview
- 15.1.2 Key Management Personnel
- 15.1.3 Products & Services Portfolio
- 15.1.4 Financial Performance
- 15.1.5 Key Market Focus & Geographic Presence
- 15.1.6 Recent Developments & Strategic Initiatives
Note: The company profile list is preliminary and may change based on research findings, market developments, data availability, and client requirements.
Chapter 16. Appendices
- Appendix A – List of Abbreviations & Acronyms
- Appendix B – Industry Classification Code Reference – Full Series
- Appendix C – Supply, Output & Operating Capacity Data Tables
- Appendix D – End-Use & Demand Base Tables
- Appendix E – Demand, Adoption & Usage Assumptions
- Appendix F – Pricing & Revenue Metric Reference Tables
- Appendix G – Company Operations & Infrastructure Database
- Appendix H – Cross-Border Trade & Activity Data Tables (Where Applicable)
- Appendix I – Regulatory Summary Tables
- Appendix J – Primary Research Participant List (Anonymized)
- Appendix K – Primary Research Questionnaire Framework
- Appendix L – Data Sources & Bibliography
- Appendix M – Market Size Divergence & Source Comparison
Chapter 17. Research Methodology
- 17.1 Research Framework & Philosophy
- 17.2 Secondary Research – Sources, Hierarchy & Data Extraction
- 17.3 Data Modeling – Bottom-Up & Top-Down Market Sizing
- 17.4 Primary Research – Stakeholder Framework, LOI & Sample Sizes
- 17.5 Forecast Methodology – Regression, Scenario & Sensitivity Analysis
- 17.6 Quality Control – Four-Layer Validation Framework
- 17.7 Limitations & Standard Assumptions
- 17.8 Disclaimer
