
Market Overview:
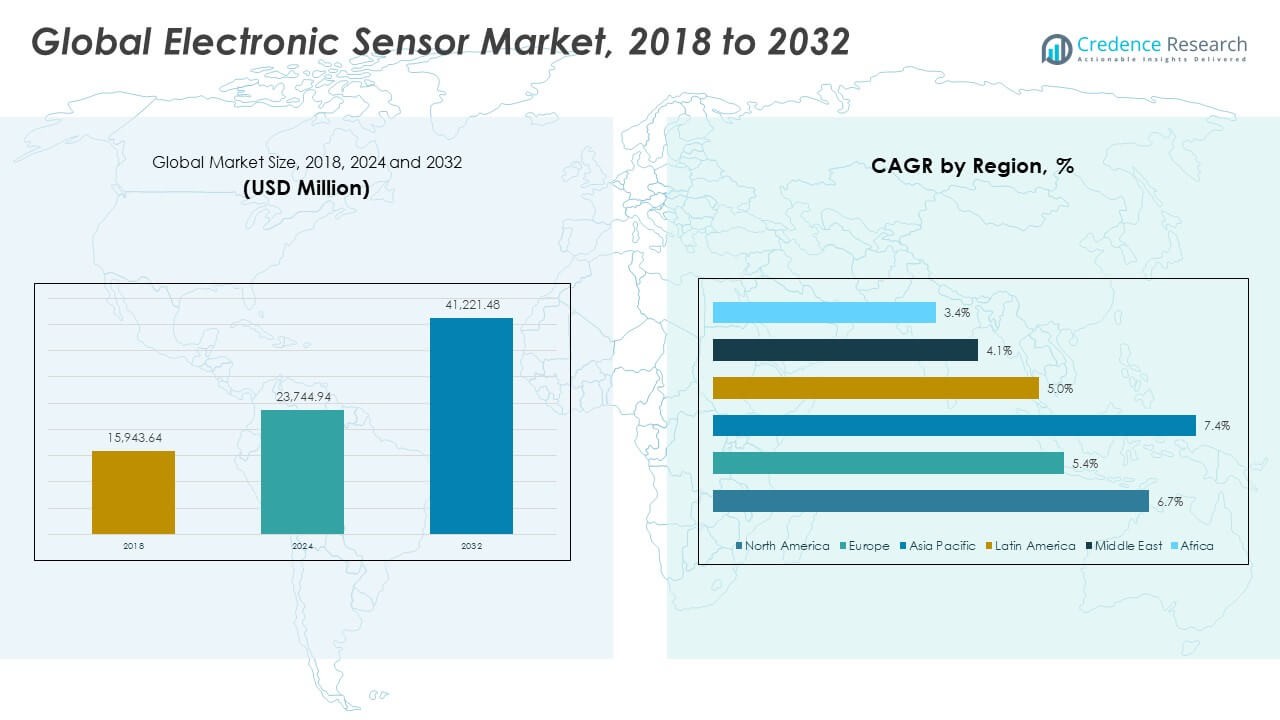
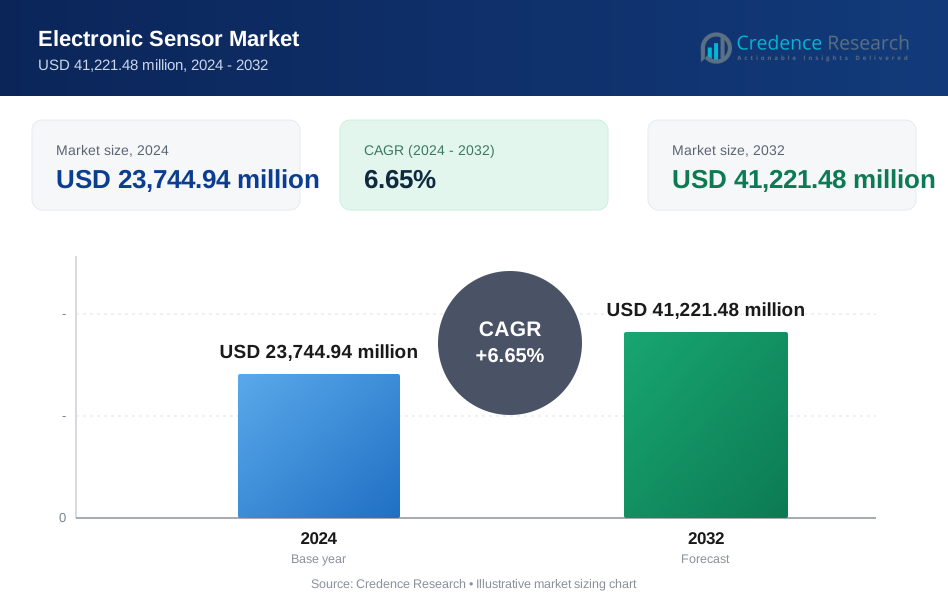
The Global Electronic Sensor Market size was valued at USD 15,943.64 million in 2018 to USD 23,744.94 million in 2024 and is anticipated to reach USD 41,221.48 million by 2032, at a CAGR of 6.65% during the forecast period.
| REPORT ATTRIBUTE | DETAILS |
|---|---|
| Historical Period | 2020-2023 |
| Base Year | 2024 |
| Forecast Period | 2025-2032 |
| Electronic Sensor Market Size 2024 | USD 23,744.94 Million |
| Electronic Sensor Market, CAGR | 6.65% |
| Electronic Sensor Market Size 2032 | USD 41,221.48 Million |
The market is experiencing strong growth driven by increasing demand for advanced sensor technologies across multiple industries. Rising adoption of IoT, smart devices, and automation solutions enhances the deployment of sensors in automotive, healthcare, industrial, and consumer electronics. Technological advancements in miniaturization, energy efficiency, and wireless connectivity strengthen product performance. Growing investment in real-time monitoring, predictive maintenance, and environmental sensing further accelerates adoption across both developed and emerging markets.
Asia Pacific leads the market, supported by strong electronics manufacturing, rapid industrialization, and extensive R&D activities. North America maintains a significant share with early adoption of smart technologies and automotive innovations. Europe benefits from strong industrial and energy-efficiency initiatives. Latin America, the Middle East, and Africa are emerging regions, supported by infrastructure modernization and digital transformation efforts. This regional mix highlights a balanced growth pattern across global markets.
Market Insights:
- The Global Electronic Sensor Market size was valued at USD 15,943.64 million in 2018, USD 23,744.94 million in 2024, and is projected to reach USD 41,221.48 million by 2032, growing at a CAGR of 6.65%.
- Asia Pacific leads with 48% market share, supported by its strong electronics manufacturing base and rapid industrialization. North America holds 28% due to advanced automotive, healthcare, and IoT adoption, while Europe commands 19% with robust industrial automation and energy efficiency initiatives.
- Asia Pacific is the fastest-growing region, driven by high R&D investment, smart infrastructure projects, and large-scale sensor integration in automotive and consumer electronics.
- Image sensors hold 34% of the market, driven by their critical role in smartphones, ADAS systems, and surveillance applications.
- Temperature, pressure, and proximity sensors together contribute 51% of the market, supported by their integration in industrial, automotive, and healthcare applications.
Market Drivers
Expanding Industrial Automation and Sensor Integration in Smart Manufacturing Systems
Industrial automation drives strong demand for advanced sensors. Industries adopt connected sensors to improve production efficiency and monitor machine performance. These sensors enable predictive maintenance and minimize equipment downtime. Manufacturers rely on precise measurements to achieve higher product quality. Integration with smart manufacturing systems ensures real-time operational control. The shift toward digital production requires scalable and reliable sensing solutions. Strong focus on energy efficiency supports sensor upgrades. The Global Electronic Sensor Market benefits from increased investment in Industry 4.0 technologies.
- For instance, Siemens’ Amberg Electronics Works in Germany produces over 15 million controllers annually with a 99.9988% quality rate, enabled by 1,000 scanners and 1,000 machines generating 50 million process data points daily for real-time monitoring and optimization of production through digital twin integration.
Rising Adoption of Smart Devices Across Consumer and Automotive Applications
Smartphones, wearables, and connected cars use a broad range of sensors. These devices depend on pressure, temperature, motion, and image sensors for accurate functions. Growing consumer preference for smart features boosts innovation. Automotive systems integrate sensors for navigation, safety, and comfort. Advanced driver-assistance systems depend on radar, lidar, and proximity sensing. The use of smart wearables for health monitoring creates new growth avenues. Strong penetration of connected devices fuels sensor demand. The Global Electronic Sensor Market gains momentum through expanding IoT ecosystems.
Increasing Demand for Healthcare Monitoring and Diagnostic Applications
Sensor technology improves the accuracy and efficiency of healthcare diagnostics. Medical devices use sensors to monitor temperature, pressure, glucose levels, and heart rate. Hospitals deploy connected sensors to track patient conditions in real time. Portable diagnostic tools enhance patient convenience and enable faster decision-making. The growing geriatric population creates steady demand for wearable health sensors. Home healthcare solutions rely on smart sensing systems for remote monitoring. Product developers prioritize miniaturized and energy-efficient sensor designs. The Global Electronic Sensor Market strengthens through medical sector advancements.
Growing Deployment of Energy-Efficient and Low-Power Sensor Solutions
The need to reduce power consumption encourages the use of low-energy sensors. Manufacturers develop compact sensors with extended battery life for remote operations. Smart buildings and infrastructure use these sensors for efficient energy control. Utility providers integrate sensing technologies to track real-time energy usage. Low-power IoT devices support broader adoption in multiple applications. Focus on energy conservation aligns with sustainability goals. This trend enhances the operational life of connected devices. The Global Electronic Sensor Market gains from energy-efficient sensor innovations.
- For instance, Texas Instruments’ HDC3020 digital humidity and temperature sensor provides ±1.5% RH and ±0.1°C accuracy, with ultra-low power consumption under 100 µA in active mode, making it ideal for battery-operated and energy-efficient smart building systems requiring long operational life.
Market Trends
Integration of Artificial Intelligence and Machine Learning in Sensor Platforms
AI enhances sensor processing capabilities by enabling real-time decision-making. Machine learning models identify patterns and improve sensor response accuracy. Industries adopt AI-enabled sensing systems for predictive maintenance. These systems reduce human intervention and operational costs. Smart sensors use AI to enhance environmental adaptability. Companies invest in edge AI solutions to improve data processing speed. AI integration supports automated and adaptive sensor networks. The Global Electronic Sensor Market evolves with intelligent sensing architectures.
Rapid Miniaturization of Sensors for Compact and Portable Devices
Miniaturization allows sensors to fit into smaller, lightweight devices. Consumer electronics and wearables demand compact sensor designs. Advances in MEMS technology enable high-performance sensors in limited spaces. Healthcare devices benefit from smaller sensors without losing precision. Industrial tools incorporate miniaturized sensors to optimize equipment. Compact size lowers costs and expands product design flexibility. This trend supports mass production of smart devices. The Global Electronic Sensor Market progresses with miniaturized sensor innovations.
- For instance, in May 2025, STMicroelectronics unveiled an AI-enabled Inertial Measurement Unit (IMU) that combines activity tracking and high-impact sensing, capable of measuring up to 320 g full-scale range in a miniature dual-MEMS configuration. This innovation enhances performance in wearables and IoT systems while maintaining power efficiency through embedded machine learning cores.
Adoption of Advanced Communication Protocols for Real-Time Data Sharing
Improved connectivity strengthens the role of sensors in connected systems. Adoption of 5G, Wi-Fi 6, and LPWAN boosts real-time data transmission. Industries depend on these protocols to support large-scale sensor networks. Fast communication enhances system responsiveness and accuracy. Smart factories leverage connected sensors to optimize operations. Secure and stable data transfer builds trust in industrial applications. Enhanced interoperability encourages broader integration of sensing technologies. The Global Electronic Sensor Market expands through advanced communication frameworks.
Focus on Sustainable Materials and Environmentally Friendly Sensor Production
Companies invest in eco-friendly sensor manufacturing processes. Sustainable materials reduce environmental impact during production. Energy-efficient designs align with global carbon reduction targets. Recyclable components support a circular economy approach. Governments promote green technologies through favorable regulations. Market players use eco-labeling to attract environmentally conscious buyers. This trend aligns innovation with sustainability objectives. The Global Electronic Sensor Market adapts to rising demand for green sensor solutions.
- For instance, in June 2025, Bosch Research initiated a pan-European consortium to develop sustainable MEMS production processes and began pilot-scale manufacturing of recycled-plastic ultrasonic sensors. The new material withstands temperatures up to 130°C for 300 hours and reduces production-related CO₂ emissions by 500 tons per year through large-scale recyclate integration.
Market Challenges Analysis
High Production Costs and Complex
Manufacturing Requirements for Advanced Sensors
The design and production of advanced sensors require specialized equipment. High-precision manufacturing raises the overall production cost. Small and mid-sized companies struggle with capital-intensive infrastructure. Complex fabrication processes increase development time and limit scalability. Strict quality standards demand consistent performance across sensor units. Any design error can lead to high rejection rates during testing. These factors limit the rapid expansion of new sensor technologies. The Global Electronic Sensor Market faces cost-related barriers to broad adoption.
Supply Chain Instability and Shortage of Critical Semiconductor Components
The global semiconductor shortage affects sensor production capacity. Delays in material supply disrupt manufacturing schedules. Companies experience longer lead times and rising procurement costs. Geopolitical tensions and trade barriers add more uncertainty. Production delays impact automotive, healthcare, and electronics industries. Limited supply of key components reduces sensor availability. This instability restricts innovation cycles and affects market competitiveness. The Global Electronic Sensor Market must address these supply chain disruptions to maintain growth.
Market Opportunities
Growing Integration of Sensors into Emerging Smart Infrastructure Projects
Smart cities and connected infrastructure projects rely heavily on advanced sensors. Governments invest in intelligent transportation, energy grids, and surveillance systems. These initiatives create new commercial opportunities for sensor suppliers. Real-time monitoring improves urban planning and resource efficiency. Companies design scalable sensing networks for long-term operations. Strategic partnerships help expand product reach in public projects. The Global Electronic Sensor Market gains from this rising infrastructure integration trend.
Expanding Applications of Sensors in Renewable Energy and Environmental Monitoring
Environmental regulations encourage adoption of smart sensors in renewable energy systems. Wind, solar, and hydropower operations depend on sensors for performance optimization. Real-time data supports better energy distribution and grid management. Air and water quality monitoring applications continue to grow globally. These use cases increase demand for durable, accurate, and low-power sensors. Technology developers explore niche opportunities in green energy solutions. The Global Electronic Sensor Market benefits from rising clean energy investments.
Market Segmentation Analysis:
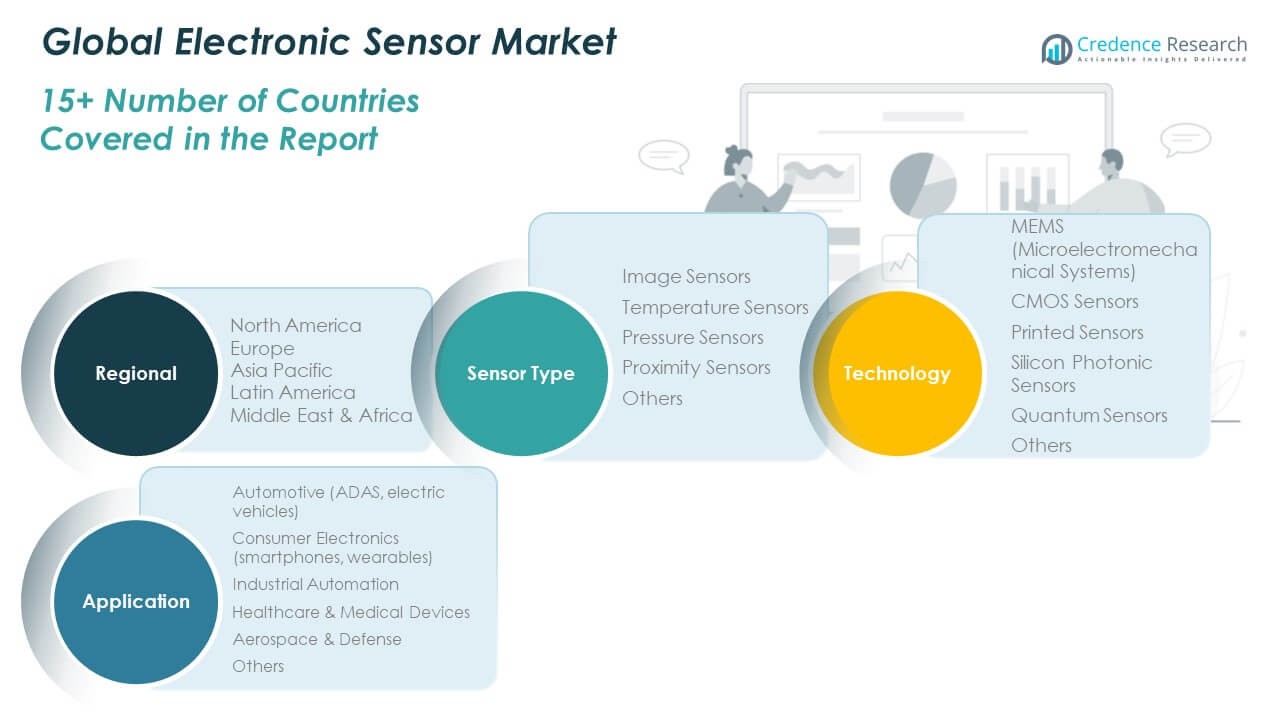
The Global Electronic Sensor Market is segmented by sensor type, technology and application.
By sensor type, image sensors dominate due to their widespread use in smartphones, automotive cameras, and surveillance systems. Temperature and pressure sensors show strong adoption in industrial automation and healthcare equipment. Proximity sensors play a critical role in automotive safety and robotics. The “others” category includes niche sensors serving specialized applications in research, energy, and defense sectors.
- For instance, Omron’s E2E NEXT proximity sensor series, capable of detecting targets up to 26 mm, has been deployed in robotic manufacturing systems to reduce downtime in 2025.
By technology, MEMS sensors lead due to their compact size, low power use, and precision. CMOS sensors follow, supported by rapid integration in imaging and consumer electronics. Printed sensors gain traction in flexible and wearable electronics, while silicon photonic sensors support advanced optical systems. Quantum sensors show growing potential in aerospace and defense. These technologies enhance performance, efficiency, and application versatility across industries.
- For instance, Samsung’s ISOCELL HP1 sensor, featuring 200 MP resolution and ChameleonCell pixel binning, adapts between 12.5 MP and 200 MP modes for varying lighting conditions. Printed sensors gain traction in flexible and wearable devices.
By application, automotive and consumer electronics segments generate the highest demand, driven by ADAS, EV systems, and smart devices. Industrial automation and healthcare applications continue expanding with digital transformation. Aerospace and defense segments use advanced sensing for navigation, monitoring, and security.
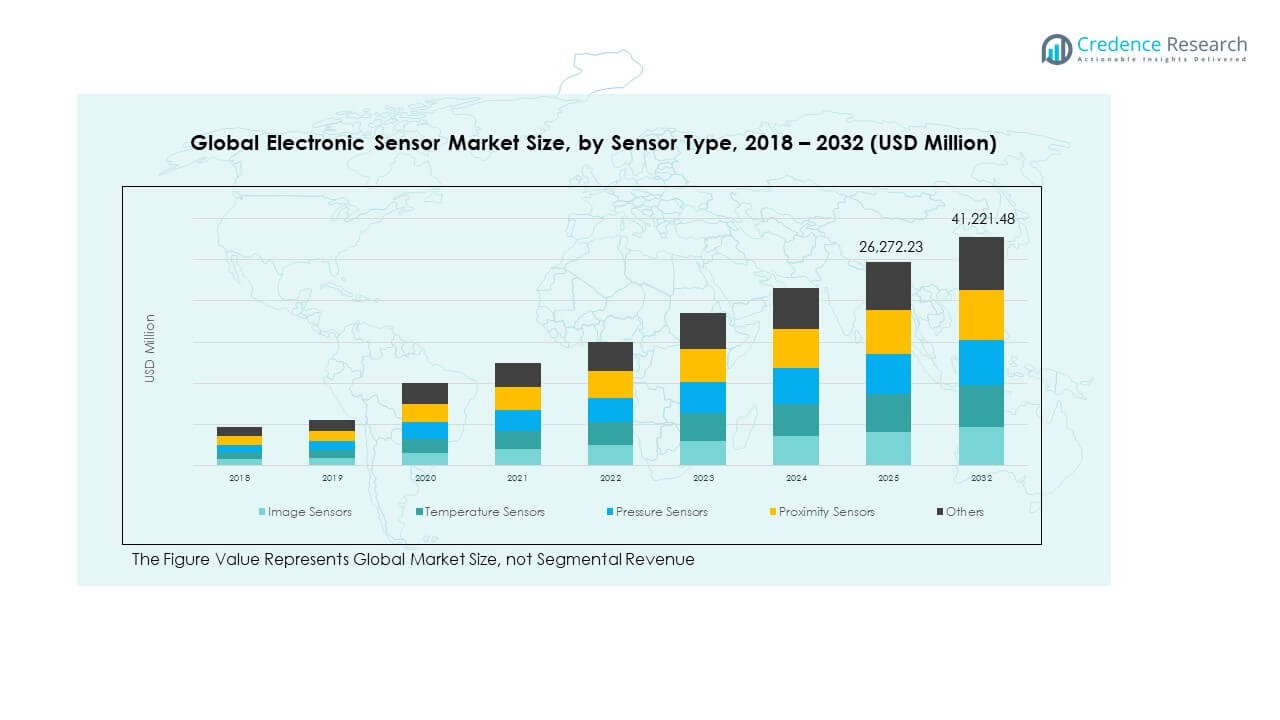
Segmentation:
By Sensor Type
- Image Sensors
- Temperature Sensors
- Pressure Sensors
- Proximity Sensors
- Others
By Technology
- MEMS (Microelectromechanical Systems)
- CMOS Sensors
- Printed Sensors
- Silicon Photonic Sensors
- Quantum Sensors
- Others
By Application
- Automotive (ADAS, electric vehicles)
- Consumer Electronics (smartphones, wearables)
- Industrial Automation
- Healthcare & Medical Devices
- Aerospace & Defense
- Others
By Region
- North America
- U.S.
- Canada
- Mexico
- Europe
- Germany
- France
- U.K.
- Italy
- Spain
- Rest of Europe
- Asia Pacific
- China
- Japan
- India
- South Korea
- South-east Asia
- Rest of Asia Pacific
- Latin America
- Brazil
- Argentina
- Rest of Latin America
- Middle East & Africa
- GCC Countries
- South Africa
- Rest of the Middle East and Africa
Regional Analysis:
North America
The North America Global Electronic Sensor Market size was valued at USD 4,515.78 million in 2018 to USD 6,617.69 million in 2024 and is anticipated to reach USD 11,537.85 million by 2032, at a CAGR of 6.7% during the forecast period. North America holds a 28% market share, supported by strong demand from the automotive, healthcare, and consumer electronics sectors. It benefits from early technology adoption and well-established R&D infrastructure. Sensor integration in advanced driver-assistance systems, wearables, and industrial automation drives growth. Companies invest in advanced MEMS and CMOS technologies to support innovation. The region’s strong semiconductor base helps meet rising demand for high-performance sensors. It focuses on precision, energy efficiency, and digital transformation across multiple industries. This environment strengthens its leadership position in global sensor innovation.
Europe
The Europe Global Electronic Sensor Market size was valued at USD 3,002.91 million in 2018 to USD 4,229.41 million in 2024 and is anticipated to reach USD 6,682.76 million by 2032, at a CAGR of 5.4% during the forecast period. Europe holds a 19% market share, supported by robust industrial manufacturing and automotive technology sectors. The region’s emphasis on Industry 4.0 accelerates sensor deployment in smart factories and logistics. Strong environmental regulations encourage the use of sensors in energy management and emission monitoring. The healthcare sector adopts advanced sensing solutions for diagnostics and patient care. Investment in sustainable manufacturing and digital transformation remains high. The presence of leading sensor producers enhances market competitiveness. It continues to build strong sensor infrastructure aligned with innovation goals.
Asia Pacific
The Asia Pacific Global Electronic Sensor Market size was valued at USD 7,036.64 million in 2018 to USD 10,862.84 million in 2024 and is anticipated to reach USD 19,997.37 million by 2032, at a CAGR of 7.4% during the forecast period. Asia Pacific leads with a 48% market share, driven by strong electronics manufacturing and rapid industrialization. China, Japan, South Korea, and India play a major role in production and innovation. Consumer electronics, automotive, and industrial sectors contribute to high sensor demand. Major companies invest heavily in R&D to maintain cost efficiency and product advancement. Governments promote digitalization and smart city initiatives, creating new market opportunities. The region benefits from a skilled workforce and large-scale production capabilities. It remains the primary growth engine for global sensor deployment.
Latin America
The Latin America Global Electronic Sensor Market size was valued at USD 753.09 million in 2018 to USD 1,107.64 million in 2024 and is anticipated to reach USD 1,701.92 million by 2032, at a CAGR of 5.0% during the forecast period. Latin America accounts for a 4% market share, supported by growing investment in automotive and infrastructure projects. Brazil and Argentina lead in sensor adoption for manufacturing and smart transport applications. Expanding healthcare infrastructure increases demand for medical sensors. Government initiatives promote modernization in utilities and energy sectors. The industrial base is growing steadily, driving local sensor integration. International partnerships enhance product availability and technology transfer. It shows consistent growth potential supported by infrastructure expansion.
Middle East
The Middle East Global Electronic Sensor Market size was valued at USD 402.32 million in 2018 to USD 542.04 million in 2024 and is anticipated to reach USD 776.10 million by 2032, at a CAGR of 4.1% during the forecast period. The Middle East holds a 3% market share, with rising demand driven by energy, oil and gas, and smart infrastructure projects. Governments focus on digital transformation and renewable energy monitoring systems. Sensor technologies support safety, control, and operational efficiency in critical industries. The construction of smart cities increases deployment in environmental and security applications. Investments in automation enhance competitiveness in the industrial sector. Regional collaborations bring advanced technologies to local markets. It maintains steady growth backed by energy diversification strategies.
Africa
The Africa Global Electronic Sensor Market size was valued at USD 232.89 million in 2018 to USD 385.33 million in 2024 and is anticipated to reach USD 525.49 million by 2032, at a CAGR of 3.4% during the forecast period. Africa holds a 2% market share, supported by gradual expansion of energy and infrastructure projects. Smart grid development and environmental monitoring increase sensor usage. Demand from healthcare, agriculture, and industrial sectors shows steady progress. Governments focus on modernizing urban infrastructure through connected technologies. Import-driven availability influences market growth across key economies. Partnerships with global manufacturers improve product access and technology adoption. It remains an emerging region with untapped opportunities for sensor deployment.
Key Player Analysis:
- Texas Instruments
- Honeywell International
- TE Connectivity
- STMicroelectronics
- Bosch Sensortec
- Infineon Technologies
- Analog Devices
- NXP Semiconductors
- Sony Corporation
- Samsung Electro-Mechanics
Competitive Analysis:
The Global Electronic Sensor Market is highly competitive with strong participation from established manufacturers and emerging innovators. It is shaped by product innovation, strategic partnerships, and regional expansion. Key players focus on developing high-performance sensors with improved accuracy, energy efficiency, and miniaturized designs. Companies invest in advanced MEMS and CMOS technologies to strengthen their portfolios. Leading firms emphasize R&D to maintain technological leadership and meet rising demand in automotive, healthcare, and industrial automation. Strategic acquisitions and collaborations help expand market reach and accelerate product launches. The competitive landscape reflects a mix of large multinational corporations and specialized niche players, driving continuous innovation and price competitiveness across global and regional markets.
Recent Developments:
- In October 2025, Texas Instruments announced a collaboration with Tobii, D3 Embedded, and HTEC to develop a next-generation interior sensing solution for vehicles, debuting at the InCabin Europe conference. The system integrates Texas Instruments’ TDA4VEN processor from the Jacinto 7 family with its AWRL6844 mmWave radar sensor for enhanced occupant detection and safety monitoring.
- In October 2025, Honeywell International entered a global strategic partnership with LS ELECTRIC to create and market integrated hardware and software solutions aimed at improving power management for data centers and large building operators. The collaboration enhances Honeywell’s capabilities in building automation and energy-efficient systems, directly addressing power optimization needs within the infrastructure and commercial building markets.
- In October 2025, TE Connectivity launched a new inside-device connectivity portfolio for automotive applications, designed to support next-generation electronic control units and software-defined vehicles. The portfolio includes connector solutions optimized for power conversion, battery management systems, and radar and LiDAR-based driver-assistance technologies, enhancing sensor integration and performance in EMI-sensitive environments
- In October 2025, STMicroelectronics introduced four new BrightSense 5MP CMOS image sensors VD1943, VB1943, VD5943, and VB5943 engineered for industrial automation, retail, and security applications. The sensors employ hybrid global and rolling shutter technology with 2.25µm pixels, advanced 3D stacking, and on-chip RGB‑IR separation to deliver high‑speed, low‑noise, and detailed image capture.
Report Coverage:
The research report offers an in-depth analysis based on Sensor Type, Technology and Application. It details leading market players, providing an overview of their business, product offerings, investments, revenue streams, and key applications. Additionally, the report includes insights into the competitive environment, SWOT analysis, current market trends, as well as the primary drivers and constraints. Furthermore, it discusses various factors that have driven market expansion in recent years. The report also explores market dynamics, regulatory scenarios, and technological advancements that are shaping the industry. It assesses the impact of external factors and global economic changes on market growth. Lastly, it provides strategic recommendations for new entrants and established companies to navigate the complexities of the market.
Future Outlook:
- Sensor miniaturization will strengthen adoption in consumer electronics, wearables, and compact devices.
- AI and machine learning integration will enhance real-time decision-making capabilities.
- Advanced automotive applications will drive strong demand across ADAS and EV systems.
- Industrial automation will accelerate sensor deployment in predictive maintenance and process control.
- Rising healthcare innovation will boost the use of sensors in monitoring and diagnostics.
- Expansion of 5G networks will enable faster sensor data transfer and improved connectivity.
- Environmental monitoring and smart infrastructure projects will expand adoption in urban ecosystems.
- Sustainable and energy-efficient sensor technologies will become a core product focus.
- Regional diversification will support balanced growth across both mature and emerging markets.
- Competitive intensity will increase through product innovation, partnerships, and acquisitions.
Request a Free Sample
Fill in your details and we'll send you a free sample report.
- Sample data tables & charts
- Research methodology
Need a Custom Version of This Report?
Tailor the scope, geography, or segments to your exact requirements.
- Custom geography or segment scope
- Direct access to our analyst team
Frequently Asked Questions
What is the current market size for Global Electronic Sensor Market, and what is its projected size in 2032?
At what Compound Annual Growth Rate is the Global Electronic Sensor Market projected to grow between 2024 and 2032?
Which Global Electronic Sensor Market segment held the largest share in 2024?
What are the primary factors fueling the growth of the Global Electronic Sensor Market?
Who are the leading companies in the Global Electronic Sensor Market?
Which region commanded the largest share of the Global Electronic Sensor Market in 2024?
Table of Content
Chapter 1. Report Introduction
- 1.1 Report Description & Purpose
- 1.1.1 Report Title & Market Definition
- 1.1.2 Unique Selling Propositions (USP) & Key Differentiators
- 1.1.3 Value Proposition for Stakeholders
- 1.2 Research Objectives
- 1.2.1 Market Sizing Objectives (Volume & Revenue)
- 1.2.2 Segmentation Objectives
- 1.2.3 Competitive Intelligence Objectives
- 1.2.4 Forecast & Scenario Objectives
- 1.3 Report Scope
- 1.3.1 Electronic Sensor Scope – Types & Subtypes Covered
- 1.3.2 Geographic Scope – Regions & Countries Covered
- 1.3.3 Historical Period, Base Year & Forecast Period (2024; forecast to 2032)
- 1.3.4 Inclusions & Exclusions
- 1.4 HS Code & Classification Framework
- 1.5 Currency, Units & Pricing Basis
- 1.6 Target Stakeholders
- 1.7 Limitations & Assumptions
Chapter 2. Executive Summary
- 2.1 Global Electronic Sensor Market Snapshot
- 2.1.1 Market Size – Historical (2024) & Forecast (2024-2032) (2024: USD 23,744.94 million → 2032: USD 41,221.48 million)
- 2.1.2 Volume & Revenue – Global Totals
- 2.1.3 Key Market Highlights – Top Five Facts
- 2.2 Electronic Sensor Market Segmentation Snapshot
- 2.2.1 Market Split by Region – 2024 vs. 2032
- 2.3 Competitive Snapshot
- 2.3.1 Top 10 Players by Revenue Share – 2024
- 2.3.2 Top 10 Players by Volume Share – 2024
- 2.3.3 Recent Strategic Developments (18-Month Summary)
- 2.4 Key Investment Highlights & Strategic Conclusions
Chapter 3. Electronic Sensor Market Dynamics & Industry Analysis
- 3.1 Market Overview & Context
- 3.1.1 Electronic Sensor Market Position in the Broader Automotive Value Chain
- 3.1.2 OEM vs. Replacement Market Dynamics
- 3.1.3 Market Maturity & Development Stage by Region
- 3.2 Electronic Sensor Market Drivers
- 3.3 Electronic Sensor Market Restraints & Challenges
- 3.4 Electronic Sensor Market Opportunities
- 3.5 Porter's Five Forces Analysis
- 3.5.1 Threat of New Entrants
- 3.5.2 Bargaining Power of Suppliers
- 3.5.3 Bargaining Power of Buyers
- 3.5.4 Threat of Substitutes
- 3.5.5 Competitive Rivalry – Intensity Assessment
- 3.6 Electronic Sensor Value Chain Analysis
- 3.6.1 Upstream – Raw Material/Input Suppliers
- 3.6.1.1 Raw Material/Input 1
- 3.6.1.2 Raw Material/Input 2
- 3.6.1.3 Raw Material/Input 3
- 3.6.2 Midstream – Production/Manufacturing/Service Delivery
- 3.6.2.1 Production/Process Overview
- 3.6.2.2 Key Facility Locations & Capacity by Manufacturer
- 3.6.3 Downstream – Distribution & End Consumer
- 3.6.3.1 Primary Channel – B2B/OEM
- 3.6.3.2 Secondary Channels – Dealer, Retail, Online, Direct
- 3.6.4 Value Chain Profitability Analysis
- 3.6.1 Upstream – Raw Material/Input Suppliers
- 3.7 PESTEL Analysis
- 3.7.1 Political Factors
- 3.7.2 Economic Factors
- 3.7.3 Social Factors
- 3.7.4 Technological Factors
- 3.7.5 Environmental Factors
- 3.7.6 Legal Factors
- 3.8 Electronic Sensor Supply Chain Analysis
- 3.8.1 Raw Material/Input Supply Risk Assessment
- 3.8.2 Manufacturing Concentration Risk (Geographic Exposure)
- 3.8.3 Trade Disruption Impact Analysis
- 3.9 Regulatory & Policy Landscape
Note: The regulatory and policy landscape section covers regulations based on their applicability to the market, Electronic Sensor category, geography, and scope of the study. Only regulatory frameworks with a material impact on operations, compliance, trade, sustainability, or market access are analyzed in detail.
Chapter 4. Key Investment Pockets & Opportunity Analysis
- 4.1 Electronic Sensor Market Attractiveness Analysis
- 4.1.1 By Region – Investment Attractiveness Matrix (Volume × CAGR)
- 4.2 Absolute Revenue Growth Opportunity
- 4.2.1 By Region – Absolute USD Growth Through 2032
- 4.3 Incremental Volume Opportunity
- 4.3.1 By Region – Incremental Volume Through 2032
- 4.3.2 Segment – Incremental Volume
- 4.4 Emerging Submarket Opportunity Deep Dive (Subject to Applicability)
- 4.5 Emerging Market Opportunity Scorecards
- 4.5.1 United States
- 4.5.2 Europe
- 4.5.3 Asia
- 4.5.4 Middle East & Africa
Note: Emerging Market Opportunity Scorecards will be included based on relevance and strategic importance. Regions listed are indicative and may vary depending on data availability and market dynamics.
Chapter 5. Electronic Sensor Import-Export Analysis & Trade Flows
- 5.1 Global Trade Overview
- 5.1.1 Global Export Value by Country (2024)
- 5.1.2 Global Export Volume by Country (2024)
- 5.1.3 Global Import Value by Country (2024)
- 5.1.4 Global Import Volume by Country (2024)
- 5.1.5 Net Trade Balance by Country (2024)
- 5.2 Export Analysis – Segment
- 5.2.1 Type 1 (HS Code)
- 5.2.2 Type 2 (HS Code)
- 5.2.3 Type 3 (HS Code)
- 5.2.4 Type 4 (HS Code)
- 5.2.5 Type 5 (HS Code)
- 5.3 Import Analysis – Segment
- 5.3.1 Type 1 (HS Code)
- 5.3.2 Type 2 (HS Code)
- 5.3.3 Type 3 (HS Code)
- 5.3.4 Type 4 (HS Code)
- 5.3.5 Type 5 (HS Code)
- 5.4 Average Unit Trade Prices
- 5.4.1 Average Export Price – Segment & Country
- 5.4.2 Average Import Price – Segment & Source Country
- 5.4.3 Price Trends (2024)
- 5.5 Key Trade Route Analysis
- 5.5.1 Trade Route 1
- 5.5.2 Trade Route 2
- 5.5.3 Trade Route 3
- 5.5.4 Trade Route 4
- 5.5.5 Trade Route 5
- 5.6 Trade Policy Impact Assessment
- 5.6.1 US Anti-Dumping & Section 301 Tariffs
- 5.6.2 EU Customs Union Impact
- 5.6.3 Major Free Trade Agreements
- 5.6.4 USMCA Rules of Origin
Note: Trade policy analysis will be included only where relevant to the Electronic Sensor market.
Chapter 6. Competitive Landscape & Company Benchmarking
- 6.1 Electronic Sensor Market Concentration & Structure
- 6.1.1 Herfindahl-Hirschman Index (HHI) – vs. 2024
- 6.1.2 Tier 1, Tier 2 & Tier 3 Market Structure
- 6.1.3 Global, Regional & Local Player Dynamics
- 6.2 Electronic Sensor Market Share Analysis – 2024
- 6.2.1 Global Revenue Share by Company
- 6.2.2 Global Volume Share by Company
- 6.2.3 Regional Revenue Share
- 6.2.4 Market Share Evolution ( vs. 2024)
- 6.2.5 OEM Segment Share by Company
- 6.2.6 Replacement Segment Share by Company
- 6.3 Production/Delivery Capacity & Facility Analysis
- 6.3.1 Global Installed Capacity
- 6.3.2 Capacity Utilization Rates
- 6.3.3 Production/Output Volume
- 6.3.4 Facility Locations & Capacity Map
- 6.3.5 Planned Capacity Additions
- 6.4 Electronic Sensor Competitive Benchmarking Matrix
- 6.4.1 Revenue, Volume, CAGR & Profitability Comparison
- 6.4.2 Channel Revenue Mix
- 6.4.3 Geographic Revenue Exposure
- 6.4.4 R&D Intensity
- 6.4.5 Sustainability Maturity
- 6.5 Strategic Developments in Electronic Sensor (Last 24 Months)
- 6.5.1 Mergers, Acquisitions & Divestments
- 6.5.2 New Electronic Sensor Launches
- 6.5.3 Facility Expansions
- 6.5.4 Strategic Alliances, Joint Ventures & Partnerships
- 6.5.5 Distribution Expansion & Market Entry
- 6.5.6 Sustainability & ESG Initiatives
- 6.6 Competitive Strategy Mapping
- 6.6.1 Leader, Challenger, Follower & Niche Classification
- 6.6.2 Pricing Strategy Comparison
- 6.6.3 Channel Strategy Matrix
Note: Strategic developments are included based on their materiality and the availability of reliable information.
Chapter 7. Global Electronic Sensor Market – By Distribution Channel
- 7.1 Segment Overview
- 7.1.1 Volume & Revenue Split by Channel (2024 & 2032)
- 7.1.2 Channel Mix Evolution (2024-2032)
Chapter 8. Regional Market Analysis – Global Overview
- 8.1 Global Regional Overview
- 8.1.1 Regional Volume Share
- 8.1.2 Regional Revenue Share
- 8.1.3 Regional Volume by Region
- 8.1.4 Regional Revenue by Region
- 8.1.5 Regional Forecast Through 2032
- 8.2 Cross-Regional Segment Analysis
- 8.2.1 By Distribution Channel
- 8.2.2 By Brand/Price Tier
Chapter 9. North America Electronic Sensor Market
- 9.1 United States
- 9.2 Canada
- 9.3 Mexico
Chapter 10. Europe Electronic Sensor Market
- 10.1 Germany
- 10.2 France
- 10.3 Italy
- 10.4 United Kingdom
- 10.5 Spain
- 10.6 Poland
- 10.7 Russia
- 10.8 Netherlands
- 10.9 Belgium
- 10.10 Sweden
- 10.11 Denmark
- 10.12 Norway
- 10.13 Rest of Europe
Chapter 11. Asia Pacific Electronic Sensor Market
- 11.1 China
- 11.2 India
- 11.3 Japan
- 11.4 South Korea
- 11.5 Thailand
- 11.6 Indonesia
- 11.7 Vietnam
- 11.8 Malaysia
- 11.9 Australia
- 11.10 Rest of Asia Pacific
Chapter 12. Latin America Electronic Sensor Market
- 12.1 Brazil
- 12.2 Argentina
- 12.3 Colombia
- 12.4 Chile
- 12.5 Rest of Latin America
Chapter 13. Middle East Electronic Sensor Market
- 13.1 Saudi Arabia
- 13.2 United Arab Emirates
- 13.3 Turkey
- 13.4 Israel
- 13.5 Iran
- 13.6 Rest of the Middle East
Chapter 14. Africa Electronic Sensor Market
- 14.1 South Africa
- 14.2 Egypt
- 14.3 Nigeria
- 14.4 Morocco
- 14.5 Rest of Africa
Chapter 15. Electronic Sensor Company Profiles
- 15.1 [Company 01]
- 15.1.1 Company Overview
- 15.1.2 Key Management Personnel
- 15.1.3 Products & Services Portfolio
- 15.1.4 Financial Performance
- 15.1.5 Key Market Focus & Geographic Presence
- 15.1.6 Recent Developments & Strategic Initiatives
Note: The company profile list is preliminary and may change based on research findings, market developments, data availability, and client requirements.
Chapter 16. Appendices
- Appendix A – List of Abbreviations & Acronyms
- Appendix B – Industry Classification Code Reference – Full Series
- Appendix C – Production & Capacity Data Tables
- Appendix D – End-Use & Demand Base Tables
- Appendix E – Consumption & Replacement Rate Assumptions
- Appendix F – ASP Reference Tables
- Appendix G – Manufacturing & Facility Database
- Appendix H – Import-Export Data Tables
- Appendix I – Regulatory Summary Tables
- Appendix J – Primary Research Participant List (Anonymized)
- Appendix K – Primary Research Questionnaire Framework
- Appendix L – Data Sources & Bibliography
- Appendix M – Market Size Divergence & Source Comparison
Chapter 17. Research Methodology
- 17.1 Research Framework & Philosophy
- 17.2 Secondary Research – Sources, Hierarchy & Data Extraction
- 17.3 Data Modeling – Bottom-Up & Top-Down Market Sizing
- 17.4 Primary Research – Stakeholder Framework, LOI & Sample Sizes
- 17.5 Forecast Methodology – Regression, Scenario & Sensitivity Analysis
- 17.6 Quality Control – Four-Layer Validation Framework
- 17.7 Limitations & Standard Assumptions
- 17.8 Disclaimer
