Market Overview
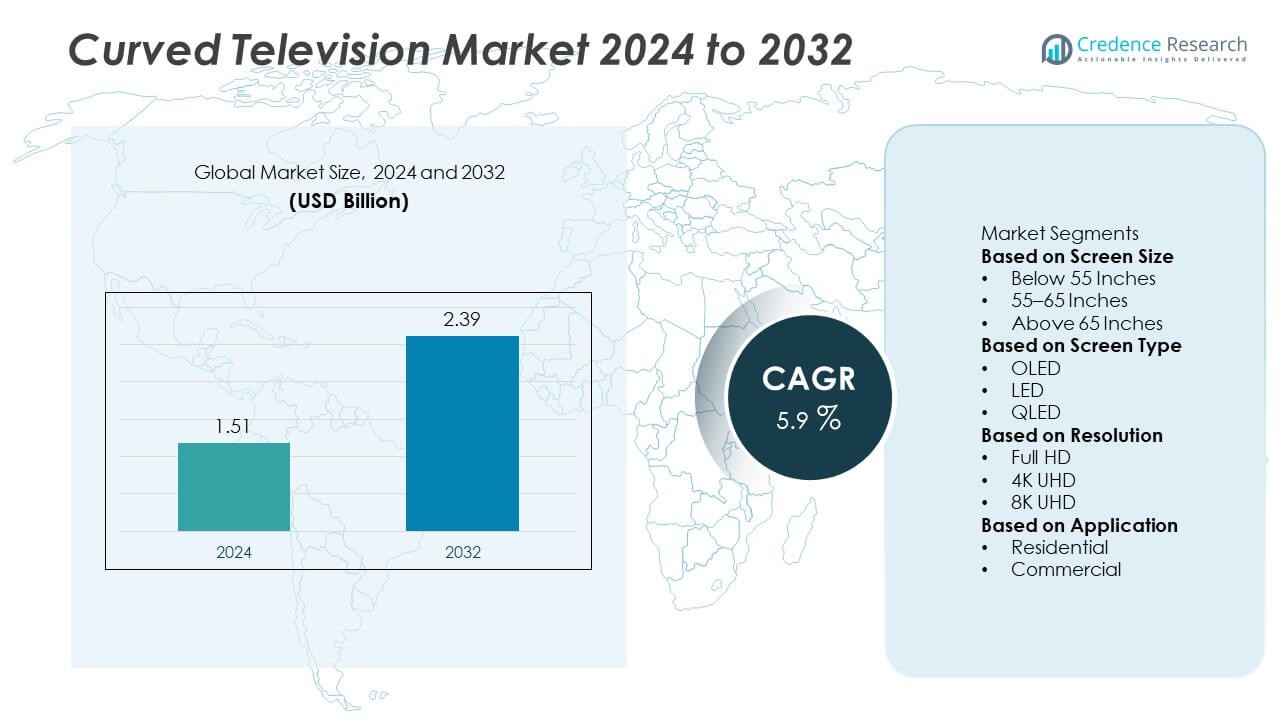
The Curved Television market was valued at USD 1.51 billion in 2024 and is projected to reach USD 2.39 billion by 2032, growing at a CAGR of 5.9% during the forecast period.
| REPORT ATTRIBUTE |
DETAILS |
| Historical Period |
2020-2023 |
| Base Year |
2024 |
| Forecast Period |
2025-2032 |
| Curved Television Market Size 2024 |
USD 1.51 Billion |
| Curved Television Market, CAGR |
5.9% |
| Curved Television Market Size 2032 |
USD 2.39 Billion |
The Curved Television market is dominated by leading companies such as Samsung Electronics, LG Electronics, Sony Corporation, Haier Electronics Group, Sichuan Changhong Electric Co. Ltd., Panasonic Corporation, Hisense Group, TCL Technology, Sharp Corporation, and Vizio Inc. These players focus on advanced OLED and QLED display technologies, 4K–8K resolution, and smart connectivity to enhance user experience. North America led the global market with a 34% share in 2024, supported by high consumer spending and adoption of premium home entertainment systems. Europe followed with 27%, while Asia-Pacific held 29%, driven by large-scale manufacturing and rising middle-class demand for smart, high-definition televisions.
Access crucial information at unmatched prices!
Request your sample report today & start making informed decisions powered by Credence Research Inc.!
Download Sample
Market Insights
- The Curved Television market was valued at USD 1.51 billion in 2024 and is projected to reach USD 2.39 billion by 2032, growing at a CAGR of 5.9%.
- Growth is driven by rising consumer demand for immersive viewing experiences and increasing adoption of OLED and QLED screens in smart homes.
- Key trends include integration of AI-based display enhancement, 4K–8K resolution adoption, and expansion of online retail distribution channels.
- Major players such as Samsung Electronics, LG Electronics, and Sony Corporation dominate through innovation, product diversification, and global brand positioning.
- North America leads with a 34% share, followed by Asia-Pacific with 29% and Europe with 27%, while the 55–65 inches screen segment holds 44% share, supported by strong residential adoption and premium content availability.
Market Segmentation Analysis:
By Screen Size
The 55–65 inches segment dominated the Curved Television market in 2024 with a 44% share. Consumers prefer this size range as it offers an ideal balance between immersive viewing and affordability. Growing adoption in residential spaces and demand for premium entertainment experiences drive this segment’s growth. Below 55 inches TVs remain popular for compact households, while above 65 inches screens gain traction among high-end users and commercial installations due to superior picture quality and enhanced viewing angles supported by advanced OLED and QLED technologies.
- For instance, Samsung Electronics introduced its 65-inch S95C QD-OLED model featuring a 0.4-inch thin Infinity One design, a high peak brightness (reaching over 1,300 nits in some HDR scenes), and a 144 Hz refresh rate for smooth gaming on compatible PCs. The flat display delivers virtually limitless contrast with self-illuminating pixels.
By Screen Type
The OLED segment held the largest market share of 46% in 2024, driven by its superior contrast ratio, energy efficiency, and thinner display design. OLED technology provides deeper blacks and vibrant colors, enhancing the viewing experience for curved screens. LED and QLED models continue to expand their presence due to affordability and long lifespan. Manufacturers are investing in OLED advancements to meet rising consumer demand for high-end home entertainment systems and to maintain competitiveness in the premium display market.
- For instance, LG Electronics launched its 42-inch OLED Flex LX3, capable of bending up to a 900R curvature through motorized adjustment. The screen offers 20 curvature levels and achieves a 0.1 ms response time with a 120 Hz refresh rate. The model integrates α9 Gen 5 AI processor and Dolby Vision Gaming for optimized contrast and motion precision.
By Resolution
The 4K UHD segment led the Curved Television market in 2024 with a 57% share. Increasing adoption of 4K content and growing availability of streaming platforms like Netflix and Amazon Prime boost demand. 4K TVs offer sharper visuals and improved depth perception, making them ideal for curved displays. Full HD remains relevant in budget categories, while 8K UHD is gaining momentum in luxury home theaters. Technological innovations and falling panel costs are expected to make ultra-high-definition curved TVs more accessible in coming years.
Key Growth Drivers
Rising Demand for Immersive Viewing Experience
increasingly prefer curved televisions for their panoramic viewing effect and enhanced depth perception. The curvature of the screen delivers a more engaging visual experience, especially in larger displays. This demand is further driven by the rise of home entertainment systems and premium cinematic experiences. Manufacturers focus on improving display curvature and screen uniformity to boost visual comfort and immersion, making curved TVs a preferred choice for high-definition content and next-generation gaming environments.
- For instance, Sony Corporation’s BRAVIA XR A95L features a 65-inch QD-OLED panel with a peak brightness of around 1,500 nits and XR Triluminos Max technology. The television uses a Cognitive Processor XR that cross-analyzes image elements to enhance depth perception.
Technological Advancements in Display Panels
Rapid progress in OLED, QLED, and LED technologies is driving innovation in curved televisions. These panels offer superior contrast, energy efficiency, and color precision compared to traditional displays. Manufacturers are integrating AI-based upscaling, HDR optimization, and adaptive brightness features to enhance performance. Improved manufacturing efficiency and reduced production costs are making advanced curved TVs more accessible. These advancements are expanding adoption across both residential and commercial sectors, particularly in developed markets with strong smart home penetration.
- For instance, TCL Technology introduced its QD-Mini LED 4K display incorporating over 2,300 local dimming zones and 5,000 nits of peak brightness. The TV integrates AiPQ 3.0 processing that adjusts image tone and brightness dynamically across more than 1 million scenes.
Growth of Smart and Connected Devices
Integration of smart features like voice assistants, IoT connectivity, and streaming platforms is fueling market growth. Consumers favor curved televisions with built-in Wi-Fi, Bluetooth, and compatibility with smart ecosystems. This shift aligns with the global trend toward connected living and seamless entertainment integration. Curved smart TVs also support cloud gaming, 4K streaming, and AI-based recommendations, enhancing user engagement and satisfaction. The convergence of smart technologies with high-quality curved displays strengthens the market’s appeal among tech-savvy consumers.
Key Trends & Opportunities
Adoption of 4K and 8K Content
Rising availability of ultra-high-definition content on streaming services and gaming platforms drives 4K and 8K curved TV demand. Enhanced resolution improves viewing realism, especially on large, curved screens. Manufacturers are investing in panels capable of supporting higher refresh rates and HDR features. As content producers continue creating ultra-HD material, the compatibility of curved TVs with advanced formats positions them as a prime choice for home theaters and premium entertainment enthusiasts.
- For instance, Hisense Group unveiled its 110-inch ULED X display platform, which features a mini-LED panel with over 40,000 backlight zones, 10,000 nits of peak brightness, and a 16-bit light control algorithm that processes over 65,000 brightness levels for precise contrast handling.
Expansion of E-Commerce and Online Retail
Online retail channels present strong growth opportunities for curved television manufacturers. Consumers increasingly prefer online platforms for price comparison, discounts, and easy delivery options. E-commerce giants are promoting exclusive model launches and bundling offers, boosting sales. Digital marketing and virtual product demonstrations further enhance consumer engagement. As online penetration increases in emerging markets, manufacturers are optimizing their distribution strategies to target tech-oriented buyers through direct-to-consumer sales models.
- For instance, Haier has formed strategic partnerships with JD.com to sell its products online and utilizes AI in its customer service operations. In 2023, Haier and JD.com launched a “Green Trade-in Alliance”. Haier’s own website details its use of AI for customer service and its expansion into smart home appliances with partners, emphasizing customer-centric technology and connected living.
Key Challenges
High Product Costs and Limited Accessibility
Curved televisions remain more expensive than flat-panel alternatives due to advanced display technology and complex manufacturing. High costs restrict adoption in price-sensitive markets. Consumers often perceive limited value differentiation between curved and flat TVs, reducing purchase intent. Manufacturers face challenges balancing innovation with affordability, particularly in mid-range product lines. Expanding cost-effective production and introducing flexible pricing models will be essential for broader market penetration.
Viewing Angle and Placement Limitations
Curved TVs offer optimal visuals only when viewed from the center, limiting flexibility in large or shared viewing spaces. Off-angle viewers may experience image distortion or reduced brightness, especially in non-OLED models. These constraints affect adoption in commercial and multi-user environments. Manufacturers are working on improving curvature balance and display uniformity, but achieving consistent visual quality across viewing angles remains a technical hurdle for mass acceptance.
Regional Analysis
North America
North America held a 34% share of the Curved Television market in 2024. The region’s dominance is driven by high consumer spending on premium home entertainment and early adoption of advanced display technologies. Strong sales in the U.S. and Canada are supported by leading brands such as Samsung, LG, and Sony, which continue to introduce innovative OLED and QLED curved models. Growth is further supported by widespread availability of 4K and 8K content through streaming platforms, as well as expanding integration of smart features and voice-controlled devices in home entertainment systems.
Europe
Europe accounted for 27% of the Curved Television market in 2024. The region benefits from rising demand for luxury electronics and growing adoption of energy-efficient OLED and QLED screens. The U.K., Germany, and France are major contributors, with consumers showing strong preference for immersive viewing experiences. Manufacturers emphasize sustainable design and premium aesthetics to align with regional regulations and eco-conscious consumer trends. Increased investments in smart home technology and the proliferation of ultra-HD content further drive adoption across the European market.
Asia-Pacific
Asia-Pacific captured a 29% share of the Curved Television market in 2024, led by China, Japan, South Korea, and India. The region’s strong manufacturing base and rapid digitalization support market growth. Expanding middle-class income, rising urbanization, and greater availability of smart TVs at competitive prices enhance adoption rates. Major companies like Samsung, LG, and TCL drive innovation with localized product offerings and high-resolution display technologies. Increasing demand for home entertainment systems and e-commerce expansion also contribute significantly to the region’s robust growth trajectory.
Latin America
Latin America held a 6% share of the Curved Television market in 2024. Growth is supported by rising consumer interest in modern home entertainment systems and increasing internet penetration. Brazil and Mexico dominate regional sales, driven by expanding retail networks and growing middle-class demand for smart, large-screen TVs. However, economic fluctuations and high product costs limit mass adoption. Manufacturers are focusing on affordable models and online sales strategies to capture demand from urban households seeking advanced viewing experiences at lower price points.
Middle East & Africa
The Middle East & Africa region accounted for a 4% share of the Curved Television market in 2024. The demand is fueled by luxury housing projects, rising disposable income, and adoption of high-end consumer electronics in countries such as the UAE, Saudi Arabia, and South Africa. Growing penetration of e-commerce platforms and increasing exposure to global entertainment trends also support sales. However, limited availability of high-resolution content and higher import costs pose challenges. Global brands are expanding distribution partnerships to strengthen their presence in this emerging market.
Market Segmentations:
By Screen Size
- Below 55 Inches
- 55–65 Inches
- Above 65 Inches
By Screen Type
By Resolution
By Application
By Geography
- North America
- Europe
- Germany
- France
- U.K.
- Italy
- Spain
- Rest of Europe
- Asia Pacific
- China
- Japan
- India
- South Korea
- South-east Asia
- Rest of Asia Pacific
- Latin America
- Brazil
- Argentina
- Rest of Latin America
- Middle East & Africa
- GCC Countries
- South Africa
- Rest of the Middle East and Africa
Competitive Landscape
The competitive landscape of the Curved Television market includes key players such as Samsung Electronics, Haier Electronics Group, Sony Corporation, Sichuan Changhong Electric Co. Ltd., LG Electronics, Panasonic Corporation, Hisense Group, TCL Technology, Sharp Corporation, and Vizio Inc. These companies focus on innovation in display technologies, offering advanced OLED, QLED, and LED curved televisions with superior resolution and smart connectivity features. Samsung and LG lead the market with strong global distribution networks and consistent product upgrades. Manufacturers are emphasizing AI-based picture enhancement, energy-efficient designs, and integration with smart home ecosystems. Strategic collaborations with content providers and e-commerce platforms are enhancing brand visibility and customer reach. Competitive pricing, product differentiation, and expansion in emerging markets remain key strategies driving growth and market consolidation among these leading curved television manufacturers.
Shape Your Report to Specific Countries or Regions & Enjoy 30% Off!
Key Player Analysis
Recent Developments
- In January 2025, Panasonic Corporation introduced its flagship Z95B series OLED TVs, featuring a next-generation Primary RGB Tandem Panel and a revolutionary ThermalFlow aerodynamic cooling system for enhanced brightness, contrast, and color volume, along with redesigned audio and integrated Fire TV capabilities.
- In 2025, Samsung Electronics unveiled its new lineup of curved and OLED televisions under the S95F, S90F, and S85F series, integrating Vision AI technology, upgraded 165 Hz refresh rates, and enhanced Glare-Free 2.0 panels for immersive curved-view experiences.
- In 2025, LG Electronics announced a new generation of flat OLED TVs within its Signature G5 series, highlighting ultra-slim form factors, 4K 165 Hz refresh rate, and AI-driven picture calibration using its α11 processor for high-end viewing environments.
Report Coverage
The research report offers an in-depth analysis based on Screen Size, Screen Type, Resolution, Application and Geography. It details leading market players, providing an overview of their business, product offerings, investments, revenue streams, and key applications. Additionally, the report includes insights into the competitive environment, SWOT analysis, current market trends, as well as the primary drivers and constraints. Furthermore, it discusses various factors that have driven market expansion in recent years. The report also explores market dynamics, regulatory scenarios, and technological advancements that are shaping the industry. It assesses the impact of external factors and global economic changes on market growth. Lastly, it provides strategic recommendations for new entrants and established companies to navigate the complexities of the market.
Future Outlook
- Demand for curved televisions will rise with growing preference for immersive home entertainment.
- Integration of AI and IoT features will enhance smart functionality and user experience.
- OLED and QLED technologies will continue to dominate due to superior picture quality.
- 4K and 8K content expansion will drive higher adoption of large curved screens.
- Online retail and e-commerce platforms will play a key role in market growth.
- Manufacturers will focus on energy-efficient and eco-friendly display production.
- Price reductions and product diversification will increase accessibility in emerging markets.
- Collaboration with streaming service providers will boost consumer engagement.
- Asia-Pacific will witness strong demand growth supported by rapid digitalization.
- Continuous innovation in design and screen curvature will strengthen brand competitiveness.


