| REPORT ATTRIBUTE |
DETAILS |
| Historical Period |
2020-2023 |
| Base Year |
2024 |
| Forecast Period |
2025-2032 |
| United States 3D Cell Culture Market Size 2024 |
USD 349.89 Million |
| United States 3D Cell Culture Market, CAGR |
11.31% |
| United States 3D Cell Culture Market Size 2032 |
USD 917.53 Million |
Market Overview
United States 3D Cell Culture Market size was valued at USD 349.89 million in 2023 and is anticipated to reach USD 917.53 million by 2032, at a CAGR of 11.31% during the forecast period (2023-2032).
The United States 3D cell culture market is experiencing significant growth driven by the rising demand for more physiologically relevant in vitro models in drug discovery and cancer research. The limitations of traditional 2D cultures in accurately mimicking the in vivo environment have accelerated the shift towards 3D cell culture systems, which offer enhanced cell-to-cell and cell-to-matrix interactions. Increased funding for regenerative medicine, stem cell research, and personalized medicine further supports market expansion. Additionally, pharmaceutical companies and research institutions are increasingly adopting 3D cell culture platforms to reduce drug development costs and improve clinical outcomes. Market trends also reflect a growing preference for scaffold-based and organoid-based models due to their high reproducibility and ability to simulate complex tissue structures. Technological advancements, including microfluidics and bioprinting, are further enhancing the capabilities of 3D cultures, positioning them as essential tools in preclinical testing and disease modeling across the U.S. biomedical landscape.
The United States 3D cell culture market exhibits strong regional growth across the Western, Midwestern, Southern, and Northeastern states, supported by a robust research infrastructure, advanced biopharmaceutical manufacturing, and growing adoption of innovative cell culture technologies. The Western region leads due to the presence of major biotechnology hubs and high R&D activity, while the Midwest and South are gaining momentum through increased investment in regenerative medicine and preclinical research. The Northeast remains a vital contributor, driven by academic excellence and collaborations with leading pharmaceutical companies. Key players actively shaping the market include Thermo Fisher Scientific, Inc., Merck KGaA, Corning Incorporated, Lonza, Tecan Trading AG, Avantor, Inc., Reprocell Inc., 3D Biotek LLC, Emulate, Inc., and Synthecon, Incorporated. These companies are focusing on expanding their product portfolios, enhancing strategic partnerships, and leveraging technological advancements to support innovation and address the growing demand for physiologically relevant 3D cell culture models across various biomedical applications.
Access crucial information at unmatched prices!
Request your sample report today & start making informed decisions powered by Credence Research Inc.!
Download Sample
Market Insights
- The United States 3D cell culture market was valued at USD 349.89 million in 2023 and is expected to reach USD 917.53 million by 2032, growing at a CAGR of 11.31%.
- The global 3D cell culture market was valued at USD 1,200.00 million in 2023 and is projected to reach USD 3,119.78 million by 2032, growing at a CAGR of 11.20% during the forecast period.
- Increasing demand for alternatives to animal testing and advancements in personalized medicine are driving market growth.
- Rising adoption of organoids, spheroids, and organ-on-a-chip technologies reflects key industry trends toward more predictive and human-relevant models.
- Key players such as Thermo Fisher Scientific, Corning Incorporated, and Lonza are focusing on innovation, strategic partnerships, and portfolio expansion to strengthen their market position.
- High initial setup costs and lack of standardization in 3D cell culture systems are acting as restraints to market expansion.
- The Western United States leads in adoption due to a strong biotech presence, while other regions are rapidly developing their research and commercial capabilities.
- The market is gaining momentum through support from academic institutions, regulatory agencies, and private sector investments.
Report Scope
This report segments the United States 3D Cell Culture Market as follows:
Market Drivers
Rising Demand for Physiologically Relevant Models in Drug Discovery
One of the primary drivers fueling the growth of the United States 3D cell culture market is the increasing demand for physiologically relevant in vitro models in drug discovery and development. Traditional 2D cell culture techniques often fail to replicate the complexity of human tissues, leading to limited predictive accuracy in preclinical testing. In contrast, 3D cell cultures closely mimic the in vivo microenvironment, allowing for better representation of tissue-specific architecture, cellular interactions, and drug response. As a result, pharmaceutical and biotechnology companies are increasingly turning to 3D models to enhance the reliability of drug screening, reduce late-stage clinical trial failures, and accelerate time-to-market for new therapeutics.
Technological Advancements Enhancing Model Accuracy
Technological innovation plays a crucial role in driving the adoption of 3D cell culture systems across various research and clinical settings. Advanced techniques such as bioprinting, microfluidics, and scaffold engineering have significantly improved the structural and functional accuracy of 3D models. For instance, the NIH has invested in microfluidic systems to enhance nutrient supply and waste removal in 3D cultures, improving experimental reliability. Additionally, pharmaceutical companies are integrating automation and high-throughput screening (HTS) capabilities into 3D culture workflows, streamlining processes and making the technology more scalable and accessible.
Rising Focus on Personalized Medicine and Toxicity Testing
The growing emphasis on personalized medicine and precision therapeutics is further boosting the demand for 3D cell culture platforms in the U.S. Healthcare providers and researchers are increasingly looking for tools that can simulate individual patient responses to therapies, which is where patient-derived 3D cell models play a vital role. For instance, the FDA has encouraged the use of patient-specific 3D models in toxicity testing to reduce reliance on animal models and improve ethical research practices. Similarly, the NIH has supported initiatives to develop customized 3D cell culture systems for precision medicine applications, enabling tailored treatment strategies.
Growing Investments in Cancer and Stem Cell Research
Substantial investment in cancer and stem cell research is another major driver propelling the 3D cell culture market in the U.S. Cancer remains one of the leading causes of mortality in the country, prompting both government bodies and private organizations to increase funding for oncology research. 3D cell cultures, such as spheroids and organoids, have proven to be highly effective in modeling tumor growth, metastasis, and response to treatment. Similarly, stem cell-based 3D culture models are gaining momentum for their applications in regenerative medicine, including tissue engineering and organ regeneration. The availability of grants and support from institutions like the National Institutes of Health (NIH) has further encouraged the adoption of 3D culture systems in advanced medical research.
Market Trends
Shift Toward Organoid and Spheroid-Based Models
A significant trend in the United States 3D cell culture market is the growing preference for organoid and spheroid-based models. These systems offer superior structural and functional mimicry of in vivo tissues compared to traditional 2D cultures, enabling researchers to study complex biological processes more accurately. For instance, the National Cancer Institute (NCI) has funded research projects utilizing organoids derived from stem cells to study tumor behavior and drug responses, advancing personalized medicine applications. Additionally, the U.S. Department of Health and Human Services (HHS) has supported initiatives to expand the use of spheroid models in preclinical studies, particularly for evaluating drug penetration and resistance mechanisms.
Integration of Bioprinting and Microfluidics
The integration of cutting-edge technologies such as bioprinting and microfluidics is reshaping the 3D cell culture landscape in the United States. Bioprinting enables the precise construction of complex tissue structures using bio-inks that contain living cells, allowing for high levels of customization and reproducibility in tissue models. For instance, the National Institutes of Health (NIH) has invested in microfluidic systems to simulate dynamic physiological conditions, improving experimental reliability and functional capabilities of 3D cultures. Similarly, collaborations between academic institutions and biotech companies have led to the commercialization of lab-on-a-chip devices for high-throughput screening, enabling simultaneous testing of multiple variables in compact setups.
Increased Adoption in Preclinical and Toxicology Testing
Another prominent trend is the increasing adoption of 3D cell culture systems in preclinical and toxicology testing. Regulatory agencies and pharmaceutical companies are increasingly recognizing the limitations of animal models and the need for alternative methods that provide more human-relevant data. 3D cultures are now being incorporated into early-stage drug testing protocols to assess efficacy, metabolism, and toxicity. These models reduce reliance on animal testing and offer quicker, more ethical, and cost-effective solutions. As the regulatory environment becomes more supportive of such alternatives, the demand for validated 3D cell culture platforms in toxicology and safety testing continues to grow across the U.S. research ecosystem.
Expansion of Personalized Medicine Applications
The expansion of personalized medicine is also driving notable trends within the 3D cell culture market. Researchers are increasingly utilizing patient-derived cells to develop customized 3D tissue models for individualized drug screening and therapeutic testing. These models enable clinicians to predict patient-specific treatment responses more effectively, which supports the development of precision therapies. With the rise in chronic diseases, cancer, and genetic disorders, demand for personalized approaches is escalating. This shift aligns with broader healthcare initiatives focusing on targeted, data-driven treatments, and positions 3D cell culture systems as a critical enabler of innovation in precision medicine across the U.S. healthcare landscape.
Market Challenges Analysis
High Cost and Technical Complexity of 3D Culture Systems
One of the primary challenges restraining the growth of the United States 3D cell culture market is the high cost and technical complexity associated with these systems. Compared to conventional 2D cultures, 3D cell culture technologies require advanced materials, specialized equipment, and skilled personnel for successful implementation. The development and maintenance of scaffold-based models, organoids, and bioprinted tissues often demand significant investment in infrastructure and training. Additionally, standardized protocols for 3D cultures are still lacking, resulting in variability and inconsistencies in experimental outcomes across different laboratories. These factors can hinder widespread adoption, particularly among smaller research facilities and academic institutions with limited resources. The need for more cost-effective, user-friendly platforms remains a pressing concern that could otherwise delay the broader integration of 3D cell culture in routine research workflows.
Limited Standardization and Regulatory Validation
Another significant challenge in the U.S. 3D cell culture market is the limited standardization and regulatory validation of these models for clinical and commercial applications. While 3D cultures offer superior biological relevance, their acceptance by regulatory authorities such as the FDA remains cautious due to the lack of universally accepted validation protocols. For instance, the FDA has called for the development of harmonized guidelines to ensure consistency in 3D cell culture methodologies and data interpretation, particularly for drug development and toxicity testing. This uncertainty can slow down the integration of 3D cell cultures in drug development pipelines and toxicology testing, where regulatory compliance is critical. Furthermore, the variability in model construction and interpretation of results poses difficulties in reproducing data across different studies, raising concerns about reliability and scalability. Without clear regulatory frameworks and standardized methodologies, the transition from exploratory research to industrial-scale application faces ongoing hurdles. Addressing these issues will be essential to unlocking the full potential of 3D cell culture systems in the United States.
Market Opportunities
The United States 3D cell culture market presents significant growth opportunities driven by the increasing focus on personalized medicine and the rising need for alternatives to animal testing. As healthcare systems continue to shift toward individualized treatment approaches, 3D cell cultures offer immense potential in modeling patient-specific responses to therapies. This is particularly valuable in oncology and genetic disorders, where patient-derived organoids and spheroids can replicate disease progression and drug sensitivity in a controlled environment. These advancements not only improve treatment outcomes but also support the development of more targeted and effective drugs. Moreover, the growing support from regulatory agencies and research institutions for innovative, non-animal testing methodologies has opened new avenues for the adoption of 3D cultures in preclinical studies. This trend aligns with the increasing demand for ethical and reliable testing platforms, positioning 3D cell cultures as a crucial component of the future biomedical research landscape.
In addition, the integration of artificial intelligence, machine learning, and automation technologies with 3D cell culture systems is unlocking new possibilities for high-throughput drug screening and data analysis. These advancements enable researchers to process large volumes of data with greater speed and precision, significantly reducing the time and cost involved in drug development. The development of lab-on-a-chip platforms and organ-on-chip models further supports this evolution, allowing real-time monitoring of cellular responses under dynamic physiological conditions. As biopharmaceutical companies and academic institutions continue to invest in innovative research tools, the demand for advanced 3D cell culture solutions is expected to rise. Collaborations between industry players, research organizations, and technology providers are also fostering innovation, making the market increasingly attractive for both established companies and new entrants. This dynamic ecosystem creates a favorable environment for sustained growth and long-term investment in the U.S. 3D cell culture market.
Market Segmentation Analysis:
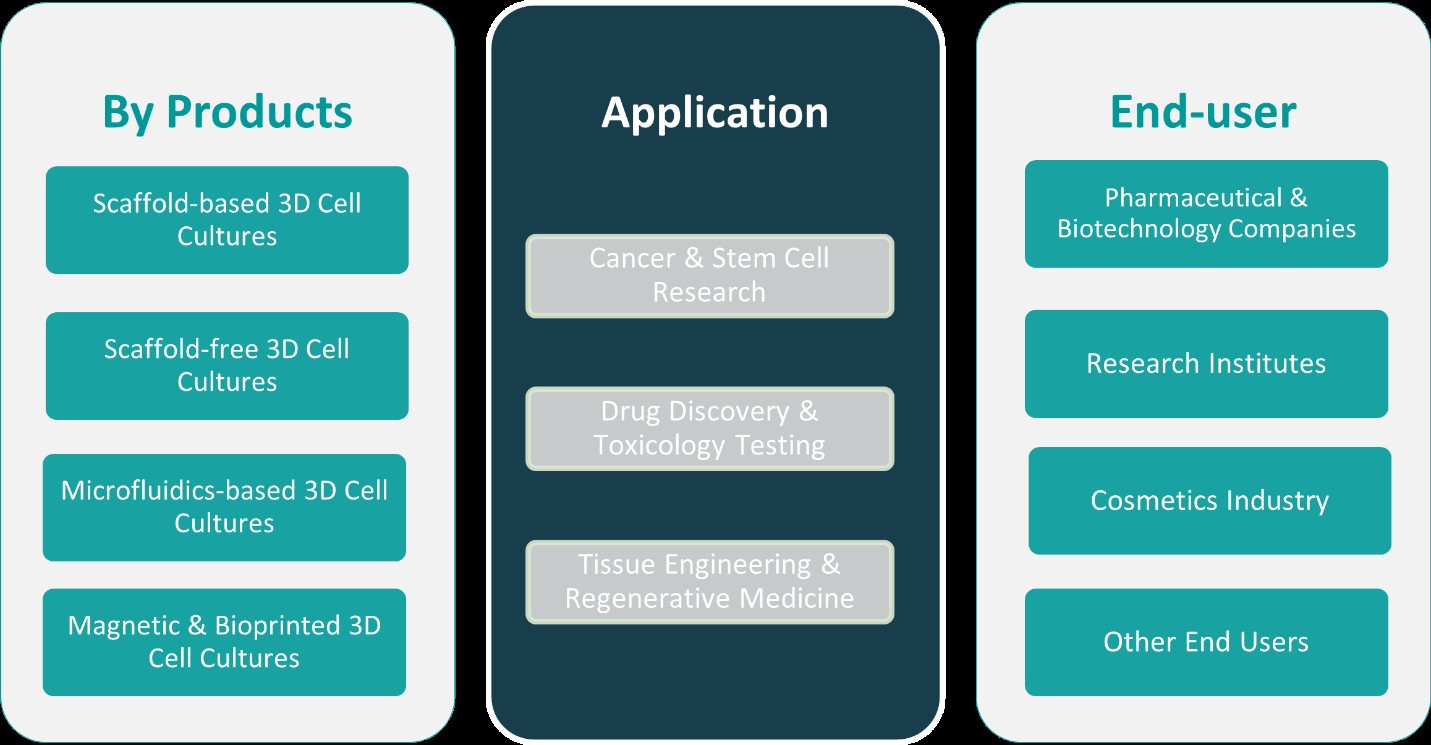
By Products:
The United States 3D cell culture market is segmented by product type into scaffold-based, scaffold-free, microfluidics-based, and magnetic & bioprinted 3D cell cultures. Among these, scaffold-based 3D cell cultures currently dominate the market due to their extensive application in replicating tissue-like structures that closely mimic the in vivo environment. These systems use hydrogels, polymers, and other biomaterials to support cell attachment and growth. Scaffold-free cultures, such as spheroids and organoids, are rapidly gaining traction as they eliminate the need for external materials and allow cells to self-assemble, offering more natural cell-cell interactions. Microfluidics-based 3D cultures, though in a nascent stage, are showing immense promise for simulating organ-level functions and supporting dynamic cell environments, particularly in organ-on-a-chip applications. Meanwhile, magnetic and bioprinted 3D cell cultures are emerging segments, propelled by advancements in tissue engineering and customization of complex tissue structures. Continued innovation across these categories is expanding the usability of 3D culture technologies in research and therapeutic applications.
By Application:
Based on application, the U.S. 3D cell culture market is segmented into cancer and stem cell research, drug discovery and toxicology testing, and tissue engineering and regenerative medicine. Cancer and stem cell research currently lead the market due to the high demand for accurate tumor models and stem cell-derived tissue systems. 3D cultures enable more representative models of tumor microenvironments, enhancing the evaluation of therapeutic efficacy and resistance. Drug discovery and toxicology testing also account for a significant share, as pharmaceutical companies increasingly adopt 3D cultures to obtain more predictive, human-relevant data during preclinical screening. These models help reduce reliance on animal testing and improve the translation of findings to clinical trials. Additionally, tissue engineering and regenerative medicine are emerging as high-growth segments driven by rising interest in developing lab-grown organs, tissue scaffolds, and personalized implants. The combination of these application areas is fueling innovation and solidifying the role of 3D cell culture as a transformative tool in the U.S. life sciences industry.
Segments:
Based on Products:
- Scaffold-based 3D Cell Cultures
- Scaffold-free 3D Cell Cultures
- Microfluidics-based 3D Cell Cultures
- Magnetic & Bioprinted 3D Cell Cultures
Based on Application:
- Cancer & Stem Cell Research
- Drug Discovery & Toxicology Testing
- Tissue Engineering & Regenerative Medicine
Based on End- User:
- Pharmaceutical & Biotechnology Companies
- Research Institutes
- Cosmetics Industry
- Other End Users
Based on the Geography:
- Western United States
- Midwestern United States
- Southern United States
- Northeastern United States
Regional Analysis
Western United States
The Western United States holds the largest market share in the U.S. 3D cell culture market, accounting for approximately 36% in 2023. This dominance is primarily attributed to the presence of prominent biotechnology clusters in California, including Silicon Valley and the San Diego Biotech Hub, which house several leading pharmaceutical and research institutions. The region benefits from a robust innovation ecosystem supported by venture capital investments, world-class academic centers like Stanford and UC San Francisco, and a strong focus on translational research. These factors contribute to the early adoption of advanced technologies such as organoids, bioprinting, and organ-on-chip systems. Additionally, partnerships between tech companies and life sciences organizations are accelerating product development and commercialization, strengthening the region’s leadership in the 3D cell culture domain.
Midwestern United States
The Midwestern United States captures a market share of approximately 24%, driven by the region’s established pharmaceutical manufacturing base and active participation in biomedical research. States such as Illinois, Ohio, and Michigan have seen significant investment in life sciences infrastructure, particularly in regenerative medicine and toxicology testing. Renowned institutions like the University of Michigan and the Mayo Clinic are increasingly incorporating 3D cell culture systems into their research programs. Moreover, public and private initiatives aimed at revitalizing healthcare innovation in the Midwest are fostering favorable conditions for emerging biotechnology firms. The region’s cost-effective operations and growing number of clinical trials also contribute to increased demand for 3D culture technologies, particularly in preclinical evaluation and safety assessments.
Southern United States
The Southern United States holds a market share of about 21%, reflecting steady growth supported by a rising concentration of biotech startups, research universities, and contract research organizations (CROs). Texas and North Carolina, in particular, have emerged as regional hotspots, with major investments flowing into medical research and biomanufacturing capabilities. The region’s supportive regulatory environment and access to skilled professionals are further accelerating the adoption of 3D cell culture in cancer research, stem cell studies, and tissue engineering. Additionally, government-backed innovation hubs and academic-industrial collaborations are creating a vibrant ecosystem for biotech advancement, gradually elevating the South’s position in the national market landscape.
Northeastern United States
The Northeastern United States represents approximately 19% of the U.S. 3D cell culture market. Despite holding the smallest share among the regions, the Northeast remains a key contributor due to its rich concentration of Ivy League universities, biomedical research centers, and pharmaceutical giants. Massachusetts and New York lead the region with strong research funding, clinical trial activity, and collaborations between academia and industry. Institutions such as Harvard, MIT, and Columbia University are at the forefront of exploring 3D culture applications in regenerative medicine and drug discovery. While space and cost constraints may limit large-scale manufacturing, the region continues to influence market dynamics through high-impact research, pilot studies, and policy leadership.
Key Player Analysis
- Thermo Fisher Scientific, Inc.
- Merck KGaA
- Corning Incorporated
- Lonza
- Tecan Trading AG
- Avantor, Inc.
- Reprocell Inc.
- 3D Biotek LLC
- Emulate, Inc.
- Synthecon, Incorporated
Competitive Analysis
The competitive landscape of the United States 3D cell culture market is characterized by the presence of several established players focused on innovation, strategic collaborations, and product development to maintain their market position. Leading companies such as Thermo Fisher Scientific, Inc., Merck KGaA, Corning Incorporated, Lonza, Tecan Trading AG, Avantor, Inc., Reprocell Inc., 3D Biotek LLC, Emulate, Inc., and Synthecon, Incorporated are playing a pivotal role in shaping market dynamics. These firms are investing heavily in research and development to offer advanced 3D culture technologies, including scaffold-based systems, microfluidics platforms, and bioprinting solutions. Strategic partnerships with academic institutions and biotech startups have also become common, helping these players tap into novel applications and expand their reach. Furthermore, companies are enhancing their product portfolios to meet the growing demand for efficient and scalable 3D cell culture solutions in cancer research, regenerative medicine, and drug discovery. With the growing shift toward personalized medicine and predictive modeling, these market leaders are positioning themselves at the forefront of innovation, leveraging their technical expertise and distribution networks to gain a competitive edge. Their continued efforts are expected to influence the market’s development and adoption rate over the coming years.
Recent Developments
- In April 2025, Lonza implemented a streamlined operating model to enhance its multimodality offerings, including cell and gene technologies.
- In February 2025, Reprocell’s StemRNA™ Clinical Seed iPSCs were utilized in a Phase 3 trial for Gameto’s Fertilo therapy.
- In March 2025, Avantor expanded its European manufacturing site to quadruple capacity for hydration solutions essential for cell culture media.
- In January 2025, Merck completed the acquisition of HUB Organoids Holding B.V., enhancing its portfolio with organoid technologies to improve drug development processes by providing earlier drug response data.
- In January 2025, Corning showcased its latest advancements in 3D cell culture, including spheroids and organoids, at the SLAS2025 conference.
Market Concentration & Characteristics
The United States 3D cell culture market demonstrates a moderately concentrated landscape, with a few dominant players holding significant influence due to their extensive product portfolios, advanced technologies, and established distribution networks. The market is characterized by high entry barriers, including the need for specialized expertise, substantial R&D investment, and compliance with stringent regulatory standards. Leading companies continue to shape market dynamics through innovation, strategic partnerships, and acquisitions, creating a competitive yet collaborative environment. The industry places strong emphasis on technological advancement, particularly in scaffold design, organoid development, and microfluidic platforms, reflecting a shift toward more predictive, physiologically relevant in vitro models. Additionally, customer demand for personalized and scalable solutions is driving companies to offer more versatile, application-specific products. While emerging players are entering the space with niche innovations, the overall market remains competitive and innovation-driven, supported by consistent funding, academic collaborations, and growing demand from pharmaceutical and biotechnology sectors across the country.
Shape Your Report to Specific Countries or Regions & Enjoy 30% Off!
Report Coverage
The research report offers an in-depth analysis based on Products, Application, End-User and Geography. It details leading market players, providing an overview of their business, product offerings, investments, revenue streams, and key applications. Additionally, the report includes insights into the competitive environment, SWOT analysis, current market trends, as well as the primary drivers and constraints. Furthermore, it discusses various factors that have driven market expansion in recent years. The report also explores market dynamics, regulatory scenarios, and technological advancements that are shaping the industry. It assesses the impact of external factors and global economic changes on market growth. Lastly, it provides strategic recommendations for new entrants and established companies to navigate the complexities of the market.
Future Outlook
- Continued rapid growth is expected as advanced 3D culture systems become standard in drug discovery.
- Emphasis on personalized medicine drives the demand for patient-specific 3D models.
- Expansion in regenerative medicine and tissue engineering will further propel market growth.
- Strategic partnerships between academic institutions and industry players accelerate innovation.
- Technological advancements in microfluidics and bioprinting promise enhanced model accuracy.
- Increasing automation and high-throughput screening improve scalability and efficiency.
- Continuous R&D investments support the development of versatile and application-specific products.
- Market consolidation may occur as leading companies expand their influence through acquisitions.
- New market entrants will contribute niche innovations to specialized application segments.
- Favorable regulatory reforms and increased funding ensure sustained overall market adoption.


