
Market Overview
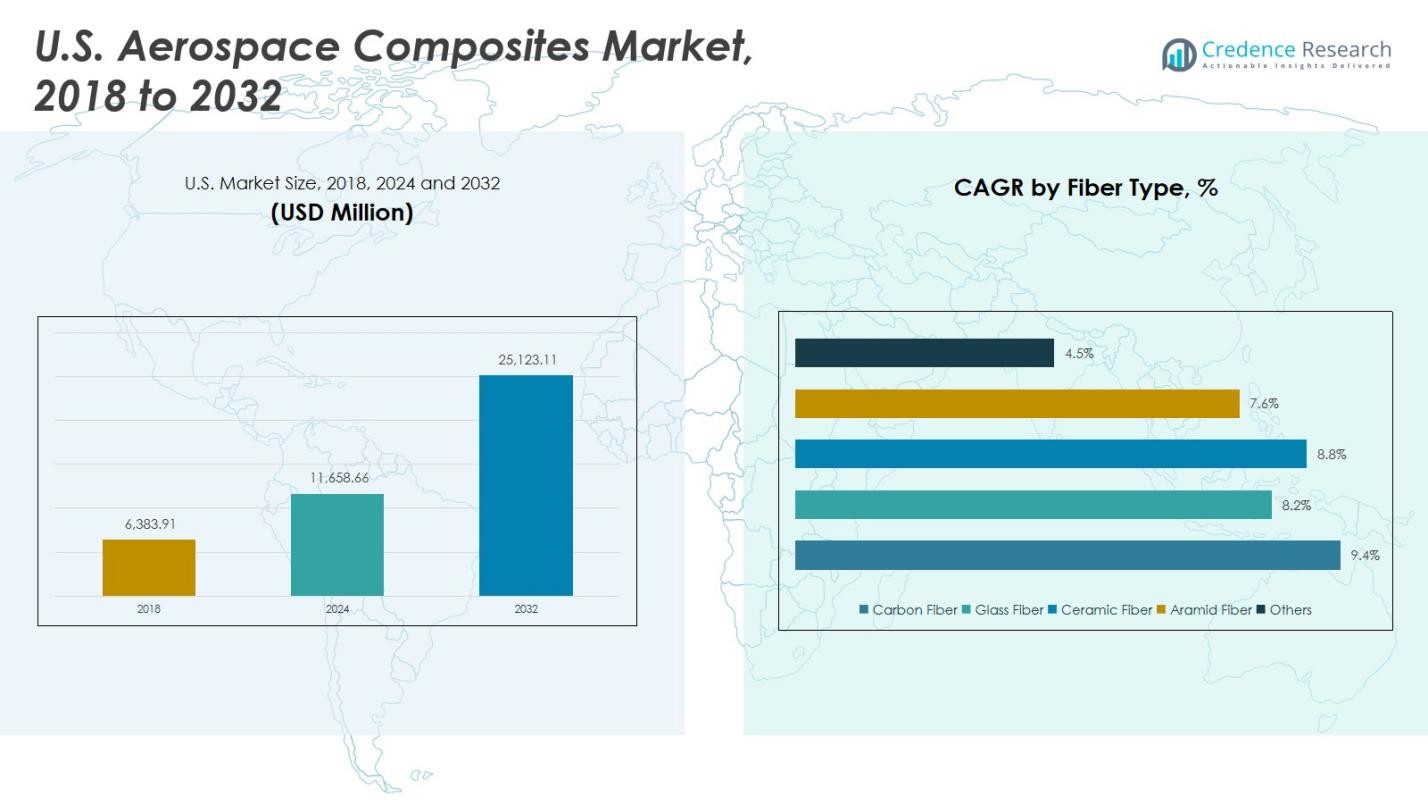
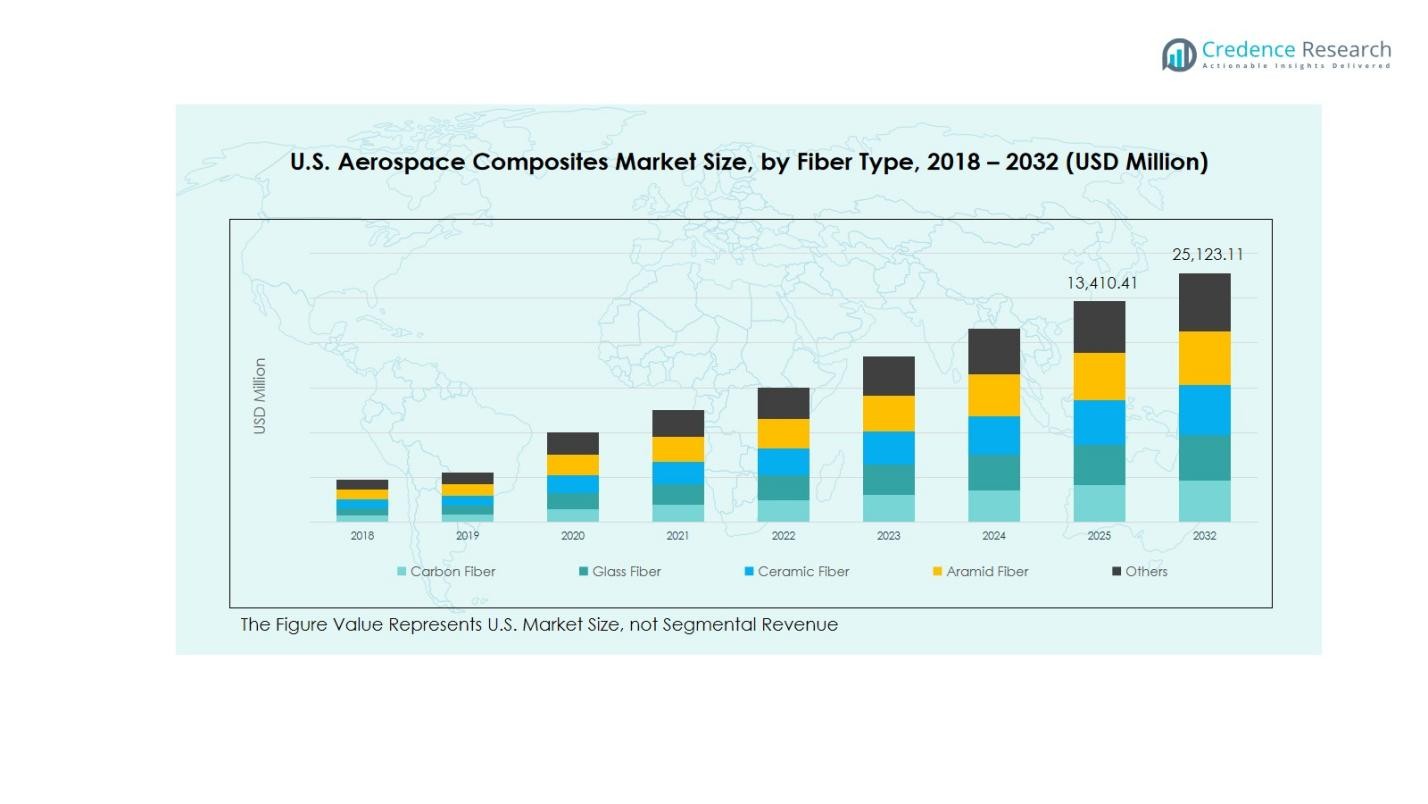
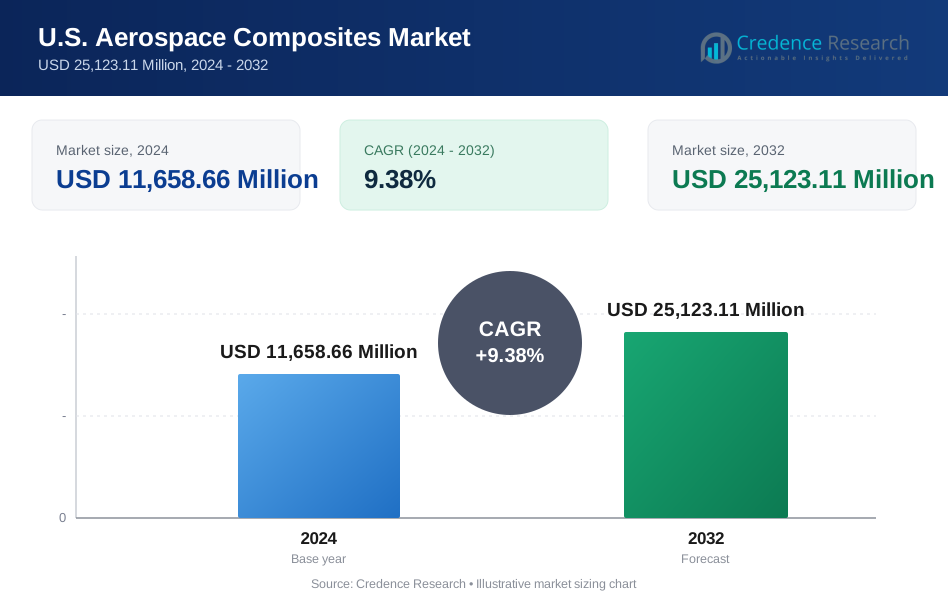
U.S Aerospace Composites Market size was valued at USD 6,383.91 Million in 2018, grew to USD 11,658.66 Million in 2024, and is anticipated to reach USD 25,123.11 Million by 2032, at a CAGR of 9.38% during the forecast period.| REPORT ATTRIBUTE | DETAILS |
|---|---|
| Historical Period | 2020-2023 |
| Base Year | 2024 |
| Forecast Period | 2025-2032 |
| U.S Aerospace Composites Market Size 2024 | USD 11,658.66 Million |
| U.S Aerospace Composites Market, CAGR | 9.38% |
| U.S Aerospace Composites Market Size 2032 | USD 25,123.11 Million |
The U.S. Aerospace Composites Market is dominated by key players such as Hexcel Corporation, Toray Industries, Teijin Limited, Solvay S.A., and Mitsubishi Chemical Corporation, which lead through innovation in high-performance carbon fiber, thermoset, and thermoplastic composites. These companies focus on strategic partnerships, R&D investments, and advanced manufacturing techniques to enhance production efficiency and meet stringent regulatory standards. Regionally, the South U.S. is the leading market, capturing a 35% share, driven by major commercial aircraft assembly facilities, defense contractors, and helicopter manufacturing units. The West U.S. follows with a 25% share, supported by aerospace clusters and space exploration programs, while the Northeast and Midwest hold 22% and 18% shares respectively, benefiting from strong R&D centers, skilled labor, and industrial infrastructure. The combined efforts of these players and strategic regional hubs continue to propel growth across commercial, military, and rotorcraft applications.
Market Insights
- The U.S. Aerospace Composites Market was valued at USD 11,658.66 Million in 2024 and is projected to reach USD 25,123.11 Million by 2032, growing at a CAGR of 9.38%. Carbon fiber leads the market with a 55% share, followed by glass fiber at 25%, while thermoset composites hold 65% of the resin type segment.
- Growth is driven by rising demand for lightweight aircraft, increasing commercial and military aircraft production, and technological advancements in high-performance fibers and resins.
- Key trends include the adoption of thermoplastic composites for faster manufacturing and recyclability, and integration of advanced aerostructures to improve fuel efficiency and reduce maintenance.
- The market is competitive, dominated by players like Hexcel Corporation, Toray Industries, Teijin Limited, Solvay S.A., and Mitsubishi Chemical Corporation, focusing on R&D, partnerships, and advanced manufacturing techniques.
- Regionally, the South U.S. leads with a 35% share, followed by the West (25%), Northeast (22%), and Midwest (18%), driven by major assembly facilities, aerospace clusters, and defense investments.
Market Segmentation Analysis:
By Fiber Type:
The U.S. aerospace composites market by fiber type is led by carbon fiber, commanding 55% market share due to its superior strength-to-weight ratio and high stiffness, which are critical for fuel efficiency and performance in modern aircraft. Glass fiber follows with around 25% share, valued for cost-effectiveness and corrosion resistance. Ceramic fibers and aramid fibers cater to niche applications such as thermal protection and impact resistance, while the others category holds roughly 5% share. Growth is driven by rising commercial aircraft production and adoption of lightweight materials in defense and rotorcraft segments.
For instance, Ceramic fibers serve niche roles in thermal protection, with materials like silicon carbide and zirconium diboride used in aerospace thermal barrier coatings to withstand extreme temperatures and protect engine components.
By Aircraft Type:
In the U.S., commercial aircraft dominate the aerospace composites market with a 50% share, supported by the growing demand for fuel-efficient, lightweight planes. Military aircraft account for roughly 30%, benefiting from advanced composites in stealth, structural integrity, and performance. Helicopters contribute around 15%, largely due to rotor blade and fuselage applications, while others cover 5%. Market growth is propelled by increasing air travel, modernization of fleets, and defense sector investments focused on performance optimization and lifecycle cost reduction.
For instance, Airbus uses advanced carbon-fiber reinforced plastic (CFRP) extensively in its A350 XWB, where more than half of the aircraft’s structure is composite, providing superior strength-to-weight ratio and corrosion resistance.
By Resin Type:
Thermoset composites lead the U.S. market with a 65% share, favored for their dimensional stability, heat resistance, and strong adhesion with fibers, making them ideal for structural components. Thermoplastic composites hold approximately 35%, gaining traction for repairability, recyclability, and faster processing in aerospace applications. The segment is driven by the increasing adoption of lightweight materials to enhance fuel efficiency, improve aircraft durability, and meet stringent regulatory standards for environmental sustainability and safety in both commercial and defense aviation sectors.
Key Growth Drivers
Increasing Demand for Lightweight Aircraft
The growing focus on fuel efficiency and reduced carbon emissions is driving the adoption of aerospace composites in the U.S. market. Lightweight materials like carbon fiber and advanced thermoset composites help manufacturers reduce aircraft weight, leading to lower fuel consumption and operational costs. Both commercial and military sectors are increasingly integrating these materials into fuselage, wings, and engine components. Rising airline operations and defense modernization programs further propel this trend, making lightweight composite adoption a primary growth driver for the aerospace industry in the U.S.
For instance, Lockheed Martin’s HX5 thermoplastic nanocomposite technology, licensed for commercial aviation, replaces metal parts in aircraft interiors, contributing to significant fuel efficiency and carbon emission reductions - potentially lowering emissions by over 600,000 pounds annually in single-aisle planes
Rising Commercial and Defense Aircraft Production
Expanding aircraft manufacturing activities are significantly contributing to the growth of the U.S. aerospace composites market. Increased production of commercial airliners to meet growing passenger demand and modernization of military fleets requires advanced composites for structural efficiency, durability, and performance. The need for high-strength, lightweight materials across critical components such as aerostructures, engine parts, and interiors continues to boost market demand. Investments in new aircraft programs and defense upgrades are reinforcing the sustained adoption of composite materials throughout the sector.
For innstance, Boeing has contracted suppliers like Daher to provide thermoplastic composite structural parts for its 787 Dreamliner, enhancing fuel efficiency with lighter, stronger components.
Technological Advancements in Composite Materials
Innovations in composite materials, including high-performance thermoplastics and hybrid fiber systems, are driving growth in the U.S. aerospace market. Enhanced manufacturing techniques, such as automated fiber placement and additive manufacturing, improve precision, reduce waste, and accelerate production cycles. These advancements enable more complex designs with better mechanical performance, thermal resistance, and corrosion protection. As aerospace manufacturers increasingly prioritize efficiency, safety, and sustainability, the integration of technologically advanced composites is becoming a key enabler for competitive advantage and market expansion.
Key Trends & Opportunities
Adoption of Thermoplastic Composites
Thermoplastic composites are gaining traction in the U.S. aerospace market due to their recyclability, faster processing, and ease of repair compared to traditional thermosets. Manufacturers are increasingly using these materials in secondary structures, interiors, and non-critical components to reduce production time and lifecycle costs. This trend aligns with sustainability goals and regulatory requirements while maintaining high structural performance. Growing awareness of environmental impact, coupled with the need for lightweight and durable components, presents significant opportunities for thermoplastic composites in both commercial and defense aviation segments.
For instance, Collins Aerospace incorporates greener thermoplastic composites into various aircraft parts, which reduce energy consumption during production and lower aircraft weight.
Integration of Advanced Aerostructures
The use of advanced aerostructures, incorporating high-strength fibers and innovative resin systems, is reshaping the U.S. aerospace composites market. Components such as wings, fuselage sections, and tail assemblies increasingly rely on composite solutions to optimize weight-to-strength ratios. This trend enables enhanced fuel efficiency, extended service life, and lower maintenance requirements. Opportunities exist for manufacturers to leverage modular composite designs and next-generation materials to meet evolving performance standards while supporting the production of modern aircraft with complex geometries and high durability demands.
For instance, Innovative Resin Systems manufactures custom epoxy and urethane compounds widely used in aerospace applications, supporting improved fuel efficiency and structural durability by enhancing composite material performance
Key Challenges
High Material and Manufacturing Costs
The cost of high-performance fibers, resins, and advanced manufacturing processes remains a major challenge in the U.S. aerospace composites market. Carbon fiber, thermoset resins, and precision manufacturing techniques involve significant capital investment, making initial production expensive. Small and mid-sized aerospace manufacturers may face constraints in adopting these materials at scale. Additionally, process complexities and quality control requirements further increase costs, potentially limiting widespread integration of composites across all aircraft components despite their long-term benefits in weight reduction and fuel efficiency.
Complex Certification and Regulatory Requirements
Stringent certification standards and regulatory compliance in the aerospace sector pose significant challenges for composite adoption. Components must meet rigorous safety, performance, and durability benchmarks, which often require extensive testing and validation. Navigating Federal Aviation Administration (FAA) regulations and military certification protocols can delay product introduction and increase development costs. These hurdles particularly impact new entrants and innovative materials, as the approval process demands extensive documentation, material characterization, and structural testing, slowing down the deployment of advanced composite solutions despite their operational advantages.
Regional Analysis
Northeast U.S.
The Northeast U.S. holds a 22% share of the aerospace composites market, driven by the concentration of key aerospace manufacturers and research institutions in states like Massachusetts and Connecticut. The region benefits from advanced manufacturing infrastructure, skilled labor, and access to aerospace R&D centers. High demand for commercial and military aircraft components, including aerostructures and engine parts, supports growth. Additionally, collaboration between defense agencies and private aerospace firms accelerates the adoption of carbon fiber and thermoset composites. The Northeast continues to be a hub for innovation, testing, and deployment of advanced composite technologies.
Midwest U.S.
The Midwest U.S. commands a 18% share of the aerospace composites market, supported by its strong industrial base and manufacturing capabilities in states such as Illinois, Michigan, and Ohio. The region’s focus on large-scale aircraft production and engine component manufacturing drives demand for high-performance composites. Access to logistics networks, metal and composite fabrication expertise, and partnerships with aerospace suppliers further boost growth. Investment in thermoplastic composites and automated manufacturing technologies is increasing. The Midwest is emerging as a key contributor to both commercial aircraft and military aerospace projects due to cost-efficient production capabilities.
South U.S.
The South U.S. captures a 35% share of the market, making it the leading region for aerospace composites adoption. States like Texas, Florida, and Alabama host major commercial aircraft assembly facilities, defense contractors, and helicopter manufacturing units. High investment in lightweight materials and advanced fiber composites for fuselage, wings, and engine components drives market growth. The presence of testing centers, ports, and strong supply chain networks further accelerates adoption. Expansion of defense contracts and increased commercial aircraft deliveries position the South as a dominant region for the deployment of carbon fiber, glass fiber, and thermoset composites.
West U.S.
The West U.S. accounts for a 25% share of the aerospace composites market, supported by aerospace clusters in California and Washington. The region benefits from proximity to major aircraft manufacturers, space exploration programs, and technology-driven startups specializing in advanced composites. Rising investments in high-performance thermoset and thermoplastic composites for aerostructures and interiors fuel market growth. Additionally, the West’s focus on research, innovation, and sustainability encourages adoption of lightweight materials to improve fuel efficiency. Strong collaborations between commercial aerospace and defense sectors reinforce the West U.S. as a critical region for composite integration in modern aircraft.
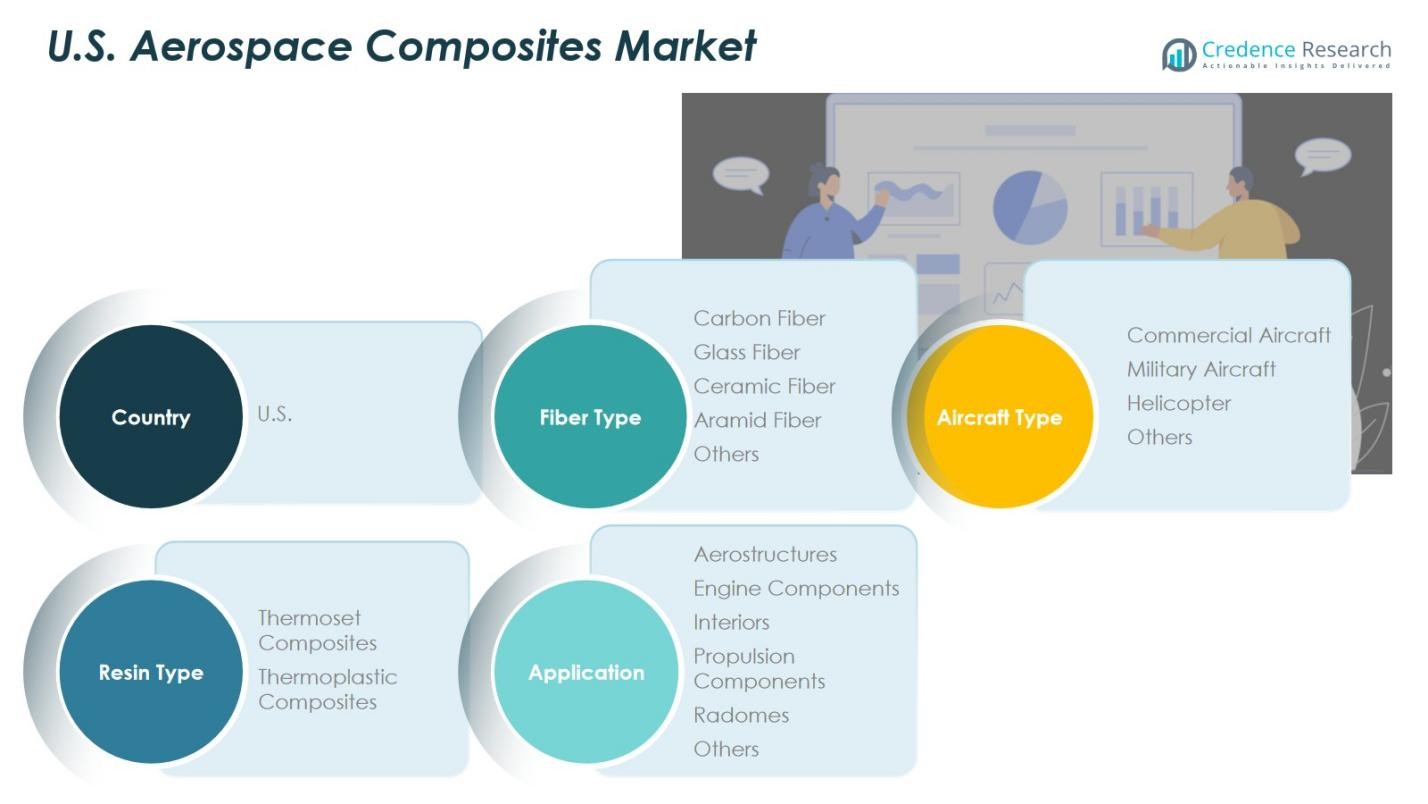
Market Segmentations:
By Fiber Type:
- Carbon Fiber
- Glass Fiber
- Ceramic Fiber
- Aramid Fiber
- Others
By Aircraft Type:
- Commercial Aircraft
- Military Aircraft
- Helicopter
- Others
By Resin Type
- Thermoset Composites
- Thermoplastic Composites
By Application:
- Aerostructures
- Engine Components
- Interiors
- Propulsion Components
- Radomes
- Others
By Region:
- Northeast
- Midwest
- South
- West
Competitive Landscape
The competitive landscape of the U.S. aerospace composites market is dominated by key players such as Hexcel Corporation, Toray Industries, Teijin Limited, Solvay S.A., and Mitsubishi Chemical Corporation. These companies lead through innovation in high-performance carbon fiber, thermoset, and thermoplastic composites, targeting applications across commercial aircraft, military planes, and helicopters. The market is highly competitive, with players focusing on strategic partnerships, mergers, and acquisitions to expand their product portfolios and strengthen regional presence. Continuous investment in R&D enables the development of lightweight, durable, and corrosion-resistant composites, meeting stringent regulatory and safety standards. Additionally, companies are leveraging advanced manufacturing techniques, including automated fiber placement and additive manufacturing, to enhance production efficiency. Market competition is further intensified by the increasing demand for sustainable and cost-effective composite solutions, prompting players to differentiate through quality, performance, and innovation in materials and processes.
Key Player Analysis
- Hexcel Corporation
- Toray Industries, Inc.
- Teijin Limited
- Solvay S.A.
- Mitsubishi Chemical Corporation
- Owens Corning
- SGL Carbon SE
- LMI Aerospace
- Unitech Group
- VX Aerospace
Recent Developments
- In August 2025, Uavos Inc. was selected by Avincis to supply composite main rotor blades for unmanned helicopters, enhancing the rotor blades with advanced composite materials for durability and performance.
- In October 8, 2024, Applied Aerospace acquired key assets of Innovative Composite Engineering (ICE) in White Salmon, Washington, enhancing its capabilities in composite manufacturing for aerospace applications.
- In September 26, 2024, Toray Advanced Composites launched the Toray Cetex® TC1130 PESU thermoplastic composite, designed for high-performance aerospace applications requiring thermal stability and mechanical strength.
- In May 2025, Hexcel partnered with JetZero to qualify composite materials for the development of JetZero's all-wing design aircraft demonstrator, aiming at fuel efficiency and innovative aircraft design.
Report Coverage
The research report offers an in-depth analysis based on Fiber Type, Aircraft Type, Resin Type, Application and Region. It details leading market players, providing an overview of their business, product offerings, investments, revenue streams, and key applications. Additionally, the report includes insights into the competitive environment, SWOT analysis, current market trends, as well as the primary drivers and constraints. Furthermore, it discusses various factors that have driven market expansion in recent years. The report also explores market dynamics, regulatory scenarios, and technological advancements that are shaping the industry. It assesses the impact of external factors and global economic changes on market growth. Lastly, it provides strategic recommendations for new entrants and established companies to navigate the complexities of the market.
Future Outlook
- Demand for lightweight and high-strength materials will continue to drive market growth.
- Adoption of carbon fiber and advanced thermoset composites is expected to increase across commercial and military aircraft.
- Expansion of thermoplastic composites will support faster manufacturing and improved recyclability.
- Rising commercial aircraft production and defense modernization programs will fuel material requirements.
- Advanced manufacturing technologies, including automated fiber placement, will enhance efficiency and precision.
- Focus on fuel efficiency and emission reduction will encourage broader composite integration.
- Development of hybrid fiber systems will improve performance and durability of aerospace components.
- Collaborations between aerospace manufacturers and material suppliers will accelerate innovation.
- Regulatory standards and safety compliance will continue shaping material selection and design.
- Investments in research and sustainable materials will open new opportunities in next-generation aircraft.
Request a Free Sample
Fill in your details and we'll send you a free sample report.
- Sample data tables & charts
- Research methodology
Need a Custom Version of This Report?
Tailor the scope, geography, or segments to your exact requirements.
- Custom geography or segment scope
- Direct access to our analyst team
Frequently Asked Questions
What is the current market size for U.S. Aerospace Composites Market, and what is its projected size in 2032?
At what Compound Annual Growth Rate is the U.S. Aerospace Composites Market projected to grow between 2025 and 2032?
Which U.S. Aerospace Composites Market segment held the largest share in 2024?
What are the primary factors fueling the growth of the U.S. Aerospace Composites Market?
Who are the leading companies in the U.S. Aerospace Composites Market?
Which region commanded the largest share of the U.S. Aerospace Composites Market in 2024?
Table of Content
Chapter 1. Report Introduction
- 1.1 Report Description & Purpose
- 1.1.1 Report Title & Market Definition
- 1.1.2 Unique Selling Propositions (USP) & Key Differentiators
- 1.1.3 Value Proposition for Stakeholders
- 1.2 Research Objectives
- 1.2.1 Market Sizing Objectives (Volume & Revenue)
- 1.2.2 Segmentation Objectives
- 1.2.3 Competitive Intelligence Objectives
- 1.2.4 Forecast & Scenario Objectives
- 1.3 Report Scope
- 1.3.1 U.S. Aerospace Composites Scope – Types & Subtypes Covered
- 1.3.2 Geographic Scope – Regions & Countries Covered
- 1.3.3 Historical Period, Base Year & Forecast Period (2024; forecast to 2032)
- 1.3.4 Inclusions & Exclusions
- 1.4 HS Code & Classification Framework
- 1.5 Currency, Units & Pricing Basis
- 1.6 Target Stakeholders
- 1.7 Limitations & Assumptions
Chapter 2. Executive Summary
- 2.1 Global U.S. Aerospace Composites Market Snapshot
- 2.1.1 Market Size – Historical (2024) & Forecast (2024-2032) (2024: USD 11,658.66 Million → 2032: USD 25,123.11 Million)
- 2.1.2 Volume & Revenue – Global Totals
- 2.1.3 Key Market Highlights – Top Five Facts
- 2.2 U.S. Aerospace Composites Market Segmentation Snapshot
- 2.2.1 Market Split by Region – 2024 vs. 2032
- 2.3 Competitive Snapshot
- 2.3.1 Top 10 Players by Revenue Share – 2024
- 2.3.2 Top 10 Players by Volume Share – 2024
- 2.3.3 Recent Strategic Developments (18-Month Summary)
- 2.4 Key Investment Highlights & Strategic Conclusions
Chapter 3. U.S. Aerospace Composites Market Dynamics & Industry Analysis
- 3.1 Market Overview & Context
- 3.1.1 U.S. Aerospace Composites Market Position in the Broader Automotive Value Chain
- 3.1.2 OEM vs. Replacement Market Dynamics
- 3.1.3 Market Maturity & Development Stage by Region
- 3.2 U.S. Aerospace Composites Market Drivers
- 3.3 U.S. Aerospace Composites Market Restraints & Challenges
- 3.4 U.S. Aerospace Composites Market Opportunities
- 3.5 Porter's Five Forces Analysis
- 3.5.1 Threat of New Entrants
- 3.5.2 Bargaining Power of Suppliers
- 3.5.3 Bargaining Power of Buyers
- 3.5.4 Threat of Substitutes
- 3.5.5 Competitive Rivalry – Intensity Assessment
- 3.6 U.S. Aerospace Composites Value Chain Analysis
- 3.6.1 Upstream – Raw Material/Input Suppliers
- 3.6.1.1 Raw Material/Input 1
- 3.6.1.2 Raw Material/Input 2
- 3.6.1.3 Raw Material/Input 3
- 3.6.2 Midstream – Production/Manufacturing/Service Delivery
- 3.6.2.1 Production/Process Overview
- 3.6.2.2 Key Facility Locations & Capacity by Manufacturer
- 3.6.3 Downstream – Distribution & End Consumer
- 3.6.3.1 Primary Channel – B2B/OEM
- 3.6.3.2 Secondary Channels – Dealer, Retail, Online, Direct
- 3.6.4 Value Chain Profitability Analysis
- 3.6.1 Upstream – Raw Material/Input Suppliers
- 3.7 PESTEL Analysis
- 3.7.1 Political Factors
- 3.7.2 Economic Factors
- 3.7.3 Social Factors
- 3.7.4 Technological Factors
- 3.7.5 Environmental Factors
- 3.7.6 Legal Factors
- 3.8 U.S. Aerospace Composites Supply Chain Analysis
- 3.8.1 Raw Material/Input Supply Risk Assessment
- 3.8.2 Manufacturing Concentration Risk (Geographic Exposure)
- 3.8.3 Trade Disruption Impact Analysis
- 3.9 Regulatory & Policy Landscape
Note: The regulatory and policy landscape section covers regulations based on their applicability to the market, U.S. Aerospace Composites category, geography, and scope of the study. Only regulatory frameworks with a material impact on operations, compliance, trade, sustainability, or market access are analyzed in detail.
Chapter 4. Key Investment Pockets & Opportunity Analysis
- 4.1 U.S. Aerospace Composites Market Attractiveness Analysis
- 4.1.1 By Region – Investment Attractiveness Matrix (Volume × CAGR)
- 4.2 Absolute Revenue Growth Opportunity
- 4.2.1 By Region – Absolute USD Growth Through 2032
- 4.3 Incremental Volume Opportunity
- 4.3.1 By Region – Incremental Volume Through 2032
- 4.3.2 Segment – Incremental Volume
- 4.4 Emerging Submarket Opportunity Deep Dive (Subject to Applicability)
- 4.5 Emerging Market Opportunity Scorecards
- 4.5.1 United States
- 4.5.2 Europe
- 4.5.3 Asia
- 4.5.4 Middle East & Africa
Note: Emerging Market Opportunity Scorecards will be included based on relevance and strategic importance. Regions listed are indicative and may vary depending on data availability and market dynamics.
Chapter 5. U.S. Aerospace Composites Import-Export Analysis & Trade Flows
- 5.1 Global Trade Overview
- 5.1.1 Global Export Value by Country (2024)
- 5.1.2 Global Export Volume by Country (2024)
- 5.1.3 Global Import Value by Country (2024)
- 5.1.4 Global Import Volume by Country (2024)
- 5.1.5 Net Trade Balance by Country (2024)
- 5.2 Export Analysis – Segment
- 5.2.1 Type 1 (HS Code)
- 5.2.2 Type 2 (HS Code)
- 5.2.3 Type 3 (HS Code)
- 5.2.4 Type 4 (HS Code)
- 5.2.5 Type 5 (HS Code)
- 5.3 Import Analysis – Segment
- 5.3.1 Type 1 (HS Code)
- 5.3.2 Type 2 (HS Code)
- 5.3.3 Type 3 (HS Code)
- 5.3.4 Type 4 (HS Code)
- 5.3.5 Type 5 (HS Code)
- 5.4 Average Unit Trade Prices
- 5.4.1 Average Export Price – Segment & Country
- 5.4.2 Average Import Price – Segment & Source Country
- 5.4.3 Price Trends (2024)
- 5.5 Key Trade Route Analysis
- 5.5.1 Trade Route 1
- 5.5.2 Trade Route 2
- 5.5.3 Trade Route 3
- 5.5.4 Trade Route 4
- 5.5.5 Trade Route 5
- 5.6 Trade Policy Impact Assessment
- 5.6.1 US Anti-Dumping & Section 301 Tariffs
- 5.6.2 EU Customs Union Impact
- 5.6.3 Major Free Trade Agreements
- 5.6.4 USMCA Rules of Origin
Note: Trade policy analysis will be included only where relevant to the U.S. Aerospace Composites market.
Chapter 6. Competitive Landscape & Company Benchmarking
- 6.1 U.S. Aerospace Composites Market Concentration & Structure
- 6.1.1 Herfindahl-Hirschman Index (HHI) – vs. 2024
- 6.1.2 Tier 1, Tier 2 & Tier 3 Market Structure
- 6.1.3 Global, Regional & Local Player Dynamics
- 6.2 U.S. Aerospace Composites Market Share Analysis – 2024
- 6.2.1 Global Revenue Share by Company
- 6.2.2 Global Volume Share by Company
- 6.2.3 Regional Revenue Share
- 6.2.4 Market Share Evolution ( vs. 2024)
- 6.2.5 OEM Segment Share by Company
- 6.2.6 Replacement Segment Share by Company
- 6.3 Production/Delivery Capacity & Facility Analysis
- 6.3.1 Global Installed Capacity
- 6.3.2 Capacity Utilization Rates
- 6.3.3 Production/Output Volume
- 6.3.4 Facility Locations & Capacity Map
- 6.3.5 Planned Capacity Additions
- 6.4 U.S. Aerospace Composites Competitive Benchmarking Matrix
- 6.4.1 Revenue, Volume, CAGR & Profitability Comparison
- 6.4.2 Channel Revenue Mix
- 6.4.3 Geographic Revenue Exposure
- 6.4.4 R&D Intensity
- 6.4.5 Sustainability Maturity
- 6.5 Strategic Developments in U.S. Aerospace Composites (Last 24 Months)
- 6.5.1 Mergers, Acquisitions & Divestments
- 6.5.2 New U.S. Aerospace Composites Launches
- 6.5.3 Facility Expansions
- 6.5.4 Strategic Alliances, Joint Ventures & Partnerships
- 6.5.5 Distribution Expansion & Market Entry
- 6.5.6 Sustainability & ESG Initiatives
- 6.6 Competitive Strategy Mapping
- 6.6.1 Leader, Challenger, Follower & Niche Classification
- 6.6.2 Pricing Strategy Comparison
- 6.6.3 Channel Strategy Matrix
Note: Strategic developments are included based on their materiality and the availability of reliable information.
Chapter 7. Global U.S. Aerospace Composites Market – By Distribution Channel
- 7.1 Segment Overview
- 7.1.1 Volume & Revenue Split by Channel (2024 & 2032)
- 7.1.2 Channel Mix Evolution (2024-2032)
Chapter 8. Regional Market Analysis – Global Overview
- 8.1 Global Regional Overview
- 8.1.1 Regional Volume Share
- 8.1.2 Regional Revenue Share
- 8.1.3 Regional Volume by Region
- 8.1.4 Regional Revenue by Region
- 8.1.5 Regional Forecast Through 2032
- 8.2 Cross-Regional Segment Analysis
- 8.2.1 By Distribution Channel
- 8.2.2 By Brand/Price Tier
Chapter 9. North America U.S. Aerospace Composites Market
- 9.1 United States
- 9.2 Canada
- 9.3 Mexico
Chapter 10. Europe U.S. Aerospace Composites Market
- 10.1 Germany
- 10.2 France
- 10.3 Italy
- 10.4 United Kingdom
- 10.5 Spain
- 10.6 Poland
- 10.7 Russia
- 10.8 Netherlands
- 10.9 Belgium
- 10.10 Sweden
- 10.11 Denmark
- 10.12 Norway
- 10.13 Rest of Europe
Chapter 11. Asia Pacific U.S. Aerospace Composites Market
- 11.1 China
- 11.2 India
- 11.3 Japan
- 11.4 South Korea
- 11.5 Thailand
- 11.6 Indonesia
- 11.7 Vietnam
- 11.8 Malaysia
- 11.9 Australia
- 11.10 Rest of Asia Pacific
Chapter 12. Latin America U.S. Aerospace Composites Market
- 12.1 Brazil
- 12.2 Argentina
- 12.3 Colombia
- 12.4 Chile
- 12.5 Rest of Latin America
Chapter 13. Middle East U.S. Aerospace Composites Market
- 13.1 Saudi Arabia
- 13.2 United Arab Emirates
- 13.3 Turkey
- 13.4 Israel
- 13.5 Iran
- 13.6 Rest of the Middle East
Chapter 14. Africa U.S. Aerospace Composites Market
- 14.1 South Africa
- 14.2 Egypt
- 14.3 Nigeria
- 14.4 Morocco
- 14.5 Rest of Africa
Chapter 15. U.S. Aerospace Composites Company Profiles
- 15.1 [Company 01]
- 15.1.1 Company Overview
- 15.1.2 Key Management Personnel
- 15.1.3 Products & Services Portfolio
- 15.1.4 Financial Performance
- 15.1.5 Key Market Focus & Geographic Presence
- 15.1.6 Recent Developments & Strategic Initiatives
Note: The company profile list is preliminary and may change based on research findings, market developments, data availability, and client requirements.
Chapter 16. Appendices
- Appendix A – List of Abbreviations & Acronyms
- Appendix B – Industry Classification Code Reference – Full Series
- Appendix C – Production & Capacity Data Tables
- Appendix D – End-Use & Demand Base Tables
- Appendix E – Consumption & Replacement Rate Assumptions
- Appendix F – ASP Reference Tables
- Appendix G – Manufacturing & Facility Database
- Appendix H – Import-Export Data Tables
- Appendix I – Regulatory Summary Tables
- Appendix J – Primary Research Participant List (Anonymized)
- Appendix K – Primary Research Questionnaire Framework
- Appendix L – Data Sources & Bibliography
- Appendix M – Market Size Divergence & Source Comparison
Chapter 17. Research Methodology
- 17.1 Research Framework & Philosophy
- 17.2 Secondary Research – Sources, Hierarchy & Data Extraction
- 17.3 Data Modeling – Bottom-Up & Top-Down Market Sizing
- 17.4 Primary Research – Stakeholder Framework, LOI & Sample Sizes
- 17.5 Forecast Methodology – Regression, Scenario & Sensitivity Analysis
- 17.6 Quality Control – Four-Layer Validation Framework
- 17.7 Limitations & Standard Assumptions
- 17.8 Disclaimer
