
Market Overview:
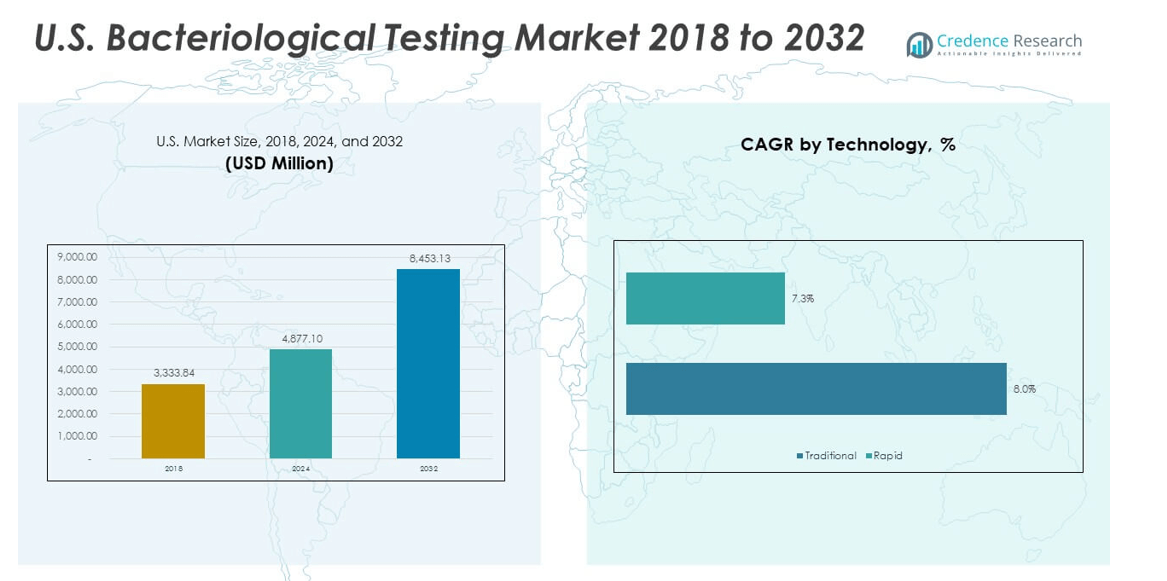
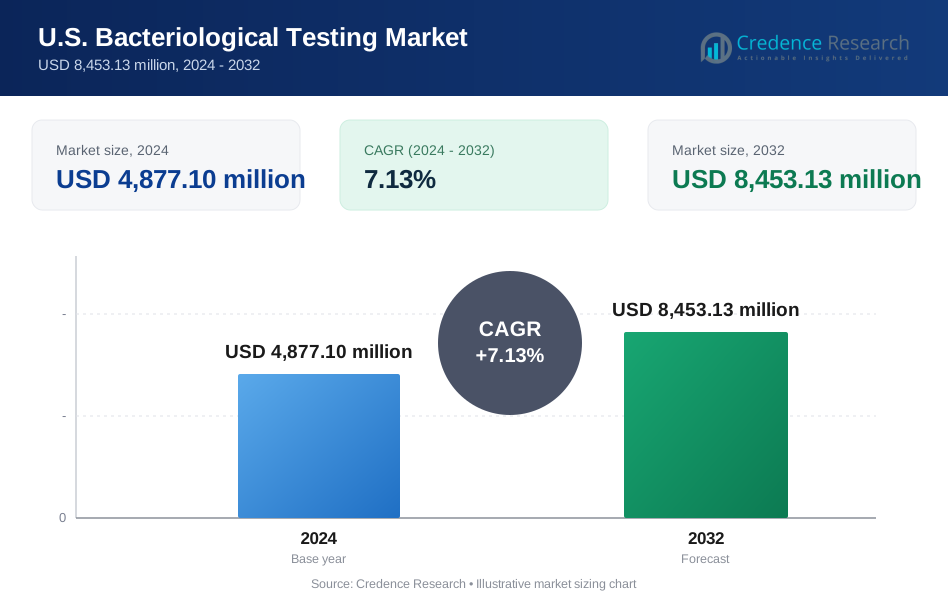
The U.S. Bacteriological Testing Market size was valued at USD 3,333.84 million in 2018, reaching USD 4,877.10 million in 2024, and is anticipated to achieve USD 8,453.13 million by 2032, at a CAGR of 7.13% during the forecast period.
| REPORT ATTRIBUTE | DETAILS |
|---|---|
| Historical Period | 2020-2023 |
| Base Year | 2024 |
| Forecast Period | 2025-2032 |
| U.S. Bacteriological Testing Market Size 2024 | USD 4,877.10 million |
| U.S. Bacteriological Testing Market, CAGR | 7.13% |
| U.S. Bacteriological Testing Market Size 2032 | USD 8,453.13 million |
Growth in this market is fueled by rising concerns over food safety, healthcare-associated infections, and water contamination. The U.S. government’s regulatory standards encourage testing across food, pharmaceutical, and environmental sectors. Increasing demand for advanced diagnostic methods, coupled with rising public awareness about microbial risks, drives industry expansion. Automation, faster detection technologies, and growing adoption of bacteriological testing in clinical settings further support market growth. This environment encourages innovation and pushes both established and emerging companies to strengthen their offerings.
Geographically, the U.S. market shows leadership due to strong infrastructure, established healthcare systems, and regulatory oversight. Demand is high in regions with advanced industrial and healthcare bases, while emerging demand comes from areas adopting modern food safety and water testing systems. Rising urbanization and population density accelerate the need for testing in metropolitan regions. Rural regions are gradually integrating bacteriological testing as awareness and investment increase, making the market scope broad across varied U.S. geographies.
Market Insights:
- The U.S. Bacteriological Testing Market was valued at USD 3,333.84 million in 2018, reached USD 4,877.10 million in 2024, and is projected to hit USD 8,453.13 million by 2032, growing at a CAGR of 7.13%.
- The Midwest and South hold 42% share, driven by strong food production and agriculture industries, supported by large-scale processing facilities and regulatory compliance.
- The West accounts for 30% share and is the fastest-growing region, fueled by biotechnology hubs, water safety initiatives, and adoption of rapid testing technologies.
- Consumable reagents lead with around 45% share, supported by consistent demand for routine and large-scale testing across laboratories and industries.
- Instruments account for nearly 30% share, while test kits hold about 25%, reflecting rising adoption of portable solutions for food, water, and healthcare testing.
Market Drivers:
Rising Food Safety Concerns and Regulatory Standards
Foodborne illnesses and contamination risks are driving strong demand for bacteriological testing. The U.S. has stringent regulations for food safety monitoring, supported by the FDA and USDA. The growing complexity of food supply chains heightens testing needs across production and distribution. Consumers increasingly demand safer food, which influences manufacturers to invest in reliable testing solutions. The U.S. Bacteriological Testing Market benefits from this regulatory push. It ensures consistent adoption across food processors, suppliers, and retailers. Public health authorities also continue to stress testing as a preventive measure. Industry players respond by expanding advanced testing services.
- For instance, the FDA added sesame as the ninth major allergen under the FASTER Act, mandating all food manufacturers to declare sesame prominently within ingredient lists or in a “Contains” statement, and enhanced gluten-free claim regulations require tested products to contain less than 20 ppm gluten for compliance.
Healthcare-Associated Infections and Hospital Safety Protocols
The rise in healthcare-associated infections drives hospitals to increase testing procedures. Infections from bacteria such as MRSA and E. coli pose serious risks in healthcare environments. Regulatory agencies encourage regular testing in hospitals, clinics, and laboratories. The U.S. Bacteriological Testing Market gains strength from this emphasis on patient safety. It pushes healthcare providers to adopt efficient diagnostic methods. Bacteriological testing tools play a vital role in infection prevention strategies. Hospitals rely on rapid and accurate results to protect patients and staff. This strong focus drives growth in clinical testing services.
- For instance, Bio-Rad’s iQ-Check real-time PCR kits, adopted by numerous hospital laboratories, enable same-day pathogen detection with an average turnaround time of less than 24 hours, compared to previous manual methods that required up to 72 hours for results.
Advancements in Diagnostic Technologies and Automation
Technological innovation is a key driver shaping industry progress. Advanced methods such as PCR and immunoassays enable faster and more accurate detection. Automation reduces manual intervention, minimizing errors and improving efficiency. The U.S. Bacteriological Testing Market benefits from continuous innovation. It makes testing accessible across food, healthcare, and environmental sectors. Investment in automated equipment allows large-scale labs to process higher volumes. Faster turnaround times improve decision-making and compliance. Industry competition encourages further innovation to meet rising customer demands.
Growing Awareness of Water Quality and Environmental Safety
Waterborne pathogens pose risks to both communities and industries. Government initiatives for safe drinking water create demand for testing services. Industrial sectors must comply with water quality regulations, reinforcing the need for bacteriological testing. The U.S. Bacteriological Testing Market expands with rising awareness of contamination threats. It becomes essential for municipalities, industries, and households. Growing urbanization and population density increase reliance on testing infrastructure. Public health campaigns highlight the importance of safe water practices. These combined forces push growth across environmental testing services.
Market Trends:
Adoption of Digital Platforms and Data Integration in Testing Services
Digital transformation reshapes how laboratories handle testing workflows. Automated data systems improve accuracy, reduce errors, and simplify reporting. The U.S. Bacteriological Testing Market gains efficiency with digital platforms. It integrates laboratory information management systems for better traceability. Cloud-based platforms enhance collaboration between labs, regulators, and industries. Data-driven insights allow quick responses to contamination events. Digitalization ensures compliance with strict safety standards. Companies invest in AI-based platforms to predict contamination risks.
- For instance, Neogen's advanced laboratory information management system (LIMS) enables full digital sample tracking and automated data entry, which helps reduce transcription errors and can accelerate laboratory reporting times.
Expansion of Testing in Niche Applications Across Multiple Sectors
Bacteriological testing extends beyond food and healthcare. Industries such as cosmetics, packaging, and pharmaceuticals demand testing for product safety. The U.S. Bacteriological Testing Market sees broader applications across emerging fields. It encourages innovation in customized solutions for specific industries. Growth is evident in specialized areas like probiotic testing and personal care. Companies focus on targeted solutions for diverse sectors. Increasing R&D supports broader adoption across applications. Expansion into niche industries strengthens market diversity.
Shift Toward Sustainable and Eco-Friendly Testing Solutions
Sustainability influences product development and testing practices. Eco-friendly kits and consumables reduce environmental impact in labs. The U.S. Bacteriological Testing Market aligns with green practices. It focuses on reducing waste and improving energy efficiency. Companies adopt reusable equipment and environmentally safe reagents. Green certifications encourage adoption among eco-conscious clients. Environmental considerations become a key part of market positioning. The focus on sustainability reshapes long-term strategies for testing providers.
Growing Demand for Rapid and Point-of-Care Testing
Industries require faster results to maintain operational efficiency. Point-of-care testing expands in clinical and food environments. The U.S. Bacteriological Testing Market embraces portable and user-friendly solutions. It supports industries with immediate decision-making needs. Rapid testing tools reduce delays in identifying contamination risks. Adoption rises in field testing applications where mobility matters. Companies innovate handheld diagnostic devices for real-time detection. Rapid testing becomes central to improving response strategies.
Market Challenges Analysis:
High Costs of Advanced Testing Technologies and Limited Accessibility
Advanced bacteriological testing methods often come with high costs. Smaller laboratories and rural facilities face budget constraints. The U.S. Bacteriological Testing Market struggles with uneven adoption across regions. It creates a gap between large-scale labs and small operators. High equipment prices and maintenance needs limit accessibility. This challenge impacts food producers and healthcare providers with tight budgets. Some organizations hesitate to invest in advanced automation. Balancing affordability and quality remains a persistent hurdle.
Shortage of Skilled Professionals and Standardization Issues
A lack of skilled personnel affects efficiency in many facilities. The U.S. Bacteriological Testing Market requires trained experts for accurate results. Shortages increase risks of mismanagement and delays in testing. Variations in testing methods across laboratories create inconsistency. Absence of uniform protocols complicates compliance efforts. It challenges regulatory bodies aiming to maintain strict standards. Training programs and certification initiatives attempt to address the gap. Standardization and workforce development remain critical for long-term stability.
Market Opportunities:
Expansion of Testing Services into Emerging Consumer and Industrial Sectors
Emerging industries create untapped opportunities for service providers. The U.S. Bacteriological Testing Market can expand into packaged foods, beverages, and cosmetics. It also shows growth potential in animal feed and nutraceutical industries. Companies offering specialized solutions capture these new segments. Broader demand supports service providers in expanding client bases. It provides consistent growth avenues for industry players.
Integration of AI and Automation for Advanced Testing Applications
Automation and AI create significant potential in improving testing outcomes. The U.S. Bacteriological Testing Market benefits from predictive analytics and machine learning. It helps anticipate contamination events before they escalate. Automation enhances efficiency, enabling large-scale and rapid testing. AI-driven platforms strengthen decision-making across industries. Integration of these technologies shapes a competitive advantage. Companies investing in intelligent solutions will see long-term benefits.
Market Segmentation Analysis:
By Product Segment Analysis
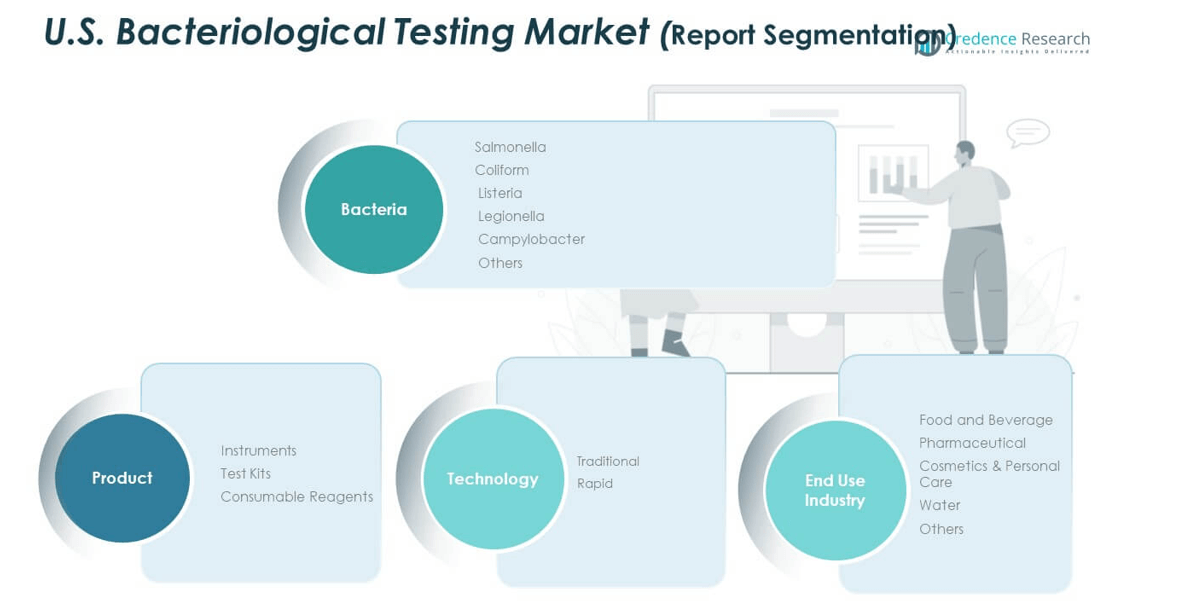
Instruments hold a strong position due to their critical role in ensuring accuracy and efficiency in laboratory testing. Test kits gain traction for their convenience, portability, and ability to deliver rapid results across food, water, and clinical applications. Consumable reagents remain essential for routine testing, ensuring consistent demand from both public and private laboratories. The U.S. Bacteriological Testing Market benefits from product diversity that addresses both large-scale facilities and small testing centers. It supports growth through balanced adoption across advanced instruments and cost-efficient kits.
- For instance, Bio-Rad’s iQ-Check Prep Automation System can process up to 200 samples per day for major food processors, reducing manual labor and minimizing sample handling errors. Meanwhile, rapid test kits remain popular for their portability and ease of use, enabling on-site results in non-laboratory environments such as food factories and field testing units.
By Bacteria Segment Analysis
Salmonella dominates due to its frequent association with foodborne illnesses. Coliform testing also commands significant demand, reflecting its role in assessing water and food quality. Listeria and Legionella testing expand steadily, driven by stricter compliance regulations across food processing and water systems. Campylobacter and other bacterial categories maintain relevance in targeted environments. The U.S. Bacteriological Testing Market demonstrates resilience by addressing multiple bacterial risks, ensuring compliance and public health protection.
- For instance, real-time PCR-based quantification platforms have reduced detection thresholds, allowing public health labs to confirm Salmonella presence in poultry samples within 6 hours—helping regulatory authorities respond to outbreaks faster than prior culture-based methods that required at least 2 days.
By Technology Segment Analysis
Traditional methods retain importance for reliability and established use in many facilities. Rapid testing technologies expand quickly, supported by the need for fast results in food and healthcare sectors. The U.S. Bacteriological Testing Market gains efficiency and scalability through this dual adoption. It balances precision from traditional methods with speed and accessibility from rapid approaches.
By End User Segment Analysis
Food and beverage industries lead demand due to strict safety standards. Pharmaceutical and water testing segments expand with rising compliance needs. Cosmetics and personal care industries increase adoption to ensure product safety. Others, including environmental and academic institutions, continue to support steady growth. The U.S. Bacteriological Testing Market thrives across diverse end-user groups, strengthening its overall stability.
Segmentation:
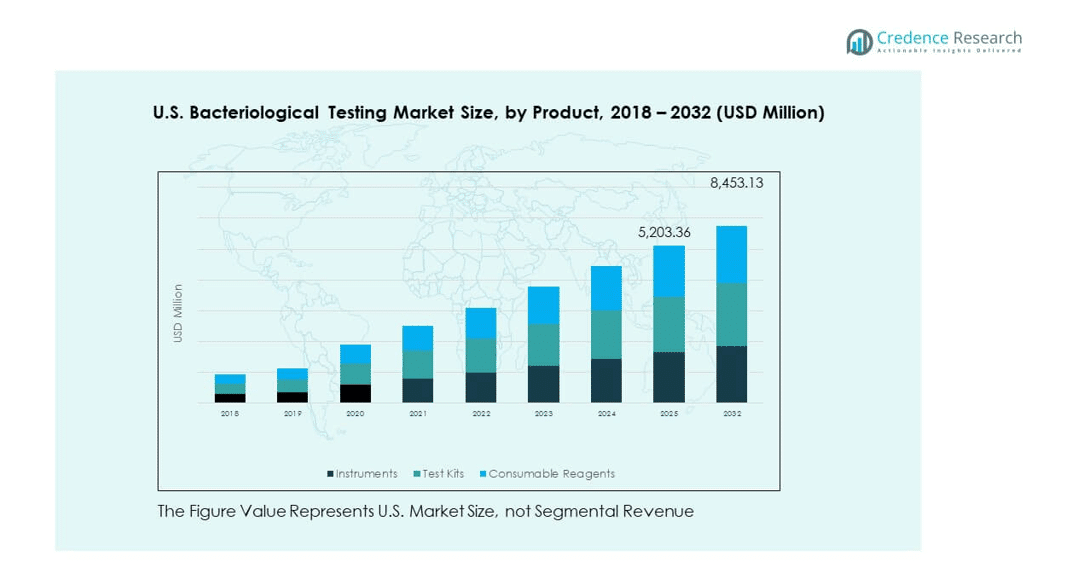
By Product Segment Analysis
- Instruments
- Test Kits
- Consumable Reagents
By Bacteria Segment Analysis
- Salmonella
- Coliform
- Listeria
- Legionella
- Campylobacter
- Others
By Technology Segment Analysis
- Traditional
- Rapid
By End User Segment Analysis
- Food and Beverage
- Pharmaceutical
- Cosmetics & Personal Care
- Water
- Others
Regional Analysis:
Northeast – Strong Healthcare and Pharmaceutical Base
The Northeast holds around 28% market share, supported by its advanced healthcare infrastructure and concentration of pharmaceutical companies. States like New York, Massachusetts, and Pennsylvania drive demand with their strong presence of research institutions and hospitals. The U.S. Bacteriological Testing Market in this region benefits from frequent testing across clinical, water, and food industries. It is also strengthened by strict state-level regulations that enforce compliance in manufacturing and healthcare. Rapid urbanization and higher population density increase the need for consistent monitoring. Demand for advanced diagnostic technologies continues to rise in both public and private laboratories. This region remains a hub for innovation and adoption of modern testing practices.
Midwest and South – Expanding Food and Agriculture Testing
The Midwest and South together command nearly 42% market share, led by their strong food production and agriculture industries. States such as Illinois, Texas, and Georgia support demand with large-scale processing facilities. The U.S. Bacteriological Testing Market gains momentum here through extensive testing for foodborne pathogens. It also benefits from water quality monitoring due to the presence of industrial hubs and farming activity. Regional universities and research facilities further contribute by integrating advanced testing into agricultural safety programs. Healthcare systems in the South expand their adoption of bacteriological testing to meet growing patient needs. These regions continue to see strong investments in laboratory expansion and automation.
West – Fastest Growth Driven by Innovation and Environment Monitoring
The West accounts for about 30% market share and is the fastest-growing U.S. region. States like California and Washington lead with strong biotechnology, water safety, and environmental monitoring programs. The U.S. Bacteriological Testing Market thrives here due to high demand from both healthcare and food industries. It is further supported by technology-driven solutions developed in the region’s innovation hubs. Growing concerns about water safety and contamination risks push consistent testing adoption. Rising consumer demand for organic and processed foods strengthens the need for pathogen detection. The West remains a leading center for adoption of rapid and automated testing technologies.
Key Player Analysis:
- Hardy Diagnostics
- Thermo Fisher Scientific Inc.
- Eurofins
- Agilent Technologies Inc.
- Bio-Rad Laboratories Inc.
- Intertek
- Merck kGaA
- Neogen Corporation
- Vimta Labs
- BioMerieux
- Symbio Labs
- Alfa Chemistry
- Other Key Players
Competitive Analysis:
The U.S. Bacteriological Testing Market is highly competitive, with global leaders and regional players focusing on technology, service expansion, and compliance-driven solutions. Companies compete by strengthening their product portfolios with advanced instruments, test kits, and consumables. It remains innovation-driven, with rapid testing and automation technologies gaining prominence. Leading firms invest in R&D to enhance precision, reduce turnaround times, and meet stringent regulatory standards. Collaborations with food processors, healthcare providers, and environmental agencies boost industry positioning. Market participants also pursue mergers, acquisitions, and strategic partnerships to widen their geographic and client reach. Strong distribution networks and tailored solutions for diverse end users ensure sustained competitiveness.
Recent Developments:
- On September 2, 2025, Eurofins Scientific completed the acquisition of related party-owned laboratory sites, a move designed to streamline operational costs and expand strategic assets for bioanalytical testing in the U.S. As a result of this deal, Eurofins anticipates a substantial reduction in annualized rent payments, strengthening its position as a leading player in the U.S. bacteriological testing sector.
- In July 2025, Hardy Diagnostics announced a commercialization partnership with Mango, a startup focused on rapid pharmaceutical sterility testing technology, aiming to advance faster and more reliable bacteriological testing practices in the U.S. market. For instance, Hardy Diagnostics hosted Mango’s technical team at its Santa Maria headquarters for in-depth collaborative discussions and will be presenting joint innovations at the PDA Pharmaceutical Microbiology Conference in October 2025.
- In July 2025, Thermo Fisher Scientific expanded its strategic partnership with Sanofi by acquiring Sanofi’s sterile manufacturing facility in Ridgefield, New Jersey. The integration of this modern fill-finish packaging site, set to finalize in the second half of 2025, is expected to boost U.S. drug product manufacturing capacity while supporting ongoing supply and growth for critical pharmaceutical products.
Report Coverage:
The research report offers an in-depth analysis based on product, bacteria, technology, and end-user segments. It details leading market players, providing an overview of their business, product offerings, investments, revenue streams, and key applications. Additionally, the report includes insights into the competitive environment, SWOT analysis, current market trends, as well as the primary drivers and constraints. Furthermore, it discusses various factors that have driven market expansion in recent years. The report also explores market dynamics, regulatory scenarios, and technological advancements that are shaping the industry. It assesses the impact of external factors and global economic changes on market growth. Lastly, it provides strategic recommendations for new entrants and established companies to navigate the complexities of the market.
Future Outlook:
- Rising demand for rapid bacteriological testing will reshape operational efficiency across industries.
- Food safety compliance will remain the leading driver, reinforcing testing requirements for manufacturers.
- Technological advancements in automation and AI will enhance accuracy and reduce turnaround time.
- Expanding water quality monitoring programs will increase demand for municipal and industrial testing.
- Pharmaceutical and healthcare sectors will adopt advanced tools to address hospital safety protocols.
- Growth in the cosmetics and personal care industry will contribute to higher adoption rates.
- Regional laboratories will see expansion through partnerships and acquisitions to meet testing needs.
- Sustainability initiatives will encourage eco-friendly kits, reagents, and waste-reduction practices.
- Increased consumer awareness will pressure companies to implement strict safety testing systems.
- The U.S. Bacteriological Testing Market will continue to attract investment for innovation and expansion.
Request a Free Sample
Fill in your details and we'll send you a free sample report.
- Sample data tables & charts
- Research methodology
Need a Custom Version of This Report?
Tailor the scope, geography, or segments to your exact requirements.
- Custom geography or segment scope
- Direct access to our analyst team
Frequently Asked Questions
What is the current market size for U.S. Bacteriological Testing Market, and what is its projected size in 2032?
At what Compound Annual Growth Rate is the U.S. Bacteriological Testing Market projected to grow between 2024 and 2032?
Which U.S. Bacteriological Testing Market segment held the largest share in 2024?
What are the primary factors fueling the growth of the U.S. Bacteriological Testing Market?
Who are the leading companies in the U.S. Bacteriological Testing Market?
Table of Content
Chapter 1. Report Introduction
- 1.1 Report Description & Purpose
- 1.1.1 Report Title & Market Definition
- 1.1.2 Unique Selling Propositions (USP) & Key Differentiators
- 1.1.3 Value Proposition for Stakeholders
- 1.2 Research Objectives
- 1.2.1 Market Sizing Objectives (Volume & Revenue)
- 1.2.2 Segmentation Objectives
- 1.2.3 Competitive Intelligence Objectives
- 1.2.4 Forecast & Scenario Objectives
- 1.3 Report Scope
- 1.3.1 U.S. Bacteriological Testing Scope – Types & Subtypes Covered
- 1.3.2 Geographic Scope – Regions & Countries Covered
- 1.3.3 Historical Period, Base Year & Forecast Period (2024; forecast to 2032)
- 1.3.4 Inclusions & Exclusions
- 1.4 HS Code & Classification Framework
- 1.5 Currency, Units & Pricing Basis
- 1.6 Target Stakeholders
- 1.7 Limitations & Assumptions
Chapter 2. Executive Summary
- 2.1 Global U.S. Bacteriological Testing Market Snapshot
- 2.1.1 Market Size – Historical (2024) & Forecast (2024-2032) (2024: USD 4,877.10 million → 2032: USD 8,453.13 million)
- 2.1.2 Volume & Revenue – Global Totals
- 2.1.3 Key Market Highlights – Top Five Facts
- 2.2 U.S. Bacteriological Testing Market Segmentation Snapshot
- 2.2.1 Market Split by Region – 2024 vs. 2032
- 2.3 Competitive Snapshot
- 2.3.1 Top 10 Players by Revenue Share – 2024
- 2.3.2 Top 10 Players by Volume Share – 2024
- 2.3.3 Recent Strategic Developments (18-Month Summary)
- 2.4 Key Investment Highlights & Strategic Conclusions
Chapter 3. U.S. Bacteriological Testing Market Dynamics & Industry Analysis
- 3.1 Market Overview & Context
- 3.1.1 U.S. Bacteriological Testing Market Position in the Broader Automotive Value Chain
- 3.1.2 OEM vs. Replacement Market Dynamics
- 3.1.3 Market Maturity & Development Stage by Region
- 3.2 U.S. Bacteriological Testing Market Drivers
- 3.3 U.S. Bacteriological Testing Market Restraints & Challenges
- 3.4 U.S. Bacteriological Testing Market Opportunities
- 3.5 Porter's Five Forces Analysis
- 3.5.1 Threat of New Entrants
- 3.5.2 Bargaining Power of Suppliers
- 3.5.3 Bargaining Power of Buyers
- 3.5.4 Threat of Substitutes
- 3.5.5 Competitive Rivalry – Intensity Assessment
- 3.6 U.S. Bacteriological Testing Value Chain Analysis
- 3.6.1 Upstream – Raw Material/Input Suppliers
- 3.6.1.1 Raw Material/Input 1
- 3.6.1.2 Raw Material/Input 2
- 3.6.1.3 Raw Material/Input 3
- 3.6.2 Midstream – Production/Manufacturing/Service Delivery
- 3.6.2.1 Production/Process Overview
- 3.6.2.2 Key Facility Locations & Capacity by Manufacturer
- 3.6.3 Downstream – Distribution & End Consumer
- 3.6.3.1 Primary Channel – B2B/OEM
- 3.6.3.2 Secondary Channels – Dealer, Retail, Online, Direct
- 3.6.4 Value Chain Profitability Analysis
- 3.6.1 Upstream – Raw Material/Input Suppliers
- 3.7 PESTEL Analysis
- 3.7.1 Political Factors
- 3.7.2 Economic Factors
- 3.7.3 Social Factors
- 3.7.4 Technological Factors
- 3.7.5 Environmental Factors
- 3.7.6 Legal Factors
- 3.8 U.S. Bacteriological Testing Supply Chain Analysis
- 3.8.1 Raw Material/Input Supply Risk Assessment
- 3.8.2 Manufacturing Concentration Risk (Geographic Exposure)
- 3.8.3 Trade Disruption Impact Analysis
- 3.9 Regulatory & Policy Landscape
Note: The regulatory and policy landscape section covers regulations based on their applicability to the market, U.S. Bacteriological Testing category, geography, and scope of the study. Only regulatory frameworks with a material impact on operations, compliance, trade, sustainability, or market access are analyzed in detail.
Chapter 4. Key Investment Pockets & Opportunity Analysis
- 4.1 U.S. Bacteriological Testing Market Attractiveness Analysis
- 4.1.1 By Region – Investment Attractiveness Matrix (Volume × CAGR)
- 4.2 Absolute Revenue Growth Opportunity
- 4.2.1 By Region – Absolute USD Growth Through 2032
- 4.3 Incremental Volume Opportunity
- 4.3.1 By Region – Incremental Volume Through 2032
- 4.3.2 Segment – Incremental Volume
- 4.4 Emerging Submarket Opportunity Deep Dive (Subject to Applicability)
- 4.5 Emerging Market Opportunity Scorecards
- 4.5.1 United States
- 4.5.2 Europe
- 4.5.3 Asia
- 4.5.4 Middle East & Africa
Note: Emerging Market Opportunity Scorecards will be included based on relevance and strategic importance. Regions listed are indicative and may vary depending on data availability and market dynamics.
Chapter 5. U.S. Bacteriological Testing Import-Export Analysis & Trade Flows
- 5.1 Global Trade Overview
- 5.1.1 Global Export Value by Country (2024)
- 5.1.2 Global Export Volume by Country (2024)
- 5.1.3 Global Import Value by Country (2024)
- 5.1.4 Global Import Volume by Country (2024)
- 5.1.5 Net Trade Balance by Country (2024)
- 5.2 Export Analysis – Segment
- 5.2.1 Type 1 (HS Code)
- 5.2.2 Type 2 (HS Code)
- 5.2.3 Type 3 (HS Code)
- 5.2.4 Type 4 (HS Code)
- 5.2.5 Type 5 (HS Code)
- 5.3 Import Analysis – Segment
- 5.3.1 Type 1 (HS Code)
- 5.3.2 Type 2 (HS Code)
- 5.3.3 Type 3 (HS Code)
- 5.3.4 Type 4 (HS Code)
- 5.3.5 Type 5 (HS Code)
- 5.4 Average Unit Trade Prices
- 5.4.1 Average Export Price – Segment & Country
- 5.4.2 Average Import Price – Segment & Source Country
- 5.4.3 Price Trends (2024)
- 5.5 Key Trade Route Analysis
- 5.5.1 Trade Route 1
- 5.5.2 Trade Route 2
- 5.5.3 Trade Route 3
- 5.5.4 Trade Route 4
- 5.5.5 Trade Route 5
- 5.6 Trade Policy Impact Assessment
- 5.6.1 US Anti-Dumping & Section 301 Tariffs
- 5.6.2 EU Customs Union Impact
- 5.6.3 Major Free Trade Agreements
- 5.6.4 USMCA Rules of Origin
Note: Trade policy analysis will be included only where relevant to the U.S. Bacteriological Testing market.
Chapter 6. Competitive Landscape & Company Benchmarking
- 6.1 U.S. Bacteriological Testing Market Concentration & Structure
- 6.1.1 Herfindahl-Hirschman Index (HHI) – vs. 2024
- 6.1.2 Tier 1, Tier 2 & Tier 3 Market Structure
- 6.1.3 Global, Regional & Local Player Dynamics
- 6.2 U.S. Bacteriological Testing Market Share Analysis – 2024
- 6.2.1 Global Revenue Share by Company
- 6.2.2 Global Volume Share by Company
- 6.2.3 Regional Revenue Share
- 6.2.4 Market Share Evolution ( vs. 2024)
- 6.2.5 OEM Segment Share by Company
- 6.2.6 Replacement Segment Share by Company
- 6.3 Production/Delivery Capacity & Facility Analysis
- 6.3.1 Global Installed Capacity
- 6.3.2 Capacity Utilization Rates
- 6.3.3 Production/Output Volume
- 6.3.4 Facility Locations & Capacity Map
- 6.3.5 Planned Capacity Additions
- 6.4 U.S. Bacteriological Testing Competitive Benchmarking Matrix
- 6.4.1 Revenue, Volume, CAGR & Profitability Comparison
- 6.4.2 Channel Revenue Mix
- 6.4.3 Geographic Revenue Exposure
- 6.4.4 R&D Intensity
- 6.4.5 Sustainability Maturity
- 6.5 Strategic Developments in U.S. Bacteriological Testing (Last 24 Months)
- 6.5.1 Mergers, Acquisitions & Divestments
- 6.5.2 New U.S. Bacteriological Testing Launches
- 6.5.3 Facility Expansions
- 6.5.4 Strategic Alliances, Joint Ventures & Partnerships
- 6.5.5 Distribution Expansion & Market Entry
- 6.5.6 Sustainability & ESG Initiatives
- 6.6 Competitive Strategy Mapping
- 6.6.1 Leader, Challenger, Follower & Niche Classification
- 6.6.2 Pricing Strategy Comparison
- 6.6.3 Channel Strategy Matrix
Note: Strategic developments are included based on their materiality and the availability of reliable information.
Chapter 7. Global U.S. Bacteriological Testing Market – By Distribution Channel
- 7.1 Segment Overview
- 7.1.1 Volume & Revenue Split by Channel (2024 & 2032)
- 7.1.2 Channel Mix Evolution (2024-2032)
Chapter 8. Regional Market Analysis – Global Overview
- 8.1 Global Regional Overview
- 8.1.1 Regional Volume Share
- 8.1.2 Regional Revenue Share
- 8.1.3 Regional Volume by Region
- 8.1.4 Regional Revenue by Region
- 8.1.5 Regional Forecast Through 2032
- 8.2 Cross-Regional Segment Analysis
- 8.2.1 By Distribution Channel
- 8.2.2 By Brand/Price Tier
Chapter 9. North America U.S. Bacteriological Testing Market
- 9.1 United States
- 9.2 Canada
- 9.3 Mexico
Chapter 10. Europe U.S. Bacteriological Testing Market
- 10.1 Germany
- 10.2 France
- 10.3 Italy
- 10.4 United Kingdom
- 10.5 Spain
- 10.6 Poland
- 10.7 Russia
- 10.8 Netherlands
- 10.9 Belgium
- 10.10 Sweden
- 10.11 Denmark
- 10.12 Norway
- 10.13 Rest of Europe
Chapter 11. Asia Pacific U.S. Bacteriological Testing Market
- 11.1 China
- 11.2 India
- 11.3 Japan
- 11.4 South Korea
- 11.5 Thailand
- 11.6 Indonesia
- 11.7 Vietnam
- 11.8 Malaysia
- 11.9 Australia
- 11.10 Rest of Asia Pacific
Chapter 12. Latin America U.S. Bacteriological Testing Market
- 12.1 Brazil
- 12.2 Argentina
- 12.3 Colombia
- 12.4 Chile
- 12.5 Rest of Latin America
Chapter 13. Middle East U.S. Bacteriological Testing Market
- 13.1 Saudi Arabia
- 13.2 United Arab Emirates
- 13.3 Turkey
- 13.4 Israel
- 13.5 Iran
- 13.6 Rest of the Middle East
Chapter 14. Africa U.S. Bacteriological Testing Market
- 14.1 South Africa
- 14.2 Egypt
- 14.3 Nigeria
- 14.4 Morocco
- 14.5 Rest of Africa
Chapter 15. U.S. Bacteriological Testing Company Profiles
- 15.1 [Company 01]
- 15.1.1 Company Overview
- 15.1.2 Key Management Personnel
- 15.1.3 Products & Services Portfolio
- 15.1.4 Financial Performance
- 15.1.5 Key Market Focus & Geographic Presence
- 15.1.6 Recent Developments & Strategic Initiatives
Note: The company profile list is preliminary and may change based on research findings, market developments, data availability, and client requirements.
Chapter 16. Appendices
- Appendix A – List of Abbreviations & Acronyms
- Appendix B – Industry Classification Code Reference – Full Series
- Appendix C – Production & Capacity Data Tables
- Appendix D – End-Use & Demand Base Tables
- Appendix E – Consumption & Replacement Rate Assumptions
- Appendix F – ASP Reference Tables
- Appendix G – Manufacturing & Facility Database
- Appendix H – Import-Export Data Tables
- Appendix I – Regulatory Summary Tables
- Appendix J – Primary Research Participant List (Anonymized)
- Appendix K – Primary Research Questionnaire Framework
- Appendix L – Data Sources & Bibliography
- Appendix M – Market Size Divergence & Source Comparison
Chapter 17. Research Methodology
- 17.1 Research Framework & Philosophy
- 17.2 Secondary Research – Sources, Hierarchy & Data Extraction
- 17.3 Data Modeling – Bottom-Up & Top-Down Market Sizing
- 17.4 Primary Research – Stakeholder Framework, LOI & Sample Sizes
- 17.5 Forecast Methodology – Regression, Scenario & Sensitivity Analysis
- 17.6 Quality Control – Four-Layer Validation Framework
- 17.7 Limitations & Standard Assumptions
- 17.8 Disclaimer
