
U.S. Insulation Market Overview:
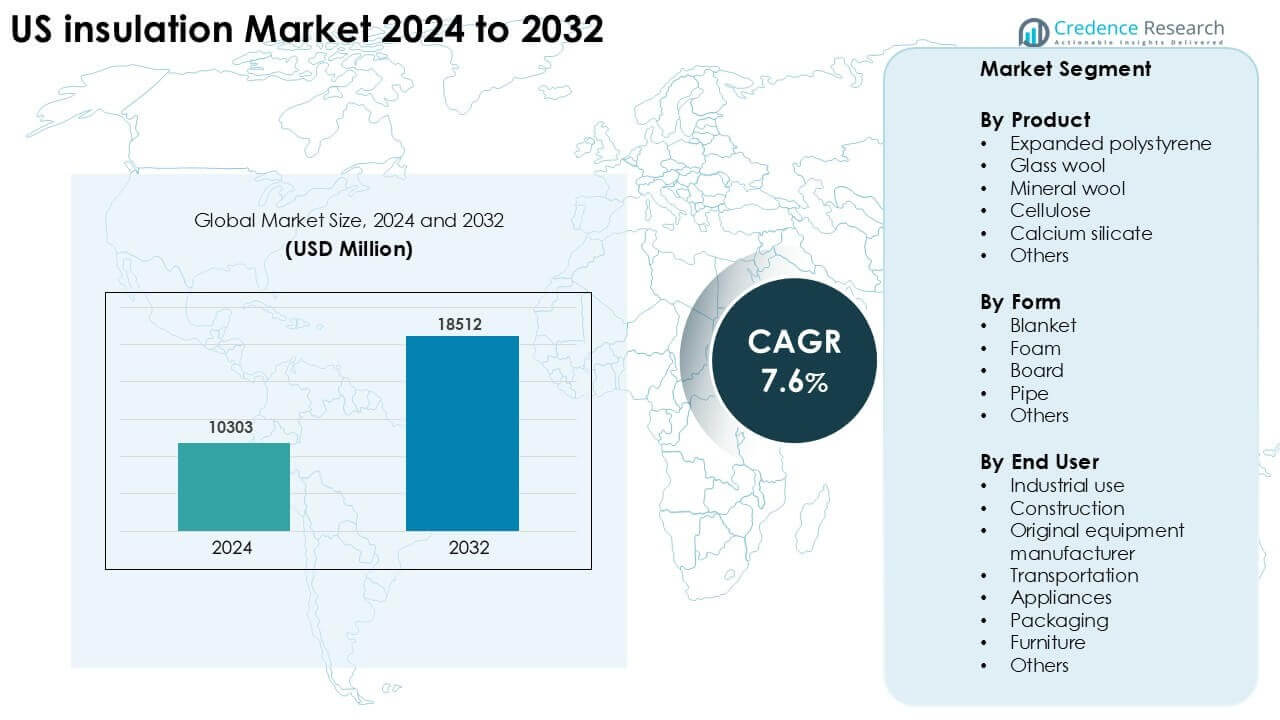
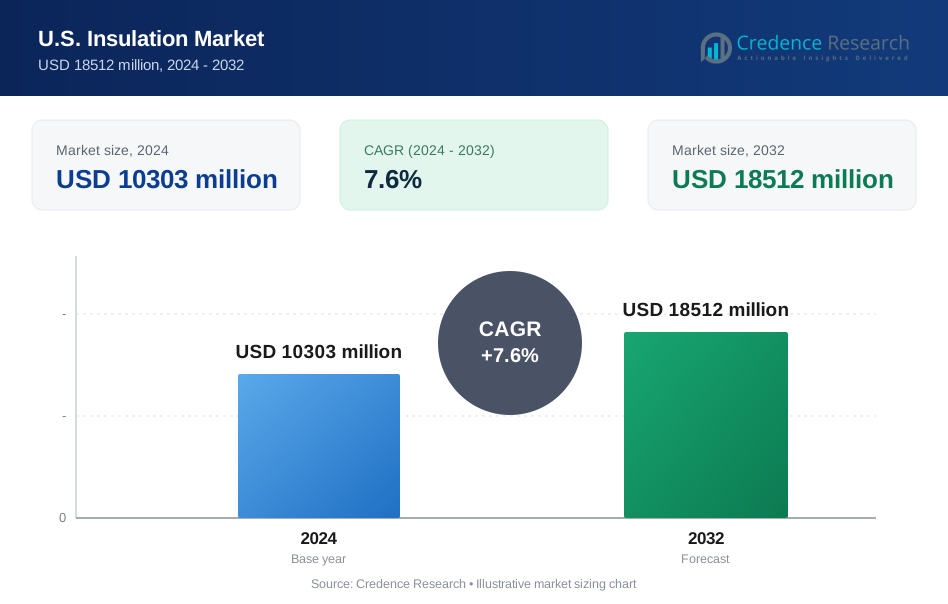
US insulation Market was valued at USD 10303 million in 2024 and is anticipated to reach USD 18512 million by 2032, growing at a CAGR of 7.6% during the forecast period.
| REPORT ATTRIBUTE | DETAILS |
|---|---|
| Historical Period | 2020-2024 |
| Base Year | 2025 |
| Forecast Period | 2026-2032 |
| U.S. Insulation Market Size 2024 | USD 10303 million |
| U.S. Insulation Market, CAGR | 7.6% |
| U.S. Insulation Market Size 2032 | USD 18512 million |
U.S. Insulation Market Insights
- Strong drivers include stricter energy-efficiency codes, rising residential renovations, and higher demand for moisture-resistant and fire-rated insulation across buildings and industrial systems.
- Key trends highlight rapid adoption of recycled and eco-friendly materials, growth in high-performance foam and mineral wool, and increased uptake of advanced sealing systems for modern construction.
- Competitive activity remains intense among Owens Corning, Johns Manville, BASF, Kingspan Group, Knauf Insulation, and others, with firms expanding product lines, improving sustainability profiles, and strengthening regional distribution networks.
- Regionally, the Midwest leads with 29% share due to older building stock and strong industrial activity, while blanket insulation dominates the form segment at 38%, and glass wool leads the product segment at 32%.
U.S. Insulation Market Segmentation Analysis:
By Product
Glass wool leads the product segment with about 32% share in the US insulation market in 2024. Demand stays strong due to wide use in residential and commercial buildings. The material offers solid thermal resistance and fire safety, which supports building code compliance. Expanded polystyrene and mineral wool show steady growth in new construction. Cellulose gains attention as a recycled option. Calcium silicate remains important in high-temperature industrial systems. Rising energy-efficiency rules continue to support glass wool adoption in large volumes.
- For instance, Owens Corning products Fiberglass™ insulation batts with R‑values such as R‑13, R‑15, R‑19 and up to R‑38 in products sized for wall and attic applications, delivering industry‑standard thermal resistance in specified thickness.
By Form
Blanket insulation dominates the form segment with nearly 38% market share in 2024. Builders prefer blankets for quick installation in walls, roofs, and attics. The format offers easy handling, low cost, and strong coverage across residential upgrades. Foam products grow in advanced sealing and moisture-control projects. Boards support commercial structures that need higher rigid strength. Pipe insulation expands in HVAC and industrial networks. Broader weatherization programs keep blanket insulation ahead across new and retrofit work.
- For instance, Owens Corning PINK Next Gen™ Fiberglass™ blanket insulation is offered with defined R‑values such as R‑11 at ~3.5 inches thick and R‑19 at ~6.25 inches thick, enabling insulation installers to match thermal performance to wall and attic cavity sizes.
By End User
Construction is the dominant end-user segment, holding close to 46% share in 2024. Growth comes from rising residential starts and commercial upgrades focused on energy savings. Federal and state efficiency standards increase insulation demand across new houses and public buildings. Industrial users follow due to the need for heat-loss control. OEMs use insulation in equipment, appliances, and machinery. Transportation applications grow with electric vehicle battery protection. Packaging and furniture segments add niche demand. Strong building activity places construction at the top.
Key Growth Drivers
Energy-Efficiency Regulations and Building Code Compliance
Strict federal and state energy-efficiency rules drive strong demand in the US insulation market. Builders must meet higher thermal performance levels under IECC and ASHRAE standards, which increases the use of advanced insulation materials across residential and commercial projects. Public incentives for weatherization and energy-saving retrofits push homeowners toward higher R-value products. Commercial spaces also upgrade insulation to reduce long-term utility costs and meet sustainability goals. Insulation manufacturers respond with improved materials that offer stronger resistance and better fire performance. These policies create steady, recurring demand across both new construction and renovation cycles.
- For instance, Johns Manville manufactures formaldehyde-free fiberglass batts with a labeled R-value of R-13 at a 3½-inch thickness, designed for standard 2x4 wood-framed walls.
Growth in Residential Construction and Renovation Activities
New housing starts, home repairs, and remodeling projects remain key growth drivers for the US insulation market. Homeowners focus on lowering heating and cooling bills, which increases interest in attic, roof, and wall insulation upgrades. Federal tax credits and state-level rebate programs accelerate retrofit activity. Rising adoption of energy-efficient home designs boosts demand for blanket, foam, and rigid insulation. Increased awareness of indoor comfort and sound control further supports uptake. These trends create strong momentum across single-family homes, multifamily buildings, and aging residential structures that require thermal upgrades.
- For instance, CertainTeed’s fiberglass insulation products offered for new single‑family construction are made in standard R‑values such as R‑19 for walls and R‑49 for attics to help builders meet recommended values in US building codes for attic and wall insulation levels.
Industrial Expansion and Demand for High-Performance Materials
Industrial facilities require effective insulation to control heat loss, improve process efficiency, and enhance worker safety. Growth in chemicals, power generation, food processing, and oil and gas sectors fuels demand for materials like mineral wool, calcium silicate, and high-temperature boards. Increasing maintenance and equipment upgrades in industrial plants support steady replacement demand. Companies also focus on reducing operational emissions, which raises the need for insulation in steam systems, boilers, and pipelines. Broader investments in manufacturing and energy infrastructure strengthen long-term market growth, especially in high-performance industrial insulation solutions.
Key Trends & Opportunities
Rising Adoption of Green and Recycled Insulation Materials
Environmental awareness drives interest in low-carbon and recycled insulation products across the US. Manufacturers expand portfolios of cellulose, recycled glass wool, and bio-based foam to support sustainability targets. Green building programs such as LEED and ENERGY STAR motivate developers to choose eco-friendly solutions. Demand grows further as states push for reduced embodied carbon in construction. Expanding availability of eco-certified materials creates new business opportunities.
- For instance, US Greenfiber’s cellulose insulation is manufactured from recycled paper with a declared R‑value of 3.7 per inch, and products carry HPD, EPD and USDA Certified Biobased labels that contribute to LEED points for sustainable construction.
Growth of Smart and High-Performance Insulation Technologies
Advances in material science create new opportunities for high-performance foam, aerogel-based systems, and reflective insulation. These solutions meet growing expectations for better thermal resistance and moisture control in modern buildings. Smart insulation systems with integrated sensors gain attention in large commercial sites. Adoption rises as builders aim to enhance energy savings and meet stricter efficiency benchmarks.
- For instance, Armacell’s ArmaGel XGH aerogel insulation blanket is engineered for industrial and building applications with a maximum operating temperature up to 650 °C and extremely low thermal conductivity (as low as 0.021 W/m·K under standard test conditions), enabling ultra‑efficient thermal performance in constrained spaces.
Key Challenges
Volatile Raw Material Prices Across Foam and Fiber Products
Fluctuations in petrochemical feedstocks affect foam insulation prices, while changes in glass and mineral wool inputs raise production costs. Manufacturers face pressure to adjust pricing without hurting demand. Sudden cost swings challenge supply planning, especially for large contractors and OEMs. Long-term volatility continues to impact profit margins and capex decisions across producers.
Skilled Labor Shortages in Insulation Installation
Shortages of trained installers slow project timelines and raise labor costs in residential and commercial markets. Complex insulation types, such as spray foam and industrial systems, require certified technicians. Limited availability of skilled labor creates quality issues, increases rework risk, and affects adoption of advanced solutions. Persistent labor gaps remain a key constraint for large-scale deployment.
Regional Analysis
Midwestern United States
The Midwestern United States holds nearly 29% share of the US insulation market in 2024. Growth is driven by strong manufacturing activity and a large base of older residential buildings that require thermal upgrades. Cold winters increase the need for higher R-value insulation across walls, attics, and basements. Industrial plants in chemicals, food processing, and automotive sectors add steady demand for high-temperature and process insulation. Public weatherization programs further support retrofit projects in rural and urban areas. Rising commercial development in states like Illinois, Michigan, and Ohio keeps the region a key contributor to overall market expansion.
Southern United States
The Southern United States accounts for close to 27% market share in 2024, supported by rapid population growth and strong residential construction. Warm climates increase demand for insulation that improves cooling efficiency and moisture control. High migration into states such as Texas, Florida, and Georgia boosts housing starts and large-scale commercial developments. Industrial expansion in petrochemicals and manufacturing strengthens demand for specialty insulation. Building codes focused on energy savings drive adoption of upgraded materials. Frequent renovations in hurricane-prone coastal areas further raise interest in durable and moisture-resistant insulation systems across the region.
Western United States
The Western United States commands about 24% share of the US insulation market in 2024. Growth stems from strong construction activity in California, Washington, Colorado, and Arizona. Strict energy-efficiency standards, including Title 24 in California, push builders toward high-performance insulation products with stronger thermal and fire resistance properties. Rising commercial projects in tech-driven cities add consistent demand. Wildfire-risk regions adopt insulation solutions that support fire safety and heat performance. Expanding industrial facilities and infrastructure upgrades strengthen regional consumption. Increased focus on sustainable and recycled materials also accelerates market growth across western states.
Northeastern United States
The Northeastern United States holds around 20% market share in 2024, supported by dense urban infrastructure and older building stock. Harsh winters drive strong demand for thermal insulation across residential and commercial spaces. Retrofit activity remains high due to aging homes in New York, Massachusetts, Pennsylvania, and New Jersey. Energy-efficiency mandates push property owners to upgrade insulation in walls, roofs, and mechanical systems. Commercial real estate modernization and public building renovations add further demand. Industrial users in pharmaceuticals and food processing also contribute steady consumption, keeping the Northeast a stable and mature regional market.
U.S. Insulation Market Segmentations:
By Product
- Expanded polystyrene
- Glass wool
- Mineral wool
- Cellulose
- Calcium silicate
- Others
By Form
- Blanket
- Foam
- Board
- Pipe
- Others
By End User
- Industrial use
- Construction
- Original equipment manufacturer
- Transportation
- Appliances
- Packaging
- Furniture
- Others
By Geography
- Midwestern United States
- Southern United States
- Western United States
- Northeastern United States
Competitive Landscape
The US insulation market features strong competition among leading manufacturers such as Owens Corning, Johns Manville, BASF, Kingspan Group, Knauf Insulation, GAF, 3M, Huntsman International, Saint Gobain, and Cellofoam North America. These companies focus on advanced thermal, acoustic, and fire-resistant solutions to meet tightening energy-efficiency standards across residential, commercial, and industrial sectors.
Large players invest in material innovation, including high-performance foam, mineral wool, recycled insulation, and spray-applied systems. Many firms expand regional manufacturing capacity to ensure faster delivery and stable supply. Sustainability strategies play a major role, with producers increasing recycled content and low-emission product lines to align with green building codes.
Partnerships with builders, HVAC contractors, and OEMs strengthen market reach. Continuous R&D, certification compliance, and tailored solutions for cold and warm climates help major brands maintain leadership in a competitive environment.
Key Player Analysis
- Johns Manville
- BASF
- Owens Corning
- Kingspan Group
- Huntsman International LLC
- GAF
- Saint Gobain
- Cellofoam North America, Inc.
- Knauf Insulation
- 3M
Recent Developments
- In December 2025, Product launch: WALLTITE® RSB BASF launched a new sustainable spray polyurethane foam insulation product called WALLTITE® RSB in the U.S., made with recycled and renewable content to support lower carbon footprint and green building standards.
- In July 2025, Cellofoam North America, Inc. Cellofoam secured certification for a zero-ozone-depletion foam formulation for HVAC duct insulation. The new foam exceeds upcoming environmental rules and supports greener mechanical insulation in US buildings.
- In February 2025, Johns Manville Announced new production line in Georgia Johns Manville (JM) announced plans to build a new Climate Pro® blown-in fiberglass insulation production line at its facility in Winder, Georgia, to help meet rising demand for blown insulation products; construction is expected to begin in early 2026 with operations targeted for mid-2027.
Report Coverage
The research report offers an in-depth analysis based on Product, Form, End-User and Geography. It details leading market players, providing an overview of their business, product offerings, investments, revenue streams, and key applications. Additionally, the report includes insights into the competitive environment, SWOT analysis, current market trends, as well as the primary drivers and constraints. Furthermore, it discusses various factors that have driven market expansion in recent years. The report also explores market dynamics, regulatory scenarios, and technological advancements that are shaping the industry. It assesses the impact of external factors and global economic changes on market growth. Lastly, it provides strategic recommendations for new entrants and established companies to navigate the complexities of the market.
Future Outlook
- Energy-efficiency rules will continue to push higher insulation usage across new buildings.
- Retrofit demand will rise as aging homes and commercial spaces undergo thermal upgrades.
- Eco-friendly and recycled insulation materials will gain stronger adoption nationwide.
- High-performance foam and mineral wool will expand in advanced construction and industrial projects.
- Demand for moisture- and fire-resistant systems will grow in climate-sensitive regions.
- Smart insulation technologies with sensors will see gradual uptake in large facilities.
- Manufacturers will increase local production to stabilize supply and reduce lead times.
- Industrial insulation needs will rise with new manufacturing and energy infrastructure projects.
- Public incentives for weatherization will support long-term residential market growth.
- Rising focus on carbon reduction will accelerate adoption of low-emission and sustainable insulation solutions.
Request a Free Sample
Fill in your details and we'll send you a free sample report.
- Sample data tables & charts
- Research methodology
Need a Custom Version of This Report?
Tailor the scope, geography, or segments to your exact requirements.
- Custom geography or segment scope
- Direct access to our analyst team
Frequently Asked Questions
What is the current market size for US insulation Market, and what is its projected size in 2032?
At what Compound Annual Growth Rate is US insulation Market projected to grow between 2024 and 2032?
Which US insulation Market segment held the largest share in 2024?
What are the primary factors fueling the growth of US insulation Market?
Who are the leading companies in US insulation Market?
Which region commanded the largest share of US insulation Market?
Table of Content
Chapter 1. Report Introduction
- 1.1 Report Description & Purpose
- 1.1.1 Report Title & Market Definition
- 1.1.2 Unique Selling Propositions (USP) & Key Differentiators
- 1.1.3 Value Proposition for Stakeholders
- 1.2 Research Objectives
- 1.2.1 Market Sizing Objectives (Volume & Revenue) (Volume Where Applicable)
- 1.2.2 Segmentation Objectives
- 1.2.3 Competitive Intelligence Objectives
- 1.2.4 Forecast & Scenario Objectives
- 1.3 Report Scope
- 1.3.1 U.S. Insulation Scope – Segments & Subsegments Covered
- 1.3.2 Geographic Scope – Regions & Countries Covered
- 1.3.3 Historical Period, Base Year & Forecast Period (2024; forecast to 2032)
- 1.3.4 Inclusions & Exclusions
- 1.4 Industry Classification & Applicable Codes
- 1.5 Currency, Measurement Units & Valuation Basis
- 1.6 Target Stakeholders
- 1.7 Limitations & Assumptions
Chapter 2. Executive Summary
- 2.1 Global U.S. Insulation Market Snapshot
- 2.1.1 Market Size – Historical (2024) & Forecast (2024-2032) (2024: USD 10303 million → 2032: USD 18512 million)
- 2.1.2 Volume & Revenue – Global Totals (Volume Where Applicable)
- 2.1.3 Key Market Highlights – Top Five Facts
- 2.2 U.S. Insulation Market Segmentation Snapshot
- 2.2.1 Market Split by Region – 2024 vs. 2032
- 2.3 Competitive Snapshot
- 2.3.1 Top 10 Players by Revenue Share – 2024
- 2.3.2 Top 10 Players by Volume Share – 2024 (Volume Where Applicable)
- 2.3.3 Recent Strategic Developments (18-Month Summary)
- 2.4 Key Investment Highlights & Strategic Conclusions
Chapter 3. U.S. Insulation Market Dynamics & Industry Analysis
- 3.1 Market Overview & Context
- 3.1.1 U.S. Insulation Market Position in the Broader Industry Value Chain
- 3.1.2 Demand Structure & Purchasing Dynamics
- 3.1.3 Market Maturity & Development Stage by Region
- 3.2 U.S. Insulation Market Drivers
- 3.3 U.S. Insulation Market Restraints & Challenges
- 3.4 U.S. Insulation Market Opportunities
- 3.5 Porter's Five Forces Analysis
- 3.5.1 Threat of New Entrants
- 3.5.2 Bargaining Power of Suppliers
- 3.5.3 Bargaining Power of Buyers
- 3.5.4 Threat of Substitutes
- 3.5.5 Competitive Rivalry – Intensity Assessment
- 3.6 U.S. Insulation Value Chain Analysis
- 3.6.1 Upstream – Key Inputs, Resources & Suppliers
- 3.6.1.1 Key Input/Resource 1
- 3.6.1.2 Key Input/Resource 2
- 3.6.1.3 Key Input/Resource 3
- 3.6.2 Midstream – Core Operations & Value Creation
- 3.6.2.1 Operating Model & Process Overview
- 3.6.2.2 Key Operating Locations & Capabilities by Company
- 3.6.3 Downstream – Market Channels & End Users
- 3.6.3.1 Direct Sales & Customer Engagement Channels
- 3.6.3.2 Indirect Sales, Intermediaries & Partner Channels
- 3.6.4 Value Chain Profitability Analysis
- 3.6.1 Upstream – Key Inputs, Resources & Suppliers
- 3.7 PESTEL Analysis
- 3.7.1 Political Factors
- 3.7.2 Economic Factors
- 3.7.3 Social Factors
- 3.7.4 Technological Factors
- 3.7.5 Environmental Factors
- 3.7.6 Legal Factors
- 3.8 U.S. Insulation Supply Chain Analysis
- 3.8.1 Critical Input & Resource Availability Risk Assessment
- 3.8.2 Supplier & Operational Concentration Risk (Geographic Exposure)
- 3.8.3 Supply & Service Disruption Impact Analysis
- 3.9 Regulatory & Policy Landscape
Note: The regulatory and policy landscape section covers regulations based on their applicability to the market, U.S. Insulation category, geography, and scope of the study. Only regulatory frameworks with a material impact on operations, compliance, trade, sustainability, or market access are analyzed in detail.
Chapter 4. Key Investment Pockets & Opportunity Analysis
- 4.1 U.S. Insulation Market Attractiveness Analysis
- 4.1.1 By Region – Investment Attractiveness Matrix (Market Size × CAGR)
- 4.2 Absolute Revenue Growth Opportunity
- 4.2.1 By Region – Absolute Revenue Growth Through 2032
- 4.3 Incremental Demand Opportunity
- 4.3.1 By Region – Incremental Demand Through 2032
- 4.3.2 Segment – Incremental Demand
- 4.4 Emerging Submarket Opportunity Deep Dive (Subject to Applicability)
- 4.5 Priority Market Opportunity Scorecards
- 4.5.1 United States
- 4.5.2 Europe
- 4.5.3 Asia
- 4.5.4 Middle East & Africa
Note: Priority market opportunity scorecards reflect the geographic scope and strategic relevance of the study. Listed markets are indicative and may be adapted to the industry.
Chapter 5. U.S. Insulation Cross-Border Trade & Market Access Analysis
- 5.1 International Trade & Cross-Border Activity Overview
- 5.1.1 Global Export Value by Country (2024)
- 5.1.2 Global Export Volume by Country (2024) (Volume Where Applicable)
- 5.1.3 Global Import Value by Country (2024)
- 5.1.4 Global Import Volume by Country (2024) (Volume Where Applicable)
- 5.1.5 Net Trade Balance by Country (2024)
- 5.2 Export Analysis – Segment
- 5.2.1 Category 1 (Applicable Classification Code)
- 5.2.2 Category 2 (Applicable Classification Code)
- 5.2.3 Category 3 (Applicable Classification Code)
- 5.2.4 Category 4 (Applicable Classification Code)
- 5.2.5 Category 5 (Applicable Classification Code)
- 5.3 Import Analysis – Segment
- 5.3.1 Category 1 (Applicable Classification Code)
- 5.3.2 Category 2 (Applicable Classification Code)
- 5.3.3 Category 3 (Applicable Classification Code)
- 5.3.4 Category 4 (Applicable Classification Code)
- 5.3.5 Category 5 (Applicable Classification Code)
- 5.4 Cross-Border Pricing & Transaction Benchmarks
- 5.4.1 Export Pricing – Segment & Country
- 5.4.2 Import Pricing – Segment & Source Country
- 5.4.3 Price Trends (2024)
- 5.5 Key Cross-Border Trade & Delivery Routes
- 5.5.1 Cross-Border Trade/Delivery Route 1
- 5.5.2 Cross-Border Trade/Delivery Route 2
- 5.5.3 Cross-Border Trade/Delivery Route 3
- 5.5.4 Cross-Border Trade/Delivery Route 4
- 5.5.5 Cross-Border Trade/Delivery Route 5
- 5.6 Trade Policy & Market Access Impact Assessment
- 5.6.1 Tariff & Non-Tariff Barriers
- 5.6.2 Regional Trade & Economic Integration Frameworks
- 5.6.3 Bilateral & Multilateral Trade Agreements
- 5.6.4 Cross-Border Operating, Licensing & Localization Requirements
Note: This chapter applies where cross-border trade or delivery is relevant to U.S. Insulation. Goods, services, and digital offerings are assessed using applicable classifications and transaction measures. Import-export volumes, trade balances, and route analyses are included only where meaningful to the market.
Chapter 6. Competitive Landscape & Company Benchmarking
- 6.1 U.S. Insulation Market Concentration & Structure
- 6.1.1 Herfindahl-Hirschman Index (HHI) – vs. 2024
- 6.1.2 Leading, Mid-Sized & Emerging Player Structure
- 6.1.3 Global, Regional & Local Player Dynamics
- 6.2 U.S. Insulation Market Share Analysis – 2024
- 6.2.1 Global Revenue Share by Company
- 6.2.2 Global Volume Share by Company (Volume Where Applicable)
- 6.2.3 Regional Revenue Share
- 6.2.4 Market Share Evolution ( vs. 2024)
- 6.2.5 Company Market Share by Key Segment
- 6.2.6 Company Market Share by Customer Group
- 6.3 Operating Scale, Capacity & Infrastructure Analysis
- 6.3.1 Global Operating Scale & Supply Capacity
- 6.3.2 Resource Utilization & Operating Efficiency
- 6.3.3 Output, Service Delivery & Activity Metrics
- 6.3.4 Operating Footprint & Infrastructure Map
- 6.3.5 Planned Operational & Capacity Expansion
- 6.4 U.S. Insulation Competitive Benchmarking Matrix
- 6.4.1 Revenue, Growth, Profitability & Operating Metric Comparison
- 6.4.2 Channel Revenue Mix
- 6.4.3 Geographic Revenue Exposure
- 6.4.4 R&D Intensity
- 6.4.5 Sustainability Maturity
- 6.5 Strategic Developments in U.S. Insulation (Last 24 Months)
- 6.5.1 Mergers, Acquisitions & Divestments
- 6.5.2 New Products, Services & Solutions in U.S. Insulation
- 6.5.3 Operational & Infrastructure Expansions
- 6.5.4 Strategic Alliances, Joint Ventures & Partnerships
- 6.5.5 Distribution Expansion & Market Entry
- 6.5.6 Sustainability & ESG Initiatives
- 6.6 Competitive Strategy Mapping
- 6.6.1 Leader, Challenger, Follower & Niche Classification
- 6.6.2 Pricing Strategy Comparison
- 6.6.3 Channel Strategy Matrix
Note: Strategic developments are included based on their materiality and the availability of reliable information.
Chapter 7. Global U.S. Insulation Market – By Sales & Delivery Channel
- 7.1 Segment Overview
- 7.1.1 Volume & Revenue Split by Channel (2024 & 2032) (Volume Where Applicable)
- 7.1.2 Channel Mix Evolution (2024-2032)
Chapter 8. Regional Market Analysis – Global Overview
- 8.1 Global Regional Overview
- 8.1.1 Regional Volume Share (Volume Where Applicable)
- 8.1.2 Regional Revenue Share
- 8.1.3 Regional Volume by Region (Volume Where Applicable)
- 8.1.4 Regional Revenue by Region
- 8.1.5 Regional Forecast Through 2032
- 8.2 Cross-Regional Segment Analysis
- 8.2.1 By Sales & Delivery Channel
- 8.2.2 By Competitive Positioning & Price Tier
Chapter 9. North America U.S. Insulation Market
- 9.1 United States
- 9.2 Canada
- 9.3 Mexico
Chapter 10. Europe U.S. Insulation Market
- 10.1 Germany
- 10.2 France
- 10.3 Italy
- 10.4 United Kingdom
- 10.5 Spain
- 10.6 Poland
- 10.7 Russia
- 10.8 Netherlands
- 10.9 Belgium
- 10.10 Sweden
- 10.11 Denmark
- 10.12 Norway
- 10.13 Rest of Europe
Chapter 11. Asia Pacific U.S. Insulation Market
- 11.1 China
- 11.2 India
- 11.3 Japan
- 11.4 South Korea
- 11.5 Thailand
- 11.6 Indonesia
- 11.7 Vietnam
- 11.8 Malaysia
- 11.9 Australia
- 11.10 Rest of Asia Pacific
Chapter 12. Latin America U.S. Insulation Market
- 12.1 Brazil
- 12.2 Argentina
- 12.3 Colombia
- 12.4 Chile
- 12.5 Rest of Latin America
Chapter 13. Middle East U.S. Insulation Market
- 13.1 Saudi Arabia
- 13.2 United Arab Emirates
- 13.3 Turkey
- 13.4 Israel
- 13.5 Iran
- 13.6 Rest of the Middle East
Chapter 14. Africa U.S. Insulation Market
- 14.1 South Africa
- 14.2 Egypt
- 14.3 Nigeria
- 14.4 Morocco
- 14.5 Rest of Africa
Chapter 15. U.S. Insulation Company Profiles
- 15.1 [Company 01]
- 15.1.1 Company Overview
- 15.1.2 Key Management Personnel
- 15.1.3 Products & Services Portfolio
- 15.1.4 Financial Performance
- 15.1.5 Key Market Focus & Geographic Presence
- 15.1.6 Recent Developments & Strategic Initiatives
Note: The company profile list is preliminary and may change based on research findings, market developments, data availability, and client requirements.
Chapter 16. Appendices
- Appendix A – List of Abbreviations & Acronyms
- Appendix B – Industry Classification Code Reference – Full Series
- Appendix C – Supply, Output & Operating Capacity Data Tables
- Appendix D – End-Use & Demand Base Tables
- Appendix E – Demand, Adoption & Usage Assumptions
- Appendix F – Pricing & Revenue Metric Reference Tables
- Appendix G – Company Operations & Infrastructure Database
- Appendix H – Cross-Border Trade & Activity Data Tables (Where Applicable)
- Appendix I – Regulatory Summary Tables
- Appendix J – Primary Research Participant List (Anonymized)
- Appendix K – Primary Research Questionnaire Framework
- Appendix L – Data Sources & Bibliography
- Appendix M – Market Size Divergence & Source Comparison
Chapter 17. Research Methodology
- 17.1 Research Framework & Philosophy
- 17.2 Secondary Research – Sources, Hierarchy & Data Extraction
- 17.3 Data Modeling – Bottom-Up & Top-Down Market Sizing
- 17.4 Primary Research – Stakeholder Framework, LOI & Sample Sizes
- 17.5 Forecast Methodology – Regression, Scenario & Sensitivity Analysis
- 17.6 Quality Control – Four-Layer Validation Framework
- 17.7 Limitations & Standard Assumptions
- 17.8 Disclaimer
