
Market Overview:
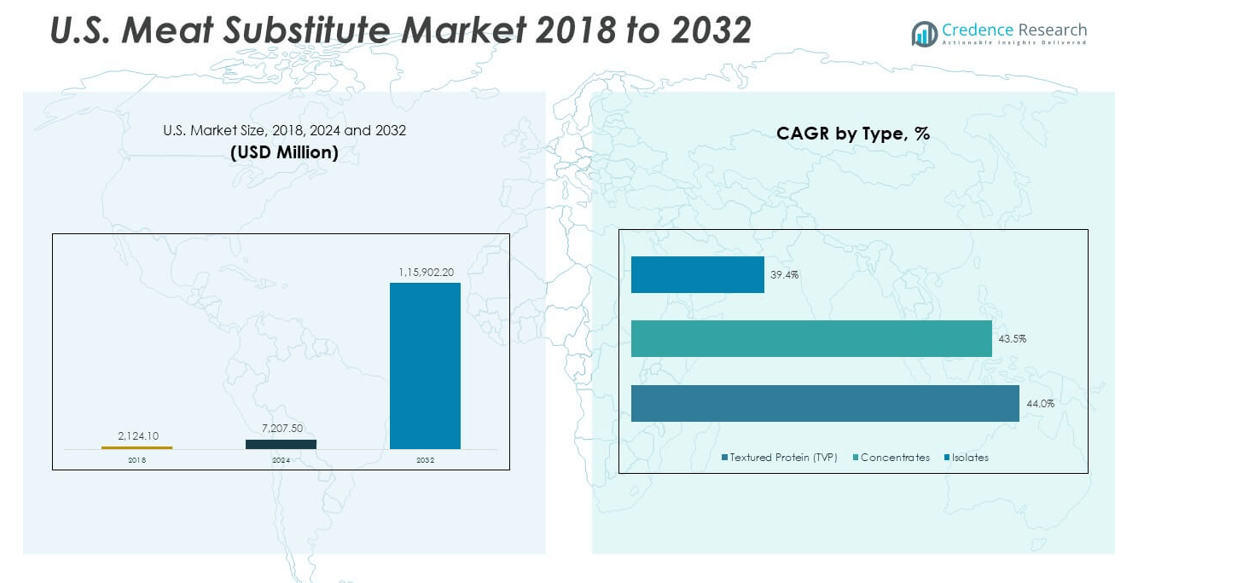
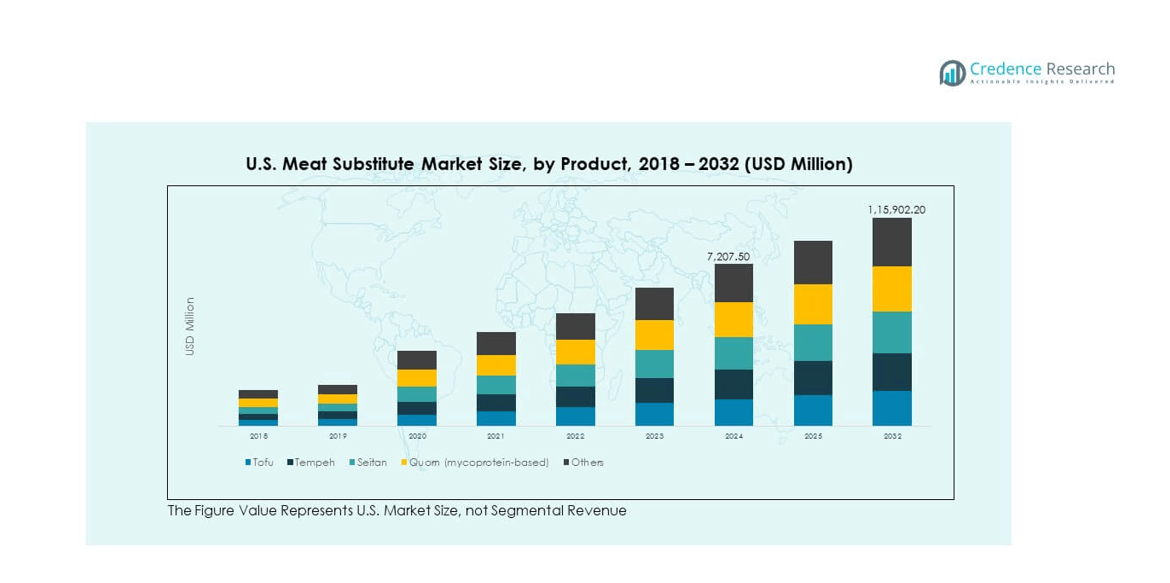
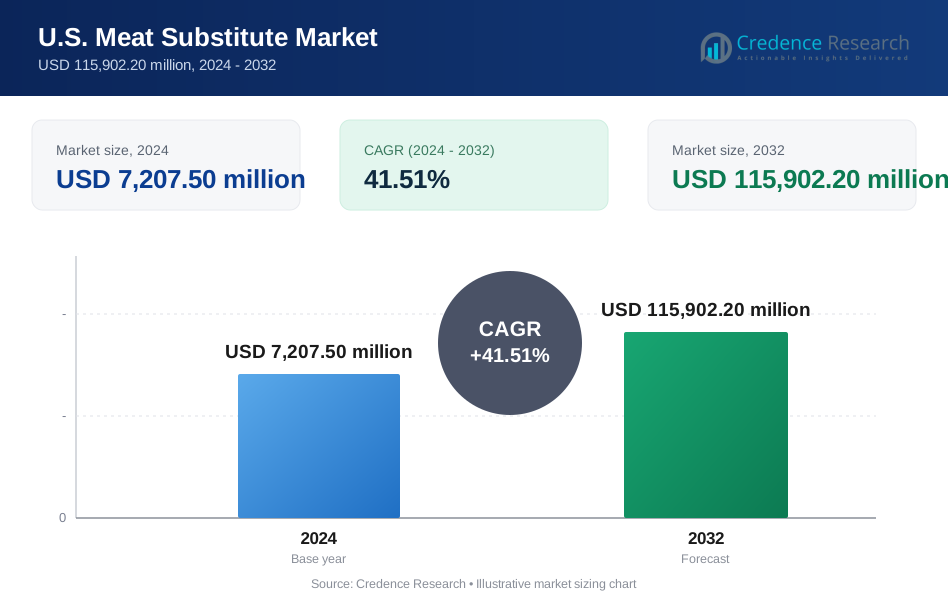
The U.S. Meat Substitute Market size was valued at USD 2,124.10 million in 2018 to USD 7,207.50 million in 2024 and is anticipated to reach USD 115,902.20 million by 2032, at a CAGR of 41.51% during the forecast period.
| REPORT ATTRIBUTE | DETAILS |
|---|---|
| Historical Period | 2020-2023 |
| Base Year | 2024 |
| Forecast Period | 2025-2032 |
| U.S. Meat Substitute Market Size 2024 | USD 7,207.50 million |
| U.S. Meat Substitute Market, CAGR | 41.15% |
| U.S. Meat Substitute Market Size 2032 | USD 115,902.20 million |
The market is expanding due to rising health awareness, ethical concerns, and sustainability goals. Consumers are shifting toward plant-based diets to reduce health risks linked to red meat consumption. Companies are responding with new product varieties, improved taste, and texture innovations to enhance consumer adoption. Increased investments in food technology, along with partnerships between food producers and retail chains, are also fueling growth. Expanding vegan and flexitarian populations further contribute to the demand for meat substitutes.
Regionally, North America holds a leading role in shaping the market’s direction, with the U.S. driving innovation and adoption. The country benefits from advanced food processing technologies, strong retail infrastructure, and high consumer awareness. Emerging opportunities are evident in Canada, where plant-based diets are gaining popularity among younger demographics. Mexico is also experiencing early-stage adoption, supported by changing urban food patterns. Together, these regions create a diverse growth landscape for meat substitute adoption across the continent.
Market Insights:
- The U.S. Meat Substitute Market was valued at USD 2,124.10 million in 2018, reached USD 7,207.50 million in 2024, and is projected to reach USD 115,902.20 million by 2032, growing at a CAGR of 41.51% during the forecast period.
- The Northeast commanded the largest share in 2024 with 28%, supported by strong urban demand, higher consumer awareness, and robust foodservice penetration. The Midwest followed with 25%, driven by wide retail networks and steady adoption, while the West held 24% owing to innovation hubs and strong vegan populations.
- The South emerged as the fastest-growing region with a 23% share in 2024, driven by rising flexitarian adoption, cultural diversity, and expanding availability in supermarkets and QSR chains.
- By product, tofu led the market with a 29% share in 2024, supported by its versatility and long-standing consumer base across U.S. households.
- Quorn (mycoprotein-based) accounted for 21% of the market share, reflecting increased consumer demand for high-protein, fiber-rich substitutes with close meat-like texture.
Market Drivers:
Rising Consumer Shift Toward Healthier Diets
The U.S. Meat Substitute Market is expanding due to a strong shift toward healthier diets. Consumers are adopting plant-based protein to reduce risks associated with red meat. Growing awareness of obesity, cardiovascular diseases, and diabetes is reinforcing this dietary change. It is gaining popularity among flexitarian and vegan populations who prefer cleaner labels. Consumers are increasingly demanding nutrient-rich products with high protein content. Food companies are introducing products with fortified vitamins and minerals to meet this demand. Strong marketing campaigns highlight the health benefits of meat substitutes.
- For instance, Beyond Meat launched its fourth-generation Beyond Burger in 2024, featuring a new recipe with 21 grams of protein per serving and a 20% reduction in sodium compared to previous formulations, and incorporating avocado oil to reduce saturated fat by 60%. Strong marketing campaigns highlight the health benefits of meat substitutes.
Growing Environmental and Ethical Concerns
The U.S. Meat Substitute Market benefits from heightened environmental and ethical awareness. Consumers are shifting to sustainable diets to reduce carbon footprints from livestock farming. Rising concern about animal cruelty is pushing adoption of plant-based diets. It is gaining support from younger populations who value sustainability in daily choices. Companies are investing in sustainable sourcing of raw materials for product development. Media campaigns highlight the positive ecological impact of reduced meat consumption. Ethical marketing is positioning meat substitutes as a responsible alternative.
- For instance, scientific studies reveal that replacing 50% of animal-based foods in U.S. diets with plant-based options could reduce annual carbon emissions equivalent to removing 47.5 million cars from the road each year, demonstrating the tangible environmental benefits of dietary shifts.
Expanding Food Innovation and Product Variety
The U.S. Meat Substitute Market is witnessing rapid innovation in product formulations and taste profiles. Companies are investing in advanced food technology to replicate meat texture and flavor. Enhanced research is improving the sensory quality of plant-based alternatives. It is creating wider acceptance among consumers seeking close substitutes to animal meat. Startups and established players are diversifying product portfolios across burgers, sausages, and nuggets. Supermarkets and restaurants are expanding plant-based menus to attract diverse audiences. Product innovation is driving repeat purchases and brand loyalty.
Support From Retail and Foodservice Expansion
The U.S. Meat Substitute Market gains traction through the growing presence in retail and foodservice. Large retailers are dedicating shelf space to plant-based protein offerings. Quick-service restaurants and fine dining chains are integrating these options into menus. It is increasing mainstream availability and consumer awareness of meat substitutes. Partnerships between food manufacturers and retail chains are enhancing product visibility. Discounts and promotional campaigns are making products more accessible to price-sensitive consumers. Expansion into convenience stores and online platforms is accelerating reach. Retail and foodservice support remains a strong growth catalyst.
Market Trends:
Increased Focus on Clean Label and Natural Ingredients
The U.S. Meat Substitute Market is shaped by demand for clean label products. Consumers prefer foods made with recognizable and natural ingredients. It is driving companies to remove artificial preservatives and synthetic additives. Labels highlighting non-GMO and organic certifications are becoming essential to brand image. Manufacturers are introducing minimally processed alternatives with healthier oil and protein blends. Transparency in sourcing is a growing priority for companies to build consumer trust. Clean label demand is strengthening long-term market growth in the United States.
- For instance, Beyond Meat received Clean Label Project Certification in 2024 for its new plant-based beef, reflecting a streamlined ingredient list and confirmation by third-party testing for ingredient purity. Transparency in sourcing is a growing priority for companies to build consumer trust.
Rising Popularity of Hybrid Meat Products
The U.S. Meat Substitute Market is seeing strong demand for hybrid meat products. These blends combine plant-based protein with small amounts of animal meat. It is attracting flexitarian consumers who want reduced but not eliminated meat intake. Hybrid formats provide familiar taste and nutritional balance at competitive prices. Manufacturers are leveraging this segment to expand their consumer base. Foodservice chains are promoting hybrid offerings to appeal to a wider audience. The trend is creating a bridge between conventional meat and full substitutes.
Integration of Meat Substitutes Into Mainstream Menus
The U.S. Meat Substitute Market is influenced by the integration into mainstream foodservice. Restaurants are adding plant-based burgers, nuggets, and sausages to standard menus. It is making these products widely accessible to everyday consumers. Fast-food chains are partnering with meat substitute producers to meet growing demand. Fine dining establishments are also experimenting with plant-based protein options. Expansion into school cafeterias and workplace canteens further broadens the consumer base. Visibility in daily dining experiences is increasing consumer confidence in these alternatives.
Advances in Alternative Protein Technologies
The U.S. Meat Substitute Market is advancing with new protein technologies. Companies are exploring fermentation, cellular agriculture, and novel plant proteins. It is helping products achieve closer resemblance to meat in taste and texture. Fermentation-derived proteins are improving nutritional profiles of substitutes. Food tech startups are receiving large investments to develop innovative processes. Established players are integrating new protein technologies to stay competitive. These advances are setting a new benchmark for the future of meat alternatives.
Market Challenges Analysis:
High Production Costs and Price Sensitivity
The U.S. Meat Substitute Market faces challenges with high production costs and consumer price sensitivity. Many plant-based products remain more expensive than traditional meat. It is limiting adoption among cost-conscious households in mainstream markets. Advanced processing and sourcing of high-quality proteins drive up manufacturing expenses. Achieving economies of scale remains a challenge for emerging companies. Consumers often compare value against affordable conventional meat options. Competitive pricing strategies are necessary for market penetration. Without cost reductions, growth potential may face limitations in mass adoption.
Taste, Texture, and Nutritional Perception Issues
The U.S. Meat Substitute Market is challenged by consumer skepticism about taste and nutrition. Some buyers perceive substitutes as inferior to animal meat in flavor and texture. It is creating barriers to repeat purchases and long-term loyalty. Achieving close resemblance requires continuous innovation and investment in R&D. Consumers also raise concerns about additives and processing levels. Misinformation around nutritional content creates hesitation in adoption. Brands must focus on clear communication and product transparency to build trust. Overcoming these barriers is crucial to expand market acceptance.
Market Opportunities:
Expansion Through Foodservice and Retail Partnerships
The U.S. Meat Substitute Market has opportunities through wider collaboration with foodservice and retail sectors. Quick-service restaurants, fine dining chains, and retailers are embracing plant-based alternatives. It is expanding visibility and normalizing these products in everyday consumption. Partnerships can accelerate consumer acceptance and build stronger brand loyalty. Retail promotions and diversified offerings will further strengthen growth prospects.
Innovation in Novel Protein Sources and Formats
The U.S. Meat Substitute Market holds opportunities in innovation with novel protein sources. Companies are exploring algae, pulses, and fermentation-based proteins for product development. It is helping expand options beyond soy and pea-based formulations. New formats such as ready-to-eat meals and snacks are gaining traction. Innovation will attract diverse consumers and increase long-term market sustainability.
Market Segmentation Analysis:
By Type
The U.S. Meat Substitute Market is segmented into textured protein (TVP), concentrates, and isolates. TVP holds a strong position due to its versatility and cost-effectiveness in meat-like applications. Concentrates are gaining traction for blending into ready-to-eat meals and snacks. Isolates dominate in premium formulations, offering high protein content with neutral taste. It benefits from expanding usage in sports nutrition and fortified foods. Manufacturers continue to invest in improving texture and taste to strengthen consumer adoption.
- For instance, TVP derived from soy or pea provides 50–70% protein content, making it a preferred institutional choice for its affordability and nutritional value. It benefits from expanding usage in sports nutrition and fortified foods. Manufacturers continue to invest in improving texture and taste to strengthen consumer adoption.
By Source
Soy protein leads the market due to its established supply chain and high protein density. Wheat protein is popular for its ability to replicate meat texture in seitan-based products. Pea protein is rapidly expanding with its non-allergenic and sustainable appeal. Other sources such as legumes, algae, and fermentation-derived proteins are emerging. It supports innovation pipelines and diversifies reliance on traditional ingredients. Companies are focusing on unique blends to balance nutrition and taste.
- For instance, the significant scale of U.S. nutrition programs demonstrates the broad application and scalability of soy and pea proteins in institutional settings. This supports innovation pipelines and diversifies reliance on traditional ingredients.
By Product
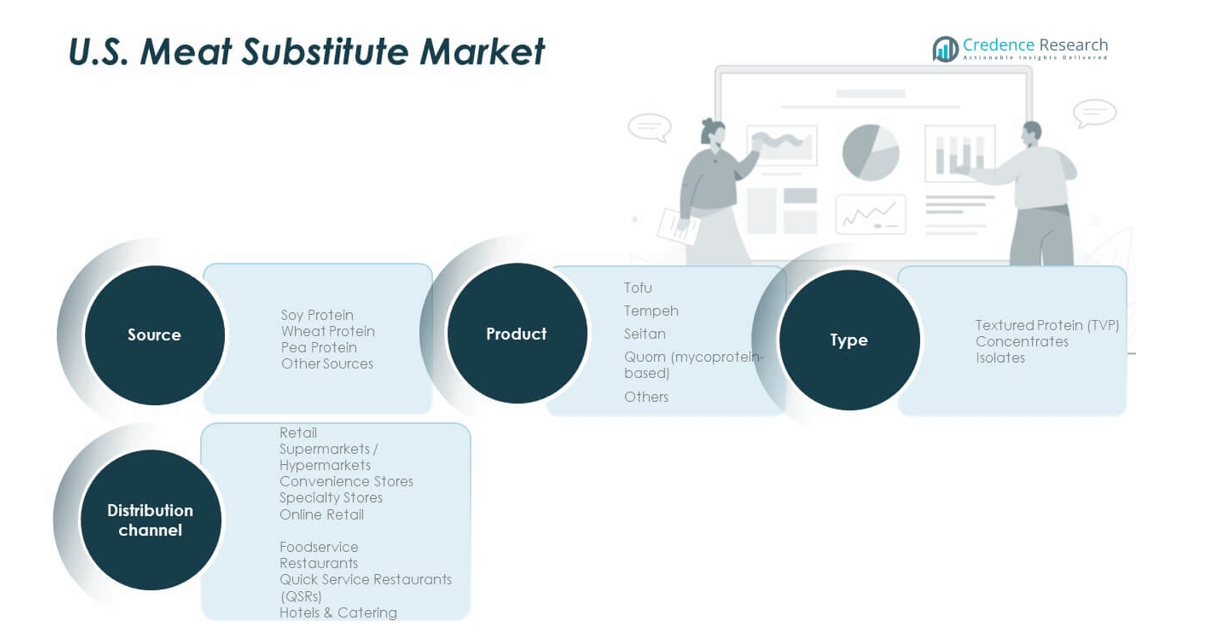
Tofu and tempeh remain traditional categories with steady consumer bases. Seitan appeals to consumers seeking authentic meat-like texture. Quorn, a mycoprotein-based product, is expanding due to high protein and fiber content. Other products, including snacks and ready-to-cook meals, are growing in retail and foodservice. It highlights consumer demand for convenience, variety, and innovation across multiple product lines.
By Distribution Channel
Retail dominates with supermarkets and hypermarkets providing extensive visibility. Convenience stores and specialty outlets target niche consumers with tailored offerings. Online retail is expanding with strong promotional campaigns and subscription models. Foodservice, led by restaurants and QSRs, integrates meat substitutes into mainstream menus. Hotels and catering services are introducing these options to diversify meal choices. It strengthens accessibility and drives consumer familiarity with meat substitute products.
Segmentation:
By Type- Textured Protein (TVP)
- Concentrates
- Isolates
- Soy Protein
- Wheat Protein
- Pea Protein
- Other Sources
- Tofu
- Tempeh
- Seitan
- Quorn (mycoprotein-based)
- Others
- Retail
- Supermarkets / Hypermarkets
- Convenience Stores
- Specialty Stores
- Online Retail
- Foodservice
- Restaurants
- Quick Service Restaurants (QSRs)
- Hotels & Catering
Regional Analysis:
Northeast Leading With Strong Market Share
The U.S. Meat Substitute Market is led by the Northeast, supported by high consumer awareness and strong health-focused demographics. It benefits from dense urban populations with greater access to supermarkets, specialty stores, and foodservice outlets. Colleges, universities, and workplace cafeterias in the region actively integrate plant-based menus, driving adoption among younger consumers. Restaurants and quick-service chains also showcase wider product availability. It remains a hub for early adoption and premium product launches, making the Northeast a critical growth center.
Midwest Showing Steady Expansion
The Midwest holds a significant share, strengthened by large-scale retail networks and growing urban demand. It is gaining momentum as consumers increasingly seek affordable and protein-rich alternatives. Local food manufacturers and distributors are expanding plant-based product lines. The region’s focus on sustainability and healthier diets is reshaping traditional consumption habits. It is also witnessing growth in quick-service restaurant integration, making products more accessible to mainstream buyers. The Midwest reflects steady expansion supported by balanced supply and demand trends.
South and West Driving Future Growth
The South and West are emerging as fast-growing regions, supported by cultural diversity and evolving dietary patterns. The West, with states like California, leads in food innovation and strong vegan consumer bases. It benefits from startup ecosystems and significant investments in food technology. The South is experiencing rising adoption through supermarkets, QSRs, and institutional foodservice. It is gaining traction among flexitarian populations seeking convenient and affordable options. Both regions highlight future potential, ensuring broader national adoption of meat substitutes.
Key Player Analysis:
- Beyond Meat
- Impossible Foods
- ADM
- Amy’s Kitchen
- Conagra Brands (Gardein)
- Kellogg’s (MorningStar Farms)
- Field Roast Grain Meat Co.
- International Flavors & Fragrances (IFF)
- Ingredion Incorporated
- Archer Daniels Midland (ADM)
- Cargill, Inc.
- DuPont (Nutrition & Biosciences)
- Glanbia Nutritionals
Competitive Analysis:
The U.S. Meat Substitute Market is highly competitive with global leaders and domestic specialists focusing on innovation, product quality, and brand positioning. It is characterized by intense rivalry among companies such as Beyond Meat, Impossible Foods, Conagra Brands, ADM, and Kellogg’s MorningStar Farms. Players compete on taste, texture, nutritional value, and pricing strategies to expand consumer bases. Partnerships with retail chains and foodservice providers are strengthening distribution networks. Startups are entering with niche offerings, while established firms leverage scale to maintain dominance. Investment in R&D and marketing remains central to sustaining competitive advantage.
Recent Developments:
- In August and September 2025, Archer Daniels Midland (ADM) implemented operational changes and invested in its Decatur, Illinois plant to strengthen its U.S. soy protein and alternative protein ingredient production for the meat substitute market.
Report Coverage:
The research report offers an in-depth analysis based on type, source, product, and distribution channel. It details leading market players, providing an overview of their business, product offerings, investments, revenue streams, and key applications. Additionally, the report includes insights into the competitive environment, SWOT analysis, current market trends, as well as the primary drivers and constraints. Furthermore, it discusses various factors that have driven market expansion in recent years. The report also explores market dynamics, regulatory scenarios, and technological advancements that are shaping the industry. It assesses the impact of external factors and global economic changes on market growth. Lastly, it provides strategic recommendations for new entrants and established companies to navigate the complexities of the market.
Future Outlook:
- Rising consumer shift toward healthier diets will drive adoption of plant-based substitutes.
- Expansion of quick-service restaurants and retail partnerships will strengthen product reach.
- Continuous R&D investment will improve taste, texture, and nutritional profiles.
- Hybrid meat substitute products will attract flexitarian consumers.
- Sustainability concerns will accelerate demand for eco-friendly protein sources.
- Growing popularity of online retail will expand direct-to-consumer channels.
- Innovation in protein technology such as fermentation will enhance product quality.
- Increased focus on clean-label and natural ingredients will shape product development.
- Foodservice integration into school, corporate, and institutional menus will boost demand.
- Strategic acquisitions and collaborations will redefine market competition and growth potential.
Request a Free Sample
Fill in your details and we'll send you a free sample report.
- Sample data tables & charts
- Research methodology
Need a Custom Version of This Report?
Tailor the scope, geography, or segments to your exact requirements.
- Custom geography or segment scope
- Direct access to our analyst team
Frequently Asked Questions
What is the current market size for U.S. Meat Substitute Market, and what is its projected size in 2032?
At what Compound Annual Growth Rate is the U.S. Meat Substitute Market projected to grow between 2024 and 2032?
Which U.S. Meat Substitute Market segment held the largest share in 2024?
What are the primary factors fueling the growth of the U.S. Meat Substitute Market?
Who are the leading companies in the U.S. Meat Substitute Market?
Table of Content
Chapter 1. Report Introduction
- 1.1 Report Description & Purpose
- 1.1.1 Report Title & Market Definition
- 1.1.2 Unique Selling Propositions (USP) & Key Differentiators
- 1.1.3 Value Proposition for Stakeholders
- 1.2 Research Objectives
- 1.2.1 Market Sizing Objectives (Volume & Revenue)
- 1.2.2 Segmentation Objectives
- 1.2.3 Competitive Intelligence Objectives
- 1.2.4 Forecast & Scenario Objectives
- 1.3 Report Scope
- 1.3.1 U.S. Meat Substitute Scope – Types & Subtypes Covered
- 1.3.2 Geographic Scope – Regions & Countries Covered
- 1.3.3 Historical Period, Base Year & Forecast Period (2024; forecast to 2032)
- 1.3.4 Inclusions & Exclusions
- 1.4 HS Code & Classification Framework
- 1.5 Currency, Units & Pricing Basis
- 1.6 Target Stakeholders
- 1.7 Limitations & Assumptions
Chapter 2. Executive Summary
- 2.1 Global U.S. Meat Substitute Market Snapshot
- 2.1.1 Market Size – Historical (2024) & Forecast (2024-2032) (2024: USD 7,207.50 million → 2032: USD 115,902.20 million)
- 2.1.2 Volume & Revenue – Global Totals
- 2.1.3 Key Market Highlights – Top Five Facts
- 2.2 U.S. Meat Substitute Market Segmentation Snapshot
- 2.2.1 Market Split by Region – 2024 vs. 2032
- 2.3 Competitive Snapshot
- 2.3.1 Top 10 Players by Revenue Share – 2024
- 2.3.2 Top 10 Players by Volume Share – 2024
- 2.3.3 Recent Strategic Developments (18-Month Summary)
- 2.4 Key Investment Highlights & Strategic Conclusions
Chapter 3. U.S. Meat Substitute Market Dynamics & Industry Analysis
- 3.1 Market Overview & Context
- 3.1.1 U.S. Meat Substitute Market Position in the Broader Automotive Value Chain
- 3.1.2 OEM vs. Replacement Market Dynamics
- 3.1.3 Market Maturity & Development Stage by Region
- 3.2 U.S. Meat Substitute Market Drivers
- 3.3 U.S. Meat Substitute Market Restraints & Challenges
- 3.4 U.S. Meat Substitute Market Opportunities
- 3.5 Porter's Five Forces Analysis
- 3.5.1 Threat of New Entrants
- 3.5.2 Bargaining Power of Suppliers
- 3.5.3 Bargaining Power of Buyers
- 3.5.4 Threat of Substitutes
- 3.5.5 Competitive Rivalry – Intensity Assessment
- 3.6 U.S. Meat Substitute Value Chain Analysis
- 3.6.1 Upstream – Raw Material/Input Suppliers
- 3.6.1.1 Raw Material/Input 1
- 3.6.1.2 Raw Material/Input 2
- 3.6.1.3 Raw Material/Input 3
- 3.6.2 Midstream – Production/Manufacturing/Service Delivery
- 3.6.2.1 Production/Process Overview
- 3.6.2.2 Key Facility Locations & Capacity by Manufacturer
- 3.6.3 Downstream – Distribution & End Consumer
- 3.6.3.1 Primary Channel – B2B/OEM
- 3.6.3.2 Secondary Channels – Dealer, Retail, Online, Direct
- 3.6.4 Value Chain Profitability Analysis
- 3.6.1 Upstream – Raw Material/Input Suppliers
- 3.7 PESTEL Analysis
- 3.7.1 Political Factors
- 3.7.2 Economic Factors
- 3.7.3 Social Factors
- 3.7.4 Technological Factors
- 3.7.5 Environmental Factors
- 3.7.6 Legal Factors
- 3.8 U.S. Meat Substitute Supply Chain Analysis
- 3.8.1 Raw Material/Input Supply Risk Assessment
- 3.8.2 Manufacturing Concentration Risk (Geographic Exposure)
- 3.8.3 Trade Disruption Impact Analysis
- 3.9 Regulatory & Policy Landscape
Note: The regulatory and policy landscape section covers regulations based on their applicability to the market, U.S. Meat Substitute category, geography, and scope of the study. Only regulatory frameworks with a material impact on operations, compliance, trade, sustainability, or market access are analyzed in detail.
Chapter 4. Key Investment Pockets & Opportunity Analysis
- 4.1 U.S. Meat Substitute Market Attractiveness Analysis
- 4.1.1 By Region – Investment Attractiveness Matrix (Volume × CAGR)
- 4.2 Absolute Revenue Growth Opportunity
- 4.2.1 By Region – Absolute USD Growth Through 2032
- 4.3 Incremental Volume Opportunity
- 4.3.1 By Region – Incremental Volume Through 2032
- 4.3.2 Segment – Incremental Volume
- 4.4 Emerging Submarket Opportunity Deep Dive (Subject to Applicability)
- 4.5 Emerging Market Opportunity Scorecards
- 4.5.1 United States
- 4.5.2 Europe
- 4.5.3 Asia
- 4.5.4 Middle East & Africa
Note: Emerging Market Opportunity Scorecards will be included based on relevance and strategic importance. Regions listed are indicative and may vary depending on data availability and market dynamics.
Chapter 5. U.S. Meat Substitute Import-Export Analysis & Trade Flows
- 5.1 Global Trade Overview
- 5.1.1 Global Export Value by Country (2024)
- 5.1.2 Global Export Volume by Country (2024)
- 5.1.3 Global Import Value by Country (2024)
- 5.1.4 Global Import Volume by Country (2024)
- 5.1.5 Net Trade Balance by Country (2024)
- 5.2 Export Analysis – Segment
- 5.2.1 Type 1 (HS Code)
- 5.2.2 Type 2 (HS Code)
- 5.2.3 Type 3 (HS Code)
- 5.2.4 Type 4 (HS Code)
- 5.2.5 Type 5 (HS Code)
- 5.3 Import Analysis – Segment
- 5.3.1 Type 1 (HS Code)
- 5.3.2 Type 2 (HS Code)
- 5.3.3 Type 3 (HS Code)
- 5.3.4 Type 4 (HS Code)
- 5.3.5 Type 5 (HS Code)
- 5.4 Average Unit Trade Prices
- 5.4.1 Average Export Price – Segment & Country
- 5.4.2 Average Import Price – Segment & Source Country
- 5.4.3 Price Trends (2024)
- 5.5 Key Trade Route Analysis
- 5.5.1 Trade Route 1
- 5.5.2 Trade Route 2
- 5.5.3 Trade Route 3
- 5.5.4 Trade Route 4
- 5.5.5 Trade Route 5
- 5.6 Trade Policy Impact Assessment
- 5.6.1 US Anti-Dumping & Section 301 Tariffs
- 5.6.2 EU Customs Union Impact
- 5.6.3 Major Free Trade Agreements
- 5.6.4 USMCA Rules of Origin
Note: Trade policy analysis will be included only where relevant to the U.S. Meat Substitute market.
Chapter 6. Competitive Landscape & Company Benchmarking
- 6.1 U.S. Meat Substitute Market Concentration & Structure
- 6.1.1 Herfindahl-Hirschman Index (HHI) – vs. 2024
- 6.1.2 Tier 1, Tier 2 & Tier 3 Market Structure
- 6.1.3 Global, Regional & Local Player Dynamics
- 6.2 U.S. Meat Substitute Market Share Analysis – 2024
- 6.2.1 Global Revenue Share by Company
- 6.2.2 Global Volume Share by Company
- 6.2.3 Regional Revenue Share
- 6.2.4 Market Share Evolution ( vs. 2024)
- 6.2.5 OEM Segment Share by Company
- 6.2.6 Replacement Segment Share by Company
- 6.3 Production/Delivery Capacity & Facility Analysis
- 6.3.1 Global Installed Capacity
- 6.3.2 Capacity Utilization Rates
- 6.3.3 Production/Output Volume
- 6.3.4 Facility Locations & Capacity Map
- 6.3.5 Planned Capacity Additions
- 6.4 U.S. Meat Substitute Competitive Benchmarking Matrix
- 6.4.1 Revenue, Volume, CAGR & Profitability Comparison
- 6.4.2 Channel Revenue Mix
- 6.4.3 Geographic Revenue Exposure
- 6.4.4 R&D Intensity
- 6.4.5 Sustainability Maturity
- 6.5 Strategic Developments in U.S. Meat Substitute (Last 24 Months)
- 6.5.1 Mergers, Acquisitions & Divestments
- 6.5.2 New U.S. Meat Substitute Launches
- 6.5.3 Facility Expansions
- 6.5.4 Strategic Alliances, Joint Ventures & Partnerships
- 6.5.5 Distribution Expansion & Market Entry
- 6.5.6 Sustainability & ESG Initiatives
- 6.6 Competitive Strategy Mapping
- 6.6.1 Leader, Challenger, Follower & Niche Classification
- 6.6.2 Pricing Strategy Comparison
- 6.6.3 Channel Strategy Matrix
Note: Strategic developments are included based on their materiality and the availability of reliable information.
Chapter 7. Global U.S. Meat Substitute Market – By Distribution Channel
- 7.1 Segment Overview
- 7.1.1 Volume & Revenue Split by Channel (2024 & 2032)
- 7.1.2 Channel Mix Evolution (2024-2032)
Chapter 8. Regional Market Analysis – Global Overview
- 8.1 Global Regional Overview
- 8.1.1 Regional Volume Share
- 8.1.2 Regional Revenue Share
- 8.1.3 Regional Volume by Region
- 8.1.4 Regional Revenue by Region
- 8.1.5 Regional Forecast Through 2032
- 8.2 Cross-Regional Segment Analysis
- 8.2.1 By Distribution Channel
- 8.2.2 By Brand/Price Tier
Chapter 9. North America U.S. Meat Substitute Market
- 9.1 United States
- 9.2 Canada
- 9.3 Mexico
Chapter 10. Europe U.S. Meat Substitute Market
- 10.1 Germany
- 10.2 France
- 10.3 Italy
- 10.4 United Kingdom
- 10.5 Spain
- 10.6 Poland
- 10.7 Russia
- 10.8 Netherlands
- 10.9 Belgium
- 10.10 Sweden
- 10.11 Denmark
- 10.12 Norway
- 10.13 Rest of Europe
Chapter 11. Asia Pacific U.S. Meat Substitute Market
- 11.1 China
- 11.2 India
- 11.3 Japan
- 11.4 South Korea
- 11.5 Thailand
- 11.6 Indonesia
- 11.7 Vietnam
- 11.8 Malaysia
- 11.9 Australia
- 11.10 Rest of Asia Pacific
Chapter 12. Latin America U.S. Meat Substitute Market
- 12.1 Brazil
- 12.2 Argentina
- 12.3 Colombia
- 12.4 Chile
- 12.5 Rest of Latin America
Chapter 13. Middle East U.S. Meat Substitute Market
- 13.1 Saudi Arabia
- 13.2 United Arab Emirates
- 13.3 Turkey
- 13.4 Israel
- 13.5 Iran
- 13.6 Rest of the Middle East
Chapter 14. Africa U.S. Meat Substitute Market
- 14.1 South Africa
- 14.2 Egypt
- 14.3 Nigeria
- 14.4 Morocco
- 14.5 Rest of Africa
Chapter 15. U.S. Meat Substitute Company Profiles
- 15.1 [Company 01]
- 15.1.1 Company Overview
- 15.1.2 Key Management Personnel
- 15.1.3 Products & Services Portfolio
- 15.1.4 Financial Performance
- 15.1.5 Key Market Focus & Geographic Presence
- 15.1.6 Recent Developments & Strategic Initiatives
Note: The company profile list is preliminary and may change based on research findings, market developments, data availability, and client requirements.
Chapter 16. Appendices
- Appendix A – List of Abbreviations & Acronyms
- Appendix B – Industry Classification Code Reference – Full Series
- Appendix C – Production & Capacity Data Tables
- Appendix D – End-Use & Demand Base Tables
- Appendix E – Consumption & Replacement Rate Assumptions
- Appendix F – ASP Reference Tables
- Appendix G – Manufacturing & Facility Database
- Appendix H – Import-Export Data Tables
- Appendix I – Regulatory Summary Tables
- Appendix J – Primary Research Participant List (Anonymized)
- Appendix K – Primary Research Questionnaire Framework
- Appendix L – Data Sources & Bibliography
- Appendix M – Market Size Divergence & Source Comparison
Chapter 17. Research Methodology
- 17.1 Research Framework & Philosophy
- 17.2 Secondary Research – Sources, Hierarchy & Data Extraction
- 17.3 Data Modeling – Bottom-Up & Top-Down Market Sizing
- 17.4 Primary Research – Stakeholder Framework, LOI & Sample Sizes
- 17.5 Forecast Methodology – Regression, Scenario & Sensitivity Analysis
- 17.6 Quality Control – Four-Layer Validation Framework
- 17.7 Limitations & Standard Assumptions
- 17.8 Disclaimer
