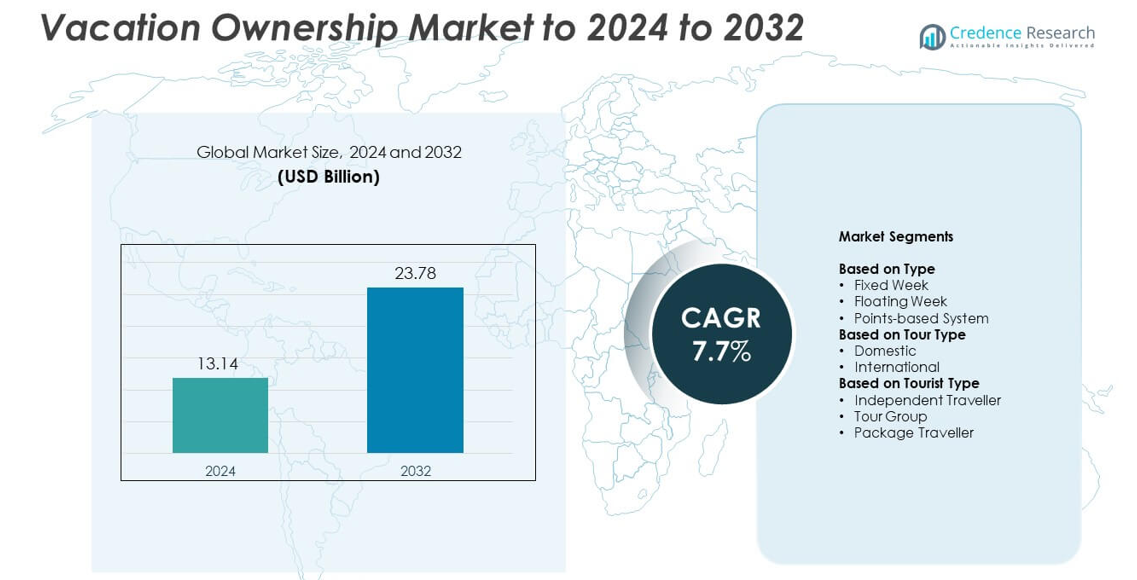
Home » Consumer Goods » Vacation Ownership Market

Vacation Ownership Market By Ownership Type (Fixed Week Ownership, Floating Week Ownership, Points-Based Ownership By Resort Type (Beach Resorts, Mountain Resorts, Urban Resorts, Golf Resorts, Rural and Countryside Resorts, Theme Park Resorts)-Growth, Future Prospects & Competitive Analysis, 2022 – 2030

Price: $4999

Published: | Report ID: 23253 | Report Format : PDF

Market Insights

  • The global demand for vacation ownership was valued at USD 19158.5 million in 2022 and is expected to reach USD 32428.84 million in 2030, growing at a CAGR of 6.80% between 2023 and 2030.
  • Fixed-week ownership is the leading segment by ownership type. The floating week ownership, on the other hand, is expected to grow at a strong CAGR.
  • The leading resort type segment is beach resorts.
  • The CAGR for fractional ownership is expected to be the highest during the projection period.
  • During the forecast time frame, the domestic category is likely to have the highest CAGR.
  • During the forecast period, branded resorts are estimated to have the greatest CAGR.
  • The internal exchange segment is likely to have the highest CAGR during the prediction period.
  • Luxury vacation ownership is the largest price tier categorization.
  • During the projected period, the primary residence segment’s CAGR is certainly going to be the top.
  • The greatest ownership resale market category is the resale market.
  • North America dominated the vacation ownership market.
  • Europe is predicted to be the second-largest region in the vacation ownership market.
  • In the market for vacation ownership, Asia Pacific is anticipated to grow at the fastest rate.
  • The industry is expanding as a result of the growth in demand for the growing popularity of experiential travel as well as the growth of the global tourism industry.
  • With the emergence of the digital nomad movement, the growing acceptance of sustainable tourism, and the expansion of the market for luxury vacation ownership, there are numerous opportunities for growth in the vacation ownership market.

Vacation Ownership Market

Executive Summary

Market Definition

The travel and leisure sector features a vacation ownership market where people can buy the right to use resorts or timeshares for a set number of days each year. Shared access is possible, and there might be a way to trade time for overnight stays at partner hotels. Through assigned ownership or point-based events, customers are given a way to secure future travel opportunities and cash gains.

Market Overview

The market for vacation ownership has been expanding steadily in recent years, and between 2023 and 2030, it is anticipated to rise at a CAGR of 6.80%. The market was estimated to be worth USD 19158.5 million in 2022, and it is anticipated to be worth USD 32428.84 million in 2030.

Families and individuals with more disposable income can now explore vacation ownership as a convenient and appealing travel alternative. For individuals with higher financial resources, the initial charges and continuing maintenance fees related to timeshare ownership become more manageable. Long-term commitments are common in holiday ownership, whether it is through ownership of a particular home or membership in a vacation club. Consumers are more likely to have the confidence and financial stability to enter into such agreements when earnings rise.

A lot of companies that offer vacation ownership have exchange programs that allow owners to trade their weeks or points for vacations at other related resorts. The appeal of vacation ownership is increased by the flexibility that allows owners to experience various locations and activities. Some vacation ownership programs have made the switch to points-based systems, giving owners more freedom to use their ownership. Owners can distribute points to change the length of their trip, the style of lodging, and even the departure dates.

Travel arrangements should be flexible, according to digital nomads. Nomads can adjust their travel plans to fit their work responsibilities due to some vacation ownership programs that give them the freedom to select various dates or locations. These are the factors that are expected to boost the vacation ownership market growth.

Design Element 2

Access crucial information at unmatched prices!

Request your free sample report today & start making informed decisions powered by Credence Research!

Download Free Sample
CTA Design Element 3

Segmentation by Ownership Type

  • By ownership type, fixed-week ownership is the market leader. Due to the fixed allocation of weeks from year to year, owners of fixed week ownership can count on a predictable vacation plan. Individuals and families that want to plan their holidays find this regularity appealing.
  • During the projected period, the floating week ownership category is anticipated to exhibit a sizable CAGR. Owners who choose their vacation dates within a defined seasonal or usage period benefit from floating week ownership. They can select from options that suit their schedule rather than being locked to particular weeks.
  • Other ownership type, such as points-based ownership, also contribute to the demand for vacation ownership.

Segmentation by Resort Type

  • The main resort type category is beach resorts. Beach Resorts are situated along coastlines, often with direct access to sandy beaches and stunning ocean views. This prime location is a primary attraction for vacationers seeking beachfront getaways.
  • The urban resorts category is likely to register a significant CAGR during the period of forecasting. Urban Resorts offers convenient access to cultural attractions, shopping areas, dining alternatives, and entertainment venues because of their strategic locations within or close to major cities. They offer a practical starting point for discovering metropolitan areas.
  • Other resort types, such as mountain resorts, golf resorts, rural and countryside resorts, and theme park resorts, also contribute to the demand for vacation ownership.

Segmentation by Ownership Duration

  • The category for fractional ownership is anticipated to experience the highest CAGR during the projection period. The number of weeks or months that each co-owner is permitted to utilize the property is normally how long the ownership period in a fractional ownership arrangement is calculated. A fractional ownership arrangement might grant each co-owner four weeks of usage each year.
  • Other ownership duration, such as traditional timeshare and right-to-use (RTU), also contribute to the demand for vacation ownership.

Segmentation by Location and Geography

  • During the projection period, the domestic category is likely to have the highest CAGR. Offering geographical variety to its consumers is an essential aspect of the vacation ownership market’s success. A variety of holiday opportunities are offered by several ownership programs that give members access to properties in various domestic locations.
  • Other location and geography, such as international, also contribute to the demand for vacation ownership.

Segmentation by Developer and Brand

  • Branded resorts will be expected to have the foremost CAGR during the prediction period. Owners of vacation ownership at branded resorts may profit from loyalty programs associated with the brand, which give discounts, points, or other advantages when visiting other properties in the company’s portfolio.
  • Other developers and brands, such as independent resorts, also contribute to the demand for vacation ownership.

Segmentation by Exchange Programs

  • Throughout the forecast duration, the category for internal exchange is anticipated to have the greatest CAGR. The demand for the destination and the specific weeks or points that are exchanged will determine the availability of internal swaps. Some programs provide owners who reserve sufficiently in advance preferred booking.
  • Other exchange programs, such as external exchange, also contribute to the demand for vacation ownership.

Segmentation by Price Tier

  • The highest CAGR is anticipated for luxury vacation ownership throughout estimation. The higher end of the price spectrum in the vacation ownership industry is occupied by luxury vacation ownership. It is geared at people and families looking for wealthy and exclusive vacation opportunities.
  • Other price tiers, such as mid-range vacation ownership and budget vacation ownership, also contribute to the demand for vacation ownership.

Segmentation by Ownership Use

  • Over the estimation period, primary residence is expected to have the greatest CAGR. Owning a primary residence Financial costs associated with use may include property taxes, utilities, and ongoing maintenance costs. Owners need to consider the expenditures involved with this kind of ownership carefully.
  • Other ownership uses, such as secondary residence, also contribute to the demand for vacation ownership.

Segmentation by Ownership Resale Market

  • Over the estimated timeframe, the resale market is anticipated to experience the highest CAGR. The same ownership rights and privileges, such as access to resort amenities and exchange networks, are often provided to buyers in the resale market as they would to those who bought directly from the developer.
  • Other ownership resale markets, such as new developments, also contribute to the demand for vacation ownership.

Segmentation by Region

  • The vacation ownership market was led by North America in 2022. Economic stability is often present in North America, which promotes investment in the vacation ownership industry and assures consumers when making purchases.
  • Europe is estimated to rank second in terms of market size for vacation ownership.
  • Asi Pacific will witness the most rapid growth in the vacation ownership market.
  • The rest of the world, including Latin America, the Middle East, and Africa, meets the rest of the vacation ownership demand.

Vacation Ownership Market R (1)

Increasing interest in experiential travel, greater flexibility, an increase in discretionary income, global tourist business expansion, technological advancements, and online booking are the variables that are anticipated to support the growth of the global market.

During the time of forecasting, North America will probably rule the vacation ownership market. Travelers can choose from a variety of holiday spots in North America, including the warm-weather beach resorts of Florida and Hawaii, the ski resorts of the Rocky Mountains, and cultural hubs like New York City. Tourists of all tastes and interests can find something to enjoy due to this diversity. Due to its large population, high levels of disposable income, and vacation-oriented culture, North America has a significant demand for vacation ownership. In order to take frequent, high-quality holidays, many North Americans seek the advantages of vacation ownership.

The Asia Pacific area is projected to show the fastest growth throughout the forecast time frame. Both domestic and international tourists frequently visit the nations of the Asia-Pacific region. The influx of tourists influences the demand for vacation ownership properties in certain places.

Many vacation ownership resorts have implemented in place eco-friendly and sustainable programs to lessen their influence on the environment. This trend appeals to eco-conscious travelers because it is aligned with the growing need for responsible tourism.

Consumers may now find, reserve, and manage their Vacation ownership properties more easily because of online resources and technologically advanced reservation systems, which have increased market accessibility.

Key Highlights of the Report

The global vacation ownership market is segmented by ownership type, resort type, ownership duration, location and geography, developer and brand, exchange programs, price tier, ownership use, ownership resale market, and region. As far as the ownership type is concerned, fixed-week ownership is the market spearhead. Beach resorts are the top resort type segment. During the forecast period, the fractional ownership category is expected to grow at the highest CAGR. The domestic is anticipated to experience the highest CAGR during the forecast period. North America is driving the vacation ownership market growth.

An increase in foreign tourists is one aspect of the tourism industry’s growth. International buyers are often attracted to vacation ownership properties, which helps the market grow. More people are looking for vacation accommodations as a result of the growing global tourism business. For travelers looking for continuity and quality in their vacation experiences, vacation ownership offers an appealing alternative.

However, according to forecasts, North America will hold the largest share of the market for vacation ownership globally. International vacationers are attracted to North America as well, particularly to well-known destinations for tourists like Orlando, Las Vegas, and Mexico’s coastal regions. Additionally, the Asia-Pacific (APAC) region is assumed to have the market’s sharpest growth. The vacation ownership industry is expanding significantly in developing nations, including China, India, Thailand, and Indonesia. To meet the needs of a rising consumer base, developers are increasingly focusing on these areas.

Which Key Factors Are Driving The Global Vacation Ownership Market?

The drivers propelling the growth of the vacation ownership industry are the growing popularity of realistic travel, increased flexibility, rising disposable revenues, and growth of the global sightseeing industry.

What Are The Key Challenges In The Global Market For Vacation Ownership?

Negative public observation, economic downturns, competition from alternative accommodations, and regulatory challenges are some of the challenges hindering the growth of the market for vacation ownership.

What Market Opportunities Exist For Vacation Ownership Globally?

The vacation ownership market has a lot of opportunities for growth due to the rise of the digital nomad movement, the increasing popularity of maintainable tourism, and the growth of amenity vacation ownership.

Market Drivers

Several factors influence the market for vacation ownership globally. The main factors influencing the market for vacation ownership globally are as follows:

The Growing Popularity Of Experiential Travel

Personalized and unique experiences are emphasized in experiential travel. Travelers can create vacations that are unique to their preferences and interests by choosing from a variety of locations and resort alternatives when using vacation ownership. Experience-oriented travelers look for top-notch lodgings that improve their trip as a whole. Elegance and premium lodgings are frequently available at vacation ownership properties, satisfying consumer demands for both comfort and elegance. Vacation Ownership resorts provide consistently high levels of quality and service, guaranteeing visitors that they can count on a specific degree of comfort and facilities in a variety of locations. The consistency of this dependability appeals to adventure travelers. Meeting local people and participating in their culture is a common aspect of experiential travel. Resorts that cater to vacation ownership guests frequently offer opportunities for cultural immersion through events, outings, and encounters with locals.

Market Restraints

Several challenges could prevent the expansion of the global market for vacation ownership. Among them are the following:

Negative Public Perception

Exiting a timeshare agreement can be difficult, and many customers have faced difficulties while attempting to sell or cancel their ownership. Frustration and negative word of mouth may result from this challenge. Low resale values are a common feature of the timeshare resale market, making it difficult for owners to recover their initial expenditures. This may put off prospective purchasers. The Vacation Ownership sector has had legal difficulties, as seen by class-action lawsuits involving dishonest or unethical business practices.

Opportunities

The global market for vacation ownership presents significant potential opportunities. The following is an example of these:

Increasing Popularity of Sustainable Tourism

Connecting with nature and taking in landscapes are common aspects of sustainable tourism. Travelers looking for nature-based experiences can find accommodations in vacation ownership resorts in beautiful and environmentally diverse places. Sustainable tourism encourages interaction with local communities and cultures. A lot of vacation ownership resorts provide opportunities for community involvement and cultural immersion, which improves the overall trip experience. Travelers looking to assist environmental preservation through their vacations are drawn to vacation ownership homes that are situated in or support conservation activities.

Competitive Landscape

Vacation Ownership Market C (1)

Key Players

The global market for vacation ownership is very competitive, with many powerful players. Some of the leading market participants and their corresponding market shares are listed below:

  • Diamond Resorts
  • Hyatt
  • Wyndham
  • Marriott Vacations Worldwide
  • Disney Vacation Club
  • Hilton Grand Vacations
  • Interval International
  • Accor Vacation Club
  • Four Seasons Residence Clubs
  • Bluegreen Vacations
  • Others

These companies give mergers and acquisitions, expanding their distribution network, and developing new products a priority in order to remain competitive in the market.

The leading competitors in the global market for vacation ownership are constantly looking for ways to get an advantage by releasing new items and advancements.

In February 2022, SellMyTimeshareNow.com, the world’s most active online marketplace for timeshares for sale and rent by owner, celebrates the continuous success of its timeshare resale and rental platform with a 68% growth in the purchase and rental offer prices year-over-year.

In June 2021, Resorts World Las Vegas, which is by far the most successful multi-brand resort in Hilton’s history, was founded through a partnership between Hilton and Genting Group.

Shape Your Report to Specific Countries or Regions & Enjoy 30% Off!

Summary of Key Findings

  • The vacation ownership sector continues to grow due to reimbursement regulations along with the growing acceptance of experimental travel.
  • Market segmented by ownership type, resort type, ownership duration, location and geography, developer and brand, exchange programs, price tier, ownership use, ownership resale market, and region.
  • An ownership type that is leading the market is fixed-week ownership.
  • The most ubiquitous resort type fragment is beach resorts.
  • In terms of CAGR, fractional ownership is expected to grow at the fastest rate during the forecast period.
  • The category for domestic will likely see the highest CAGR during the anticipated time frame.
  • North America is leading market development; the market is highly competitive with key players including Diamond Resorts, Hyatt, Wyndham, Marriott Vacations Worldwide, Disney Vacation Club., Hilton Grand Vacations, Interval International, Accor Vacation Club, Four Seasons Residence Clubs, Bluegreen Vacations and others.

Future Outlook

  • Optimistic viewpoint for the global vacation ownership market with noteworthy growth potential in the North American region.
  • One of the major factors supporting the growth of the vacation ownership market is the increase in demand for the global tourism industry.
  • In the foreseeable future, poor public perception may provide a significant barrier to the market’s expansion.
  • Foremost companies must concentrate on product innovation, expanding their market reach, and maintaining competitive pricing to stay ahead.

Segmentation

  • By Ownership Type
    • Fixed Week Ownership
    • Floating Week Ownership
    • Points-Based Ownership
  • By Resort Type
    • Beach Resorts
    • Mountain Resorts
    • Urban Resorts
    • Golf Resorts
    • Rural and Countryside Resorts
    • Theme Park Resorts
  • By Ownership Duration
    • Traditional Timeshare
    • Fractional Ownership
    • Right-to-Use (RTU)
  • By Location and Geography
    • Domestic
    • International
  • By Developer and Brand
    • Branded Resorts
    • Independent Resorts
  • By Exchange Programs
    • Internal Exchange
    • External Exchange
  • By Price Tier
    • Luxury Vacation Ownership
    • Mid-Range Vacation Ownership
    • Budget Vacation Ownership
  • By Ownership Use
    • Primary Residence
    • Secondary Residence
  • By Ownership Resale Market
    • New Developments
    • Resale Market
  • By Region
    • North America
      • The U.S.
      • Canada
      • Mexico
    • Europe
      • Germany
      • France
      • The U.K.
      • Italy
      • Spain
      • Rest of Europe
    • Asia Pacific
      • China
      • Japan
      • India
      • South Korea
      • South-east Asia
      • Rest of Asia Pacific
    • Latin America
      • Brazil
      • Argentina
      • Rest of Latin America
    • Middle East & Africa
      • GCC Countries
      • South Africa
      • Rest of the Middle East and Africa

Adjacent Markets

There are several related markets in the vacation ownership industry with significant potential for revenue growth. The major markets adjacent to the vacation ownership market –

Vacation Ownership Market A (1)

1. Preface

1.1. Report Description

1.1.1. Purpose of the Report

1.1.2. Target Audience

1.1.3. USP and Key Offerings

1.2. Research Scope

1.3. Market Introduction


2. Executive Summary

2.1. Market Snapshot: Global Vacation Ownership Market

2.1.1. Global Vacation Ownership Market, By Ownership Type

2.1.2. Global Vacation Ownership Market, By Resort Type

2.1.3. Global Vacation Ownership Market, By Ownership Duration

2.1.4. Global Vacation Ownership Market, By Location and Geography

2.1.5. Global Vacation Ownership Market, By Developer and Brand

2.1.6. Global Vacation Ownership Market, By Exchange Programs

2.1.7. Global Vacation Ownership Market, By Price Tier

2.1.8. Global Vacation Ownership Market, By Ownership Use

2.1.9. Global Vacation Ownership Market, By Ownership Resale Market

2.1.10. Global Vacation Ownership Market, By Region

2.2. Insights from Primary Respondents


3. Market Dynamics & Factors Analysis

3.1. Introduction

3.1.1. Global Vacation Ownership Market Value, 2017-2030, (US$ Mn)

3.1.2. Y-o-Y Growth Trend Analysis

3.2. Market Dynamics

3.2.1. Vacation Ownership Market Drivers

3.2.2. Vacation Ownership Market Restraints

3.2.3. Vacation Ownership Market Opportunities

3.2.4. Major Vacation Ownership Industry Challenges

3.3. Growth and Development Patterns

3.4. Investment Feasibility Analysis

3.5. Market Opportunity Analysis

3.5.1. Ownership Type

3.5.2. Resort Type

3.5.3. Ownership Duration

3.5.4. Location and Geography

3.5.5. Developer and Brand

3.5.6. Exchange Programs

3.5.7. Price Tier

3.5.8. Ownership Use

3.5.9. Ownership Resale Market

3.5.10. Geography


4. Market Competitive Landscape Analysis

4.1. Company Market Share Analysis, 2022

4.1.1. Global Vacation Ownership Market: Company Market Share, Value 2022

4.1.2. Global Vacation Ownership Market: Top 6 Company Market Share, Value 2022

4.1.3. Global Vacation Ownership Market: Top 3 Company Market Share, Value 2022

4.2. Global Vacation Ownership Market: Company Revenue Share Analysis, 2022

4.3. Company Assessment Metrics, 2022

4.3.1. Stars

4.3.2. Emerging Leaders

4.3.3. Pervasive Players

4.3.4. Participants

4.4. Startups/ SMEs Assessment Metrics, 2022

4.4.1. Progressive Companies

4.4.2. Responsive Companies

4.4.3. Dynamic Companies

4.4.4. Starting Blocks

4.5. Strategic Development

4.5.1. Acquisition and Mergers

4.5.2. New Product Launch

4.5.3. Regional Expansion

4.5.4. Partnerships

4.6. Key Player Product Matrix

4.7. Potential for New Players in the Global Vacation Ownership Market


5. Premium Insights

5.1. STAR (Situation, Task, Action, Results) Analysis

5.2. Porter’s Five Forces Analysis

5.2.1. Threat of New Entrants

5.2.2. Bargaining Power of Buyers/Consumers

5.2.3. Bargaining Power of Suppliers

5.2.4. Threat of Substitute Types

5.2.5. Intensity of Competitive Rivalry

5.3. PESTEL Analysis

5.3.1. Political Factors

5.3.2. Economic Factors

5.3.3. Social Factors

5.3.4. Technological Factors

5.3.5. Environmental Factors

5.3.6. Legal Factors

5.4. Key Market Trends

5.4.1. Demand Side Trends

5.4.2. Supply Side Trends

5.5. Value Chain Analysis

5.6. Technology Analysis

5.6.1. Research and development in the global market

5.6.2. Patent Analysis

5.6.3. Emerging technologies and their potential disruption to the market

5.7. Consumer Behaviour Analysis

5.7.1. Consumer Preferences and Expectations

5.7.2. Factors Influencing Consumer Buying Decisions

5.7.2.1. North America

5.7.2.2. Europe

5.7.2.3. Asia Pacific

5.7.2.4. Latin America

5.7.2.5. Middle East and Africa

5.7.3. Consumer Pain Points

5.8. Analysis and Recommendations

5.9. Adjacent Market Analysis


6. Market Positioning of Key Players, 2022

6.1. Company market share of key players, 2022

6.2. Competitive Benchmarking

6.3. Market Positioning of Key Vendors

6.4. Geographical Presence Analysis

6.5. Major Strategies Adopted by Key Players

6.5.1. Key Strategies Analysis

6.5.2. Mergers and Acquisitions

6.5.3. Partnerships

6.5.4. Product Launch

6.5.5. Geographical Expansion

6.5.6. Others


7. Impact Analysis of COVID 19 and Russia – Ukraine War on Vacation Ownership Market

7.1. Ukraine-Russia War Impact

7.1.1. Uncertainty and Economic Instability

7.1.2. Supply chain disruptions

7.1.3. Regional market shifts

7.1.4. Shift in government priorities

7.2. COVID-19 Impact Analysis

7.2.1. Supply Chain Disruptions

7.2.2. Demand Fluctuations

7.2.3. Shift in Product Mix

7.2.4. Reduced Industrial Activity

7.2.5. Regional Impact Analysis

7.2.5.1. North America

7.2.5.2. Europe

7.2.5.3. Asia Pacific

7.2.5.4. Latin America

7.2.5.5. Middle East and Africa


8. Global Vacation Ownership Market, By Ownership Type

8.1. Global Vacation Ownership Market Overview, by Ownership Type

8.1.1. Global Vacation Ownership Market Revenue Share, By Ownership Type, 2022 Vs 2030 (in %)

8.2. Fixed Week Ownership

8.2.1. Global Vacation Ownership Market, By Fixed Week Ownership, By Region, 2017-2030 (US$ Mn)

8.2.2. Market Dynamics for Fixed Week Ownership

8.2.2.1. Drivers

8.2.2.2. Restraints

8.2.2.3. Opportunities

8.2.2.4. Trends

8.3. Floating Week Ownership

8.3.1. Global Vacation Ownership Market, By Floating Week Ownership, By Region, 2017-2030 (US$ Mn)

8.3.2. Market Dynamics for Floating Week Ownership

8.3.2.1. Drivers

8.3.2.2. Restraints

8.3.2.3. Opportunities

8.3.2.4. Trends

8.4. Points-Based Ownership

8.4.1. Global Vacation Ownership Market, By Points-Based Ownership, By Region, 2017-2030 (US$ Mn)

8.4.2. Market Dynamics for Points-Based Ownership

8.4.2.1. Drivers

8.4.2.2. Restraints

8.4.2.3. Opportunities

8.4.2.4. Trends


9. Global Vacation Ownership Market, By Resort Type

9.1. Global Vacation Ownership Market Overview, by Resort Type

9.1.1. Global Vacation Ownership Market Revenue Share, By Resort Type, 2022 Vs 2030 (in %)

9.2. Beach Resorts

9.2.1. Global Vacation Ownership Market, By Beach Resorts, By Region, 2017-2030 (US$ Mn)

9.2.2. Market Dynamics for Beach Resorts

9.2.2.1. Drivers

9.2.2.2. Restraints

9.2.2.3. Opportunities

9.2.2.4. Trends

9.3. Mountain Resorts

9.3.1. Global Vacation Ownership Market, By Mountain Resorts, By Region, 2017-2030 (US$ Mn)

9.3.2. Market Dynamics for Mountain Resorts

9.3.2.1. Drivers

9.3.2.2. Restraints

9.3.2.3. Opportunities

9.3.2.4. Trends

9.4. Urban Resorts

9.4.1. Global Vacation Ownership Market, By Urban Resorts, By Region, 2017-2030 (US$ Mn)

9.4.2. Market Dynamics for Urban Resorts

9.4.2.1. Drivers

9.4.2.2. Restraints

9.4.2.3. Opportunities

9.4.2.4. Trends

9.5. Golf Resorts

9.5.1. Global Vacation Ownership Market, By Golf Resorts, By Region, 2017-2030 (US$ Mn)

9.5.2. Market Dynamics for Golf Resorts

9.5.2.1. Drivers

9.5.2.2. Restraints

9.5.2.3. Opportunities

9.5.2.4. Trends

9.6. Rural and Countryside Resorts

9.6.1. Global Vacation Ownership Market, By Rural and Countryside Resorts, By Region, 2017-2030 (US$ Mn)

9.6.2. Market Dynamics for Rural and Countryside Resorts

9.6.2.1. Drivers

9.6.2.2. Restraints

9.6.2.3. Opportunities

9.6.2.4. Trends

9.7. Theme Park Resorts

9.7.1. Global Vacation Ownership Market, By Theme Park Resorts, By Region, 2017-2030 (US$ Mn)

9.7.2. Market Dynamics for Theme Park Resorts

9.7.2.1. Drivers

9.7.2.2. Restraints

9.7.2.3. Opportunities

9.7.2.4. Trends


10. Global Vacation Ownership Market, By Ownership Duration

10.1. Global Vacation Ownership Market Overview, by Ownership Duration

10.1.1. Global Vacation Ownership Market Revenue Share, By Ownership Duration, 2022 Vs 2030 (in %)

10.2. Traditional Timeshare

10.2.1. Global Vacation Ownership Market, By Traditional Timeshare, By Region, 2017-2030 (US$ Mn)

10.2.2. Market Dynamics for Traditional Timeshare

10.2.2.1. Drivers

10.2.2.2. Restraints

10.2.2.3. Opportunities

10.2.2.4. Trends

10.3. Fractional Ownership

10.3.1. Global Vacation Ownership Market, By Fractional Ownership, By Region, 2017-2030 (US$ Mn)

10.3.2. Market Dynamics for Fractional Ownership

10.3.2.1. Drivers

10.3.2.2. Restraints

10.3.2.3. Opportunities

10.3.2.4. Trends

10.4. Right-to-Use (RTU)

10.4.1. Global Vacation Ownership Market, By Right-to-Use (RTU), By Region, 2017-2030 (US$ Mn)

10.4.2. Market Dynamics for Right-to-Use (RTU)

10.4.2.1. Drivers

10.4.2.2. Restraints

10.4.2.3. Opportunities

10.4.2.4. Trends


11. Global Vacation Ownership Market, By Location and Geography

11.1. Global Vacation Ownership Market Overview, by Location and Geography

11.1.1. Global Vacation Ownership Market Revenue Share, By Location and Geography, 2022 Vs 2030 (in %)

11.2. Domestic

11.2.1. Global Vacation Ownership Market, By Domestic, By Region, 2017-2030 (US$ Mn)

11.2.2. Market Dynamics for Domestic

11.2.2.1. Drivers

11.2.2.2. Restraints

11.2.2.3. Opportunities

11.2.2.4. Trends

11.3. International

11.3.1. Global Vacation Ownership Market, By International, By Region, 2017-2030 (US$ Mn)

11.3.2. Market Dynamics for International

11.3.2.1. Drivers

11.3.2.2. Restraints

11.3.2.3. Opportunities

11.3.2.4. Trends


12. Global Vacation Ownership Market, By Developer and Brand

12.1. Global Vacation Ownership Market Overview, by Developer and Brand

12.1.1. Global Vacation Ownership Market Revenue Share, By Developer and Brand, 2022 Vs 2030 (in %)

12.2. Branded Resorts

12.2.1. Global Vacation Ownership Market, By Branded Resorts, By Region, 2017-2030 (US$ Mn)

12.2.2. Market Dynamics for Branded Resorts

12.2.2.1. Drivers

12.2.2.2. Restraints

12.2.2.3. Opportunities

12.2.2.4. Trends

12.3. Independent Resorts

12.3.1. Global Vacation Ownership Market, By Independent Resorts, By Region, 2017-2030 (US$ Mn)

12.3.2. Market Dynamics for Independent Resorts

12.3.2.1. Drivers

12.3.2.2. Restraints

12.3.2.3. Opportunities

12.3.2.4. Trends


13. Global Vacation Ownership Market, By Exchange Programs

13.1. Global Vacation Ownership Market Overview, by Exchange Programs

13.1.1. Global Vacation Ownership Market Revenue Share, By Exchange Programs, 2022 Vs 2030 (in %)

13.2. Internal Exchange

13.2.1. Global Vacation Ownership Market, By Internal Exchange, By Region, 2017-2030 (US$ Mn)

13.2.2. Market Dynamics for Internal Exchange

13.2.2.1. Drivers

13.2.2.2. Restraints

13.2.2.3. Opportunities

13.2.2.4. Trends

13.3. External Exchange

13.3.1. Global Vacation Ownership Market, By External Exchange, By Region, 2017-2030 (US$ Mn)

13.3.2. Market Dynamics for External Exchange

13.3.2.1. Drivers

13.3.2.2. Restraints

13.3.2.3. Opportunities

13.3.2.4. Trends


14. Global Vacation Ownership Market, By Price Tier

14.1. Global Vacation Ownership Market Overview, by Price Tier

14.1.1. Global Vacation Ownership Market Revenue Share, By Price Tier, 2022 Vs 2030 (in %)

14.2. Luxury Vacation Ownership

14.2.1. Global Vacation Ownership Market, By Luxury Vacation Ownership, By Region, 2017-2030 (US$ Mn)

14.2.2. Market Dynamics for Luxury Vacation Ownership

14.2.2.1. Drivers

14.2.2.2. Restraints

14.2.2.3. Opportunities

14.2.2.4. Trends

14.3. Mid-Range Vacation Ownership

14.3.1. Global Vacation Ownership Market, By Mid-Range Vacation Ownership, By Region, 2017-2030 (US$ Mn)

14.3.2. Market Dynamics for Mid-Range Vacation Ownership

14.3.2.1. Drivers

14.3.2.2. Restraints

14.3.2.3. Opportunities

14.3.2.4. Trends

14.4. Budget Vacation Ownership

14.4.1. Global Vacation Ownership Market, By Budget Vacation Ownership, By Region, 2017-2030 (US$ Mn)

14.4.2. Market Dynamics for Budget Vacation Ownership

14.4.2.1. Drivers

14.4.2.2. Restraints

14.4.2.3. Opportunities

14.4.2.4. Trends


15. Global Vacation Ownership Market, By Ownership Use

15.1. Global Vacation Ownership Market Overview, by Ownership Use

15.1.1. Global Vacation Ownership Market Revenue Share, By Ownership Use, 2022 Vs 2030 (in %)

15.2. Primary Residence

15.2.1. Global Vacation Ownership Market, By Primary Residence, By Region, 2017-2030 (US$ Mn)

15.2.2. Market Dynamics for Primary Residence

15.2.2.1. Drivers

15.2.2.2. Restraints

15.2.2.3. Opportunities

15.2.2.4. Trends

15.3. Secondary Residence

15.3.1. Global Vacation Ownership Market, By Secondary Residence, By Region, 2017-2030 (US$ Mn)

15.3.2. Market Dynamics for Secondary Residence

15.3.2.1. Drivers

15.3.2.2. Restraints

15.3.2.3. Opportunities

15.3.2.4. Trends


16. Global Vacation Ownership Market, By Ownership Resale Market

16.1. Global Vacation Ownership Market Overview, by Ownership Resale Market

16.1.1. Global Vacation Ownership Market Revenue Share, By Ownership Resale Market, 2022 Vs 2030 (in %)

16.2. New Developments

16.2.1. Global Vacation Ownership Market, By New Developments, By Region, 2017-2030 (US$ Mn)

16.2.2. Market Dynamics for New Developments

16.2.2.1. Drivers

16.2.2.2. Restraints

16.2.2.3. Opportunities

16.2.2.4. Trends

16.3. Resale Market

16.3.1. Global Vacation Ownership Market, By Resale Market, By Region, 2017-2030 (US$ Mn)

16.3.2. Market Dynamics for Resale Market

16.3.2.1. Drivers

16.3.2.2. Restraints

16.3.2.3. Opportunities

16.3.2.4. Trends


17. Global Vacation Ownership Market, By Region

17.1. Global Vacation Ownership Market Overview, by Region

17.1.1. Global Vacation Ownership Market, By Region, 2022 vs 2030 (in%)

17.2. Ownership Type

17.2.1. Global Vacation Ownership Market, By Ownership Type, 2017-2030 (US$ Mn)

17.3. Resort Type

17.3.1. Global Vacation Ownership Market, By Resort Type, 2017-2030 (US$ Mn)

17.4. Ownership Duration

17.4.1. Global Vacation Ownership Market, By Ownership Duration, 2017-2030 (US$ Mn)

17.5. Location and Geography

17.5.1. Global Vacation Ownership Market, By Location and Geography, 2017-2030 (US$ Mn)

17.6. Developer and Brand

17.6.1. Global Vacation Ownership Market, By Developer and Brand, 2017-2030 (US$ Mn)

17.7. Exchange Programs

17.7.1. Global Vacation Ownership Market, By Exchange Programs, 2017-2030 (US$ Mn)

17.8. Price Tier

17.8.1. Global Vacation Ownership Market, By Price Tier, 2017-2030 (US$ Mn)

17.9. Ownership Use

17.9.1. Global Vacation Ownership Market, By Ownership Use, 2017-2030 (US$ Mn)

17.10. Ownership Resale Market

17.10.1. Global Vacation Ownership Market, By Ownership Resale Market, 2017-2030 (US$ Mn)


18. North America Vacation Ownership Market Analysis

18.1. Overview

18.1.1. Market Dynamics for North America

18.1.1.1. Drivers

18.1.1.2. Restraints

18.1.1.3. Opportunities

18.1.1.4. Trends

18.2. North America Vacation Ownership Market, by Ownership Type, 2017-2030(US$ Mn)

18.2.1. Overview

18.2.2. SRC Analysis

18.3. North America Vacation Ownership Market, by Resort Type, 2017-2030(US$ Mn)

18.3.1. Overview

18.3.2. SRC Analysis

18.4. North America Vacation Ownership Market, by Ownership Duration, 2017-2030(US$ Mn)

18.4.1. Overview

18.4.2. SRC Analysis

18.5. North America Vacation Ownership Market, by Location and Geography, 2017-2030(US$ Mn)

18.5.1. Overview

18.5.2. SRC Analysis

18.6. North America Vacation Ownership Market, by Developer and Brand, 2017-2030(US$ Mn)

18.6.1. Overview

18.6.2. SRC Analysis

18.7. North America Vacation Ownership Market, by Exchange Programs, 2017-2030(US$ Mn)

18.7.1. Overview

18.7.2. SRC Analysis

18.8. North America Vacation Ownership Market, by Price Tier, 2017-2030(US$ Mn)

18.8.1. Overview

18.8.2. SRC Analysis

18.9. North America Vacation Ownership Market, by Ownership Use, 2017-2030(US$ Mn)

18.9.1. Overview

18.9.2. SRC Analysis

18.10. North America Vacation Ownership Market, by Ownership Resale Market, 2017-2030(US$ Mn)

18.10.1. Overview

18.10.2. SRC Analysis

18.11. North America Vacation Ownership Market, by Country, 2017-2030 (US$ Mn)

18.11.1. North America Vacation Ownership Market, by Country, 2022 Vs 2030 (in%)

18.11.2. U.S.

18.11.3. Canada

18.11.4. Mexico


19. Europe Vacation Ownership Market Analysis

19.1. Overview

19.1.1. Market Dynamics for Europe

19.1.1.1. Drivers

19.1.1.2. Restraints

19.1.1.3. Opportunities

19.1.1.4. Trends

19.2. Europe Vacation Ownership Market, by Ownership Type, 2017-2030(US$ Mn)

19.2.1. Overview

19.2.2. SRC Analysis

19.3. Europe Vacation Ownership Market, by Resort Type, 2017-2030(US$ Mn)

19.3.1. Overview

19.3.2. SRC Analysis

19.4. Europe Vacation Ownership Market, by Ownership Duration, 2017-2030(US$ Mn)

19.4.1. Overview

19.4.2. SRC Analysis

19.5. Europe Vacation Ownership Market, by Location and Geography, 2017-2030(US$ Mn)

19.5.1. Overview

19.5.2. SRC Analysis

19.6. Europe Vacation Ownership Market, by Developer and Brand, 2017-2030(US$ Mn)

19.6.1. Overview

19.6.2. SRC Analysis

19.7. Europe Vacation Ownership Market, by Exchange Programs, 2017-2030(US$ Mn)

19.7.1. Overview

19.7.2. SRC Analysis

19.8. Europe Vacation Ownership Market, by Price Tier, 2017-2030(US$ Mn)

19.8.1. Overview

19.8.2. SRC Analysis

19.9. Europe Vacation Ownership Market, by Ownership Use, 2017-2030(US$ Mn)

19.9.1. Overview

19.9.2. SRC Analysis

19.10. Europe Vacation Ownership Market, by Ownership Resale Market, 2017-2030(US$ Mn)

19.10.1. Overview

19.10.2. SRC Analysis

19.11. Europe Vacation Ownership Market, by Country, 2017-2030 (US$ Mn)

19.11.1. Europe Vacation Ownership Market, by Country, 2022 Vs 2030 (in%)

19.11.2. UK

19.11.3. France

19.11.4. Germany

19.11.5. Italy

19.11.6. Spain

19.11.7. Benelux

19.11.8. Russia

19.11.9. Rest of Europe


20. Asia Pacific Vacation Ownership Market Analysis

20.1. Overview

20.1.1. Market Dynamics for Asia Pacific

20.1.1.1. Drivers

20.1.1.2. Restraints

20.1.1.3. Opportunities

20.1.1.4. Trends

20.2. Asia Pacific Vacation Ownership Market, by Ownership Type, 2017-2030(US$ Mn)

20.2.1. Overview

20.2.2. SRC Analysis

20.3. Asia Pacific Vacation Ownership Market, by Resort Type, 2017-2030(US$ Mn)

20.3.1. Overview

20.3.2. SRC Analysis

20.4. Asia Pacific Vacation Ownership Market, by Ownership Duration, 2017-2030(US$ Mn)

20.4.1. Overview

20.4.2. SRC Analysis

20.5. Asia Pacific Vacation Ownership Market, by Location and Geography, 2017-2030(US$ Mn)

20.5.1. Overview

20.5.2. SRC Analysis

20.6. Asia Pacific Vacation Ownership Market, by Developer and Brand, 2017-2030(US$ Mn)

20.6.1. Overview

20.6.2. SRC Analysis

20.7. Asia Pacific Vacation Ownership Market, by Exchange Programs, 2017-2030(US$ Mn)

20.7.1. Overview

20.7.2. SRC Analysis

20.8. Asia Pacific Vacation Ownership Market, by Price Tier, 2017-2030(US$ Mn)

20.8.1. Overview

20.8.2. SRC Analysis

20.9. Asia Pacific Vacation Ownership Market, by Ownership Use, 2017-2030(US$ Mn)

20.9.1. Overview

20.9.2. SRC Analysis

20.10. Asia Pacific Vacation Ownership Market, by Ownership Resale Market, 2017-2030(US$ Mn)

20.10.1. Overview

20.10.2. SRC Analysis

20.11. Asia Pacific Vacation Ownership Market, by Country, 2017-2030 (US$ Mn)

20.11.1. Asia Pacific Vacation Ownership Market, by Country, 2022 Vs 2030 (in%)

20.11.2. China

20.11.3. Japan

20.11.4. India

20.11.5. South Korea

20.11.6. South East Asia

20.11.7. Rest of Asia Pacific


21. Latin America Vacation Ownership Market Analysis

21.1. Overview

21.1.1. Market Dynamics for Latin America

21.1.1.1. Drivers

21.1.1.2. Restraints

21.1.1.3. Opportunities

21.1.1.4. Trends

21.2. Latin America Vacation Ownership Market, by Ownership Type, 2017-2030(US$ Mn)

21.2.1. Overview

21.2.2. SRC Analysis

21.3. Latin America Vacation Ownership Market, by Resort Type, 2017-2030(US$ Mn)

21.3.1. Overview

21.3.2. SRC Analysis

21.4. Latin America Vacation Ownership Market, by Ownership Duration, 2017-2030(US$ Mn)

21.4.1. Overview

21.4.2. SRC Analysis

21.5. Latin America Vacation Ownership Market, by Location and Geography, 2017-2030(US$ Mn)

21.5.1. Overview

21.5.2. SRC Analysis

21.6. Latin America Vacation Ownership Market, by Developer and Brand, 2017-2030(US$ Mn)

21.6.1. Overview

21.6.2. SRC Analysis

21.7. Latin America Vacation Ownership Market, by Exchange Programs, 2017-2030(US$ Mn)

21.7.1. Overview

21.7.2. SRC Analysis

21.8. Latin America Vacation Ownership Market, by Price Tier, 2017-2030(US$ Mn)

21.8.1. Overview

21.8.2. SRC Analysis

21.9. Latin America Vacation Ownership Market, by Ownership Use, 2017-2030(US$ Mn)

21.9.1. Overview

21.9.2. SRC Analysis

21.10. Latin America Vacation Ownership Market, by Ownership Resale Market, 2017-2030(US$ Mn)

21.10.1. Overview

21.10.2. SRC Analysis

21.11. Latin America Vacation Ownership Market, by Country, 2017-2030 (US$ Mn)

21.11.1. Latin America Vacation Ownership Market, by Country, 2022 Vs 2030 (in%)

21.11.2. Brazil

21.11.3. Argentina

21.11.4. Rest of Latin America


22. Middle East Vacation Ownership Market Analysis

22.1. Overview

22.1.1. Market Dynamics for Middle East

22.1.1.1. Drivers

22.1.1.2. Restraints

22.1.1.3. Opportunities

22.1.1.4. Trends

22.2. Middle East Vacation Ownership Market, by Ownership Type, 2017-2030(US$ Mn)

22.2.1. Overview

22.2.2. SRC Analysis

22.3. Middle East Vacation Ownership Market, by Resort Type, 2017-2030(US$ Mn)

22.3.1. Overview

22.3.2. SRC Analysis

22.4. Middle East Vacation Ownership Market, by Ownership Duration, 2017-2030(US$ Mn)

22.4.1. Overview

22.4.2. SRC Analysis

22.5. Middle East Vacation Ownership Market, by Location and Geography, 2017-2030(US$ Mn)

22.5.1. Overview

22.5.2. SRC Analysis

22.6. Middle East Vacation Ownership Market, by Developer and Brand, 2017-2030(US$ Mn)

22.6.1. Overview

22.6.2. SRC Analysis

22.7. Middle East Vacation Ownership Market, by Exchange Programs, 2017-2030(US$ Mn)

22.7.1. Overview

22.7.2. SRC Analysis

22.8. Middle East Vacation Ownership Market, by Price Tier, 2017-2030(US$ Mn)

22.8.1. Overview

22.8.2. SRC Analysis

22.9. Middle East Vacation Ownership Market, by Ownership Use, 2017-2030(US$ Mn)

22.9.1. Overview

22.9.2. SRC Analysis

22.10. Middle East Vacation Ownership Market, by Ownership Resale Market, 2017-2030(US$ Mn)

22.10.1. Overview

22.10.2. SRC Analysis

22.11. Middle East Vacation Ownership Market, by Country, 2017-2030 (US$ Mn)

22.11.1. Middle East Vacation Ownership Market, by Country, 2022 Vs 2030 (in%)

22.11.2. UAE

22.11.3. Saudi Arabia

22.11.4. Rest of Middle East


23. Africa Vacation Ownership Market Analysis

23.1. Overview

23.1.1. Market Dynamics for Africa

23.1.1.1. Drivers

23.1.1.2. Restraints

23.1.1.3. Opportunities

23.1.1.4. Trends

23.2. Africa Vacation Ownership Market, by Ownership Type, 2017-2030(US$ Mn)

23.2.1. Overview

23.2.2. SRC Analysis

23.3. Africa Vacation Ownership Market, by Resort Type, 2017-2030(US$ Mn)

23.3.1. Overview

23.3.2. SRC Analysis

23.4. Africa Vacation Ownership Market, by Ownership Duration, 2017-2030(US$ Mn)

23.4.1. Overview

23.4.2. SRC Analysis

23.5. Africa Vacation Ownership Market, by Location and Geography, 2017-2030(US$ Mn)

23.5.1. Overview

23.5.2. SRC Analysis

23.6. Africa Vacation Ownership Market, by Developer and Brand, 2017-2030(US$ Mn)

23.6.1. Overview

23.6.2. SRC Analysis

23.7. Africa Vacation Ownership Market, by Exchange Programs, 2017-2030(US$ Mn)

23.7.1. Overview

23.7.2. SRC Analysis

23.8. Africa Vacation Ownership Market, by Price Tier, 2017-2030(US$ Mn)

23.8.1. Overview

23.8.2. SRC Analysis

23.9. Africa Vacation Ownership Market, by Ownership Use, 2017-2030(US$ Mn)

23.9.1. Overview

23.9.2. SRC Analysis

23.10. Africa Vacation Ownership Market, by Ownership Resale Market, 2017-2030(US$ Mn)

23.10.1. Overview

23.10.2. SRC Analysis

23.11. Africa Vacation Ownership Market, by Country, 2017-2030 (US$ Mn)

23.11.1. Africa Vacation Ownership Market, by Country, 2022 Vs 2030 (in%)

23.11.2. South Africa

23.11.3. Egypt

23.11.4. Rest of Africa


24. Company Profiles

24.1. Diamond Resorts

24.1.1. Company Overview

24.1.2. Products/Services Portfolio

24.1.3. Geographical Presence

24.1.4. SWOT Analysis

24.1.5. Financial Summary

24.1.5.1. Market Revenue and Net Profit (2019-2022)

24.1.5.2. Business Segment Revenue Analysis

24.1.5.3. Geographical Revenue Analysis

24.2. Hyatt

24.3. Wyndham

24.4. Marriott Vacations Worldwide

24.5. Disney Vacation Club

24.6. Hilton Grand Vacations

24.7. Interval International

24.8. Accor Vacation Club

24.9. Four Seasons Residence Clubs

24.10. Bluegreen Vacations

24.11. Others


25. Research Methodology

25.1. Research Methodology

25.2. Phase I – Secondary Research

25.3. Phase II – Data Modelling

25.3.1. Company Share Analysis Model

25.3.2. Revenue Based Modelling

25.4. Phase III – Primary Research

25.5. Research Limitations

25.5.1. Assumptions

List of Figures

FIG. 1 Global Vacation Ownership Market: Research Methodology

FIG. 2 Market Size Estimation – Top Down & Bottom up Approach

FIG. 3 Global Vacation Ownership Market Segmentation

FIG. 4 Global Vacation Ownership Market, by Ownership Type, 2022 (US$ Mn)

FIG. 5 Global Vacation Ownership Market, by Resort Type, 2022 (US$ Mn)

FIG. 6 Global Vacation Ownership Market, by Ownership Duration, 2022 (US$ Mn)

FIG. 7 Global Vacation Ownership Market, by Location and Geography, 2022 (US$ Mn)

FIG. 8 Global Vacation Ownership Market, by Developer and Brand, 2022 (US$ Mn)

FIG. 9 Global Vacation Ownership Market, by Exchange Programs, 2022 (US$ Mn)

FIG. 10 Global Vacation Ownership Market, by Price Tier, 2022 (US$ Mn)

FIG. 11 Global Vacation Ownership Market, by Ownership Use, 2022 (US$ Mn)

FIG. 12 Global Vacation Ownership Market, by Ownership Resale Market, 2022 (US$ Mn)

FIG. 13 Global Vacation Ownership Market, by Geography, 2022 (US$ Mn)

FIG. 14 Attractive Investment Proposition, by Ownership Type, 2022

FIG. 15 Attractive Investment Proposition, by Resort Type, 2022

FIG. 16 Attractive Investment Proposition, by Ownership Duration, 2022

FIG. 17 Attractive Investment Proposition, by Location and Geography, 2022

FIG. 18 Attractive Investment Proposition, by Developer and Brand, 2022

FIG. 19 Attractive Investment Proposition, by Exchange Programs, 2022

FIG. 20 Attractive Investment Proposition, by Price Tier, 2022

FIG. 21 Attractive Investment Proposition, by Ownership Use, 2022

FIG. 22 Attractive Investment Proposition, by Ownership Resale Market, 2022

FIG. 23 Attractive Investment Proposition, by Geography, 2022

FIG. 24 Global Market Share Analysis of Key Vacation Ownership Market Manufacturers, 2022

FIG. 25 Global Market Positioning of Key Vacation Ownership Market Manufacturers, 2022

FIG. 26 Global Vacation Ownership Market Value Contribution, By Ownership Type, 2022 & 2030 (Value %)

FIG. 27 Global Vacation Ownership Market, by Fixed Week Ownership, Value, 2017-2030 (US$ Mn)

FIG. 28 Global Vacation Ownership Market, by Floating Week Ownership, Value, 2017-2030 (US$ Mn)

FIG. 29 Global Vacation Ownership Market, by Points-Based Ownership, Value, 2017-2030 (US$ Mn)

FIG. 30 Global Vacation Ownership Market Value Contribution, By Resort Type, 2022 & 2030 (Value %)

FIG. 31 Global Vacation Ownership Market, by Beach Resorts, Value, 2017-2030 (US$ Mn)

FIG. 32 Global Vacation Ownership Market, by Mountain Resorts, Value, 2017-2030 (US$ Mn)

FIG. 33 Global Vacation Ownership Market, by Urban Resorts, Value, 2017-2030 (US$ Mn)

FIG. 34 Global Vacation Ownership Market, by Golf Resorts, Value, 2017-2030 (US$ Mn)

FIG. 35 Global Vacation Ownership Market, by Rural and Countryside Resorts, Value, 2017-2030 (US$ Mn)

FIG. 36 Global Vacation Ownership Market, by Theme Park Resorts, Value, 2017-2030 (US$ Mn)

FIG. 37 Global Vacation Ownership Market Value Contribution, By Ownership Duration, 2022 & 2030 (Value %)

FIG. 38 Global Vacation Ownership Market, by Traditional Timeshare, Value, 2017-2030 (US$ Mn)

FIG. 39 Global Vacation Ownership Market, by Fractional Ownership, Value, 2017-2030 (US$ Mn)

FIG. 40 Global Vacation Ownership Market, by Right-to-Use (RTU), Value, 2017-2030 (US$ Mn)

FIG. 41 Global Vacation Ownership Market Value Contribution, By Location and Geography, 2022 & 2030 (Value %)

FIG. 42 Global Vacation Ownership Market, by Domestic, Value, 2017-2030 (US$ Mn)

FIG. 43 Global Vacation Ownership Market, by International, Value, 2017-2030 (US$ Mn)

FIG. 44 Global Vacation Ownership Market Value Contribution, By Developer and Brand, 2022 & 2030 (Value %)

FIG. 45 Global Vacation Ownership Market, by Branded Resorts, Value, 2017-2030 (US$ Mn)

FIG. 46 Global Vacation Ownership Market, by Independent Resorts, Value, 2017-2030 (US$ Mn)

FIG. 47 Global Vacation Ownership Market Value Contribution, By Exchange Programs, 2022 & 2030 (Value %)

FIG. 48 Global Vacation Ownership Market, by Internal Exchange, Value, 2017-2030 (US$ Mn)

FIG. 49 Global Vacation Ownership Market, by External Exchange, Value, 2017-2030 (US$ Mn)

FIG. 50 Global Vacation Ownership Market Value Contribution, By Price Tier, 2022 & 2030 (Value %)

FIG. 51 Global Vacation Ownership Market, by Luxury Vacation Ownership, Value, 2017-2030 (US$ Mn)

FIG. 52 Global Vacation Ownership Market, by Mid-Range Vacation Ownership, Value, 2017-2030 (US$ Mn)

FIG. 53 Global Vacation Ownership Market, by Budget Vacation Ownership, Value, 2017-2030 (US$ Mn)

FIG. 54 Global Vacation Ownership Market Value Contribution, By Ownership Use, 2022 & 2030 (Value %)

FIG. 55 Global Vacation Ownership Market, by Primary Residence, Value, 2017-2030 (US$ Mn)

FIG. 56 Global Vacation Ownership Market, by Secondary Residence, Value, 2017-2030 (US$ Mn)

FIG. 57 Global Vacation Ownership Market Value Contribution, By Ownership Resale Market, 2022 & 2030 (Value %)

FIG. 58 Global Vacation Ownership Market, by New Developments, Value, 2017-2030 (US$ Mn)

FIG. 59 Global Vacation Ownership Market, by Resale Market, Value, 2017-2030 (US$ Mn)

FIG. 60 North America Vacation Ownership Market, 2017-2030 (US$ Mn)

FIG. 61 U.S. Vacation Ownership Market, 2017-2030 (US$ Mn)

FIG. 62 Canada Vacation Ownership Market, 2017-2030 (US$ Mn)

FIG. 63 Mexico Vacation Ownership Market, 2017-2030 (US$ Mn)

FIG. 64 Europe Vacation Ownership Market, 2017-2030 (US$ Mn)

FIG. 65 Germany Vacation Ownership Market, 2017-2030 (US$ Mn)

FIG. 66 France Vacation Ownership Market, 2017-2030 (US$ Mn)

FIG. 67 U.K. Vacation Ownership Market, 2017-2030 (US$ Mn)

FIG. 68 Italy Vacation Ownership Market, 2017-2030 (US$ Mn)

FIG. 69 Spain Vacation Ownership Market, 2017-2030 (US$ Mn)

FIG. 70 Benelux Vacation Ownership Market, 2017-2030 (US$ Mn)

FIG. 71 Russia Vacation Ownership Market, 2017-2030 (US$ Mn)

FIG. 72 Rest of Europe Vacation Ownership Market, 2017-2030 (US$ Mn)

FIG. 73 Asia Pacific Vacation Ownership Market, 2017-2030 (US$ Mn)

FIG. 74 China Vacation Ownership Market, 2017-2030 (US$ Mn)

FIG. 75 Japan Vacation Ownership Market, 2017-2030 (US$ Mn)

FIG. 76 India Vacation Ownership Market, 2017-2030 (US$ Mn)

FIG. 77 South Korea Vacation Ownership Market, 2017-2030 (US$ Mn)

FIG. 78 South-East Asia Vacation Ownership Market, 2017-2030 (US$ Mn)

FIG. 79 Rest of Asia Pacific Vacation Ownership Market, 2017-2030 (US$ Mn)

FIG. 80 Latin America Vacation Ownership Market, 2017-2030 (US$ Mn)

FIG. 81 Brazil Vacation Ownership Market, 2017-2030 (US$ Mn)

FIG. 82 Argentina Vacation Ownership Market, 2017-2030 (US$ Mn)

FIG. 83 Rest of Latin America Vacation Ownership Market, 2017-2030 (US$ Mn)

FIG. 84 Middle East Vacation Ownership Market, 2017-2030 (US$ Mn)

FIG. 85 UAE Vacation Ownership Market, 2017-2030 (US$ Mn)

FIG. 86 Saudi Arabia Vacation Ownership Market, 2017-2030 (US$ Mn)

FIG. 87 Rest of Middle East Vacation Ownership Market, 2017-2030 (US$ Mn)

FIG. 88 Africa Vacation Ownership Market, 2017-2030 (US$ Mn)

FIG. 89 South Africa Vacation Ownership Market, 2017-2030 (US$ Mn)

FIG. 90 Egypt Vacation Ownership Market, 2017-2030 (US$ Mn)

FIG. 91 Rest of Africa Vacation Ownership Market, 2017-2030 (US$ Mn)


List of Tables

TABLE 1 Market Snapshot: Global Vacation Ownership Market

TABLE 2 Global Vacation Ownership Market: Market Drivers Impact Analysis

TABLE 3 Global Vacation Ownership Market: Market Restraints Impact Analysis

TABLE 4 Global Vacation Ownership Market, by Competitive Benchmarking, 2022

TABLE 5 Global Vacation Ownership Market, by Geographical Presence Analysis, 2022

TABLE 6 Global Vacation Ownership Market, by Key Strategies Analysis, 2022

TABLE 7 Global Vacation Ownership Market, by Fixed Week Ownership, By Region, 2017-2022 (US$ Mn)

TABLE 8 Global Vacation Ownership Market, by Fixed Week Ownership, By Region, 2023-2030 (US$ Mn)

TABLE 9 Global Vacation Ownership Market, by Floating Week Ownership, By Region, 2017-2022 (US$ Mn)

TABLE 10 Global Vacation Ownership Market, by Floating Week Ownership, By Region, 2023-2030 (US$ Mn)

TABLE 11 Global Vacation Ownership Market, by Points-Based Ownership, By Region, 2017-2022 (US$ Mn)

TABLE 12 Global Vacation Ownership Market, by Points-Based Ownership, By Region, 2023-2030 (US$ Mn)

TABLE 13 Global Vacation Ownership Market, by Beach Resorts, By Region, 2017-2022 (US$ Mn)

TABLE 14 Global Vacation Ownership Market, by Beach Resorts, By Region, 2023-2030 (US$ Mn)

TABLE 15 Global Vacation Ownership Market, by Mountain Resorts, By Region, 2017-2022 (US$ Mn)

TABLE 16 Global Vacation Ownership Market, by Mountain Resorts, By Region, 2023-2030 (US$ Mn)

TABLE 17 Global Vacation Ownership Market, by Urban Resorts, By Region, 2017-2022 (US$ Mn)

TABLE 18 Global Vacation Ownership Market, by Urban Resorts, By Region, 2023-2030 (US$ Mn)

TABLE 19 Global Vacation Ownership Market, by Golf Resorts, By Region, 2017-2022 (US$ Mn)

TABLE 20 Global Vacation Ownership Market, by Golf Resorts, By Region, 2023-2030 (US$ Mn)

TABLE 21 Global Vacation Ownership Market, by Rural and Countryside Resorts, By Region, 2017-2022 (US$ Mn)

TABLE 22 Global Vacation Ownership Market, by Rural and Countryside Resorts, By Region, 2023-2030 (US$ Mn)

TABLE 23 Global Vacation Ownership Market, by Theme Park Resorts, By Region, 2017-2022 (US$ Mn)

TABLE 24 Global Vacation Ownership Market, by Theme Park Resorts, By Region, 2023-2030 (US$ Mn)

TABLE 25 Global Vacation Ownership Market, by Traditional Timeshare, By Region, 2017-2022 (US$ Mn)

TABLE 26 Global Vacation Ownership Market, by Traditional Timeshare, By Region, 2023-2030 (US$ Mn)

TABLE 27 Global Vacation Ownership Market, by Fractional Ownership, By Region, 2017-2022 (US$ Mn)

TABLE 28 Global Vacation Ownership Market, by Fractional Ownership, By Region, 2023-2030 (US$ Mn)

TABLE 29 Global Vacation Ownership Market, by Right-to-Use (RTU), By Region, 2017-2022 (US$ Mn)

TABLE 30 Global Vacation Ownership Market, by Right-to-Use (RTU), By Region, 2023-2030 (US$ Mn)

TABLE 31 Global Vacation Ownership Market, by Domestic, By Region, 2017-2022 (US$ Mn)

TABLE 32 Global Vacation Ownership Market, by Domestic, By Region, 2023-2030 (US$ Mn)

TABLE 33 Global Vacation Ownership Market, by International, By Region, 2017-2022 (US$ Mn)

TABLE 34 Global Vacation Ownership Market, by International, By Region, 2023-2030 (US$ Mn)

TABLE 35 Global Vacation Ownership Market, by Branded Resorts, By Region, 2017-2022 (US$ Mn)

TABLE 36 Global Vacation Ownership Market, by Branded Resorts, By Region, 2023-2030 (US$ Mn)

TABLE 37 Global Vacation Ownership Market, by Independent Resorts, By Region, 2017-2022 (US$ Mn)

TABLE 38 Global Vacation Ownership Market, by Independent Resorts, By Region, 2023-2030 (US$ Mn)

TABLE 39 Global Vacation Ownership Market, by Internal Exchange, By Region, 2017-2022 (US$ Mn)

TABLE 40 Global Vacation Ownership Market, by Internal Exchange, By Region, 2023-2030 (US$ Mn)

TABLE 41 Global Vacation Ownership Market, by External Exchange, By Region, 2017-2022 (US$ Mn)

TABLE 42 Global Vacation Ownership Market, by External Exchange, By Region, 2023-2030 (US$ Mn)

TABLE 43 Global Vacation Ownership Market, by Luxury Vacation Ownership, By Region, 2017-2022 (US$ Mn)

TABLE 44 Global Vacation Ownership Market, by Luxury Vacation Ownership, By Region, 2023-2030 (US$ Mn)

TABLE 45 Global Vacation Ownership Market, by Mid-Range Vacation Ownership, By Region, 2017-2022 (US$ Mn)

TABLE 46 Global Vacation Ownership Market, by Mid-Range Vacation Ownership, By Region, 2023-2030 (US$ Mn)

TABLE 47 Global Vacation Ownership Market, by Budget Vacation Ownership, By Region, 2017-2022 (US$ Mn)

TABLE 48 Global Vacation Ownership Market, by Budget Vacation Ownership, By Region, 2023-2030 (US$ Mn)

TABLE 49 Global Vacation Ownership Market, by Primary Residence, By Region, 2017-2022 (US$ Mn)

TABLE 50 Global Vacation Ownership Market, by Primary Residence, By Region, 2023-2030 (US$ Mn)

TABLE 51 Global Vacation Ownership Market, by Secondary Residence, By Region, 2017-2022 (US$ Mn)

TABLE 52 Global Vacation Ownership Market, by Secondary Residence, By Region, 2023-2030 (US$ Mn)

TABLE 53 Global Vacation Ownership Market, by New Developments, By Region, 2017-2022 (US$ Mn)

TABLE 54 Global Vacation Ownership Market, by New Developments, By Region, 2023-2030 (US$ Mn)

TABLE 55 Global Vacation Ownership Market, by Resale Market, By Region, 2017-2022 (US$ Mn)

TABLE 56 Global Vacation Ownership Market, by Resale Market, By Region, 2023-2030 (US$ Mn)

TABLE 57 Global Vacation Ownership Market, by Ownership Type, 2017-2022 (US$ Mn)

TABLE 58 Global Vacation Ownership Market, by Ownership Type, 2023-2030 (US$ Mn)

TABLE 59 Global Vacation Ownership Market, by Resort Type, 2017-2022 (US$ Mn)

TABLE 60 Global Vacation Ownership Market, by Resort Type, 2023-2030 (US$ Mn)

TABLE 61 Global Vacation Ownership Market, by Ownership Duration, 2017-2022 (US$ Mn)

TABLE 62 Global Vacation Ownership Market, by Ownership Duration, 2023-2030 (US$ Mn)

TABLE 63 Global Vacation Ownership Market, by Location and Geography, 2017-2022 (US$ Mn)

TABLE 64 Global Vacation Ownership Market, by Location and Geography, 2023-2030 (US$ Mn)

TABLE 65 Global Vacation Ownership Market, by Developer and Brand, 2017-2022 (US$ Mn)

TABLE 66 Global Vacation Ownership Market, by Developer and Brand, 2023-2030 (US$ Mn)

TABLE 67 Global Vacation Ownership Market, by Exchange Programs, 2017-2022 (US$ Mn)

TABLE 68 Global Vacation Ownership Market, by Exchange Programs, 2023-2030 (US$ Mn)

TABLE 69 Global Vacation Ownership Market, by Price Tier, 2017-2022 (US$ Mn)

TABLE 70 Global Vacation Ownership Market, by Price Tier, 2023-2030 (US$ Mn)

TABLE 71 Global Vacation Ownership Market, by Ownership Use, 2017-2022 (US$ Mn)

TABLE 72 Global Vacation Ownership Market, by Ownership Use, 2023-2030 (US$ Mn)

TABLE 73 Global Vacation Ownership Market, by Ownership Resale Market, 2017-2022 (US$ Mn)

TABLE 74 Global Vacation Ownership Market, by Ownership Resale Market, 2023-2030 (US$ Mn)

TABLE 75 Global Vacation Ownership Market, by Region, 2017-2022 (US$ Mn)

TABLE 76 Global Vacation Ownership Market, by Region, 2023-2030 (US$ Mn)

TABLE 77 North America Vacation Ownership Market, by Ownership Type, 2017-2022 (US$ Mn)

TABLE 78 North America Vacation Ownership Market, by Ownership Type, 2023-2030 (US$ Mn)

TABLE 79 North America Vacation Ownership Market, by Resort Type, 2017-2022 (US$ Mn)

TABLE 80 North America Vacation Ownership Market, by Resort Type, 2023-2030 (US$ Mn)

TABLE 81 North America Vacation Ownership Market, by Ownership Duration, 2017-2022 (US$ Mn)

TABLE 82 North America Vacation Ownership Market, by Ownership Duration, 2023-2030 (US$ Mn)

TABLE 83 North America Vacation Ownership Market, by Location and Geography, 2017-2022 (US$ Mn)

TABLE 84 North America Vacation Ownership Market, by Location and Geography, 2023-2030 (US$ Mn)

TABLE 85 North America Vacation Ownership Market, by Developer and Brand, 2017-2022 (US$ Mn)

TABLE 86 North America Vacation Ownership Market, by Developer and Brand, 2023-2030 (US$ Mn)

TABLE 87 North America Vacation Ownership Market, by Exchange Programs, 2017-2022 (US$ Mn)

TABLE 88 North America Vacation Ownership Market, by Exchange Programs, 2023-2030 (US$ Mn)

TABLE 89 North America Vacation Ownership Market, by Price Tier, 2017-2022 (US$ Mn)

TABLE 90 North America Vacation Ownership Market, by Price Tier, 2023-2030 (US$ Mn)

TABLE 91 North America Vacation Ownership Market, by Ownership Use, 2017-2022 (US$ Mn)

TABLE 92 North America Vacation Ownership Market, by Ownership Use, 2023-2030 (US$ Mn)

TABLE 93 North America Vacation Ownership Market, by Ownership Resale Market, 2017-2022 (US$ Mn)

TABLE 94 North America Vacation Ownership Market, by Ownership Resale Market, 2023-2030 (US$ Mn)

TABLE 95 North America Vacation Ownership Market, by Country, 2017-2022 (US$ Mn)

TABLE 96 North America Vacation Ownership Market, by Country, 2023-2030 (US$ Mn)

TABLE 97 United States Vacation Ownership Market, by Ownership Type, 2017-2022 (US$ Mn)

TABLE 98 United States Vacation Ownership Market, by Ownership Type, 2023-2030 (US$ Mn)

TABLE 99 United States Vacation Ownership Market, by Resort Type, 2017-2022 (US$ Mn)

TABLE 100 United States Vacation Ownership Market, by Resort Type, 2023-2030 (US$ Mn)

TABLE 101 United States Vacation Ownership Market, by Ownership Duration, 2017-2022 (US$ Mn)

TABLE 102 United States Vacation Ownership Market, by Ownership Duration, 2023-2030 (US$ Mn)

TABLE 103 United States Vacation Ownership Market, by Location and Geography, 2017-2022 (US$ Mn)

TABLE 104 United States Vacation Ownership Market, by Location and Geography, 2023-2030 (US$ Mn)

TABLE 105 United States Vacation Ownership Market, by Developer and Brand, 2017-2022 (US$ Mn)

TABLE 106 United States Vacation Ownership Market, by Developer and Brand, 2023-2030 (US$ Mn)

TABLE 107 United States Vacation Ownership Market, by Exchange Programs, 2017-2022 (US$ Mn)

TABLE 108 United States Vacation Ownership Market, by Exchange Programs, 2023-2030 (US$ Mn)

TABLE 109 United States Vacation Ownership Market, by Price Tier, 2017-2022 (US$ Mn)

TABLE 110 United States Vacation Ownership Market, by Price Tier, 2023-2030 (US$ Mn)

TABLE 111 United States Vacation Ownership Market, by Ownership Use, 2017-2022 (US$ Mn)

TABLE 112 United States Vacation Ownership Market, by Ownership Use, 2023-2030 (US$ Mn)

TABLE 113 United States Vacation Ownership Market, by Ownership Resale Market, 2017-2022 (US$ Mn)

TABLE 114 United States Vacation Ownership Market, by Ownership Resale Market, 2023-2030 (US$ Mn)

TABLE 115 Canada Vacation Ownership Market, by Ownership Type, 2017-2022 (US$ Mn)

TABLE 116 Canada Vacation Ownership Market, by Ownership Type, 2023-2030 (US$ Mn)

TABLE 117 Canada Vacation Ownership Market, by Resort Type, 2017-2022 (US$ Mn)

TABLE 118 Canada Vacation Ownership Market, by Resort Type, 2023-2030 (US$ Mn)

TABLE 119 Canada Vacation Ownership Market, by Ownership Duration, 2017-2022 (US$ Mn)

TABLE 120 Canada Vacation Ownership Market, by Ownership Duration, 2023-2030 (US$ Mn)

TABLE 121 Canada Vacation Ownership Market, by Location and Geography, 2017-2022 (US$ Mn)

TABLE 122 Canada Vacation Ownership Market, by Location and Geography, 2023-2030 (US$ Mn)

TABLE 123 Canada Vacation Ownership Market, by Developer and Brand, 2017-2022 (US$ Mn)

TABLE 124 Canada Vacation Ownership Market, by Developer and Brand, 2023-2030 (US$ Mn)

TABLE 125 Canada Vacation Ownership Market, by Exchange Programs, 2017-2022 (US$ Mn)

TABLE 126 Canada Vacation Ownership Market, by Exchange Programs, 2023-2030 (US$ Mn)

TABLE 127 Canada Vacation Ownership Market, by Price Tier, 2017-2022 (US$ Mn)

TABLE 128 Canada Vacation Ownership Market, by Price Tier, 2023-2030 (US$ Mn)

TABLE 129 Canada Vacation Ownership Market, by Ownership Use, 2017-2022 (US$ Mn)

TABLE 130 Canada Vacation Ownership Market, by Ownership Use, 2023-2030 (US$ Mn)

TABLE 131 Canada Vacation Ownership Market, by Ownership Resale Market, 2017-2022 (US$ Mn)

TABLE 132 Canada Vacation Ownership Market, by Ownership Resale Market, 2023-2030 (US$ Mn)

TABLE 133 Mexico Vacation Ownership Market, by Ownership Type, 2017-2022 (US$ Mn)

TABLE 134 Mexico Vacation Ownership Market, by Ownership Type, 2023-2030 (US$ Mn)

TABLE 135 Mexico Vacation Ownership Market, by Resort Type, 2017-2022 (US$ Mn)

TABLE 136 Mexico Vacation Ownership Market, by Resort Type, 2023-2030 (US$ Mn)

TABLE 137 Mexico Vacation Ownership Market, by Ownership Duration, 2017-2022 (US$ Mn)

TABLE 138 Mexico Vacation Ownership Market, by Ownership Duration, 2023-2030 (US$ Mn)

TABLE 139 Mexico Vacation Ownership Market, by Location and Geography, 2017-2022 (US$ Mn)

TABLE 140 Mexico Vacation Ownership Market, by Location and Geography, 2023-2030 (US$ Mn)

TABLE 141 Mexico Vacation Ownership Market, by Developer and Brand, 2017-2022 (US$ Mn)

TABLE 142 Mexico Vacation Ownership Market, by Developer and Brand, 2023-2030 (US$ Mn)

TABLE 143 Mexico Vacation Ownership Market, by Exchange Programs, 2017-2022 (US$ Mn)

TABLE 144 Mexico Vacation Ownership Market, by Exchange Programs, 2023-2030 (US$ Mn)

TABLE 145 Mexico Vacation Ownership Market, by Price Tier, 2017-2022 (US$ Mn)

TABLE 146 Mexico Vacation Ownership Market, by Price Tier, 2023-2030 (US$ Mn)

TABLE 147 Mexico Vacation Ownership Market, by Ownership Use, 2017-2022 (US$ Mn)

TABLE 148 Mexico Vacation Ownership Market, by Ownership Use, 2023-2030 (US$ Mn)

TABLE 149 Mexico Vacation Ownership Market, by Ownership Resale Market, 2017-2022 (US$ Mn)

TABLE 150 Mexico Vacation Ownership Market, by Ownership Resale Market, 2023-2030 (US$ Mn)

TABLE 151 Europe Vacation Ownership Market, by Ownership Type, 2017-2022 (US$ Mn)

TABLE 152 Europe Vacation Ownership Market, by Ownership Type, 2023-2030 (US$ Mn)

TABLE 153 Europe Vacation Ownership Market, by Resort Type, 2017-2022 (US$ Mn)

TABLE 154 Europe Vacation Ownership Market, by Resort Type, 2023-2030 (US$ Mn)

TABLE 155 Europe Vacation Ownership Market, by Ownership Duration, 2017-2022 (US$ Mn)

TABLE 156 Europe Vacation Ownership Market, by Ownership Duration, 2023-2030 (US$ Mn)

TABLE 157 Europe Vacation Ownership Market, by Location and Geography, 2017-2022 (US$ Mn)

TABLE 158 Europe Vacation Ownership Market, by Location and Geography, 2023-2030 (US$ Mn)

TABLE 159 Europe Vacation Ownership Market, by Developer and Brand, 2017-2022 (US$ Mn)

TABLE 160 Europe Vacation Ownership Market, by Developer and Brand, 2023-2030 (US$ Mn)

TABLE 161 Europe Vacation Ownership Market, by Exchange Programs, 2017-2022 (US$ Mn)

TABLE 162 Europe Vacation Ownership Market, by Exchange Programs, 2023-2030 (US$ Mn)

TABLE 163 Europe Vacation Ownership Market, by Price Tier, 2017-2022 (US$ Mn)

TABLE 164 Europe Vacation Ownership Market, by Price Tier, 2023-2030 (US$ Mn)

TABLE 165 Europe Vacation Ownership Market, by Ownership Use, 2017-2022 (US$ Mn)

TABLE 166 Europe Vacation Ownership Market, by Ownership Use, 2023-2030 (US$ Mn)

TABLE 167 Europe Vacation Ownership Market, by Ownership Resale Market, 2017-2022 (US$ Mn)

TABLE 168 Europe Vacation Ownership Market, by Ownership Resale Market, 2023-2030 (US$ Mn)

TABLE 169 Europe Vacation Ownership Market, by Country, 2017-2022 (US$ Mn)

TABLE 170 Europe Vacation Ownership Market, by Country, 2023-2030 (US$ Mn)

TABLE 171 Germany Vacation Ownership Market, by Ownership Type, 2017-2022 (US$ Mn)

TABLE 172 Germany Vacation Ownership Market, by Ownership Type, 2023-2030 (US$ Mn)

TABLE 173 Germany Vacation Ownership Market, by Resort Type, 2017-2022 (US$ Mn)

TABLE 174 Germany Vacation Ownership Market, by Resort Type, 2023-2030 (US$ Mn)

TABLE 175 Germany Vacation Ownership Market, by Ownership Duration, 2017-2022 (US$ Mn)

TABLE 176 Germany Vacation Ownership Market, by Ownership Duration, 2023-2030 (US$ Mn)

TABLE 177 Germany Vacation Ownership Market, by Location and Geography, 2017-2022 (US$ Mn)

TABLE 178 Germany Vacation Ownership Market, by Location and Geography, 2023-2030 (US$ Mn)

TABLE 179 Germany Vacation Ownership Market, by Developer and Brand, 2017-2022 (US$ Mn)

TABLE 180 Germany Vacation Ownership Market, by Developer and Brand, 2023-2030 (US$ Mn)

TABLE 181 Germany Vacation Ownership Market, by Exchange Programs, 2017-2022 (US$ Mn)

TABLE 182 Germany Vacation Ownership Market, by Exchange Programs, 2023-2030 (US$ Mn)

TABLE 183 Germany Vacation Ownership Market, by Price Tier, 2017-2022 (US$ Mn)

TABLE 184 Germany Vacation Ownership Market, by Price Tier, 2023-2030 (US$ Mn)

TABLE 185 Germany Vacation Ownership Market, by Ownership Use, 2017-2022 (US$ Mn)

TABLE 186 Germany Vacation Ownership Market, by Ownership Use, 2023-2030 (US$ Mn)

TABLE 187 Germany Vacation Ownership Market, by Ownership Resale Market, 2017-2022 (US$ Mn)

TABLE 188 Germany Vacation Ownership Market, by Ownership Resale Market, 2023-2030 (US$ Mn)

TABLE 189 France Vacation Ownership Market, by Ownership Type, 2017-2022 (US$ Mn)

TABLE 190 France Vacation Ownership Market, by Ownership Type, 2023-2030 (US$ Mn)

TABLE 191 France Vacation Ownership Market, by Resort Type, 2017-2022 (US$ Mn)

TABLE 192 France Vacation Ownership Market, by Resort Type, 2023-2030 (US$ Mn)

TABLE 193 France Vacation Ownership Market, by Ownership Duration, 2017-2022 (US$ Mn)

TABLE 194 France Vacation Ownership Market, by Ownership Duration, 2023-2030 (US$ Mn)

TABLE 195 France Vacation Ownership Market, by Location and Geography, 2017-2022 (US$ Mn)

TABLE 196 France Vacation Ownership Market, by Location and Geography, 2023-2030 (US$ Mn)

TABLE 197 France Vacation Ownership Market, by Developer and Brand, 2017-2022 (US$ Mn)

TABLE 198 France Vacation Ownership Market, by Developer and Brand, 2023-2030 (US$ Mn)

TABLE 199 France Vacation Ownership Market, by Exchange Programs, 2017-2022 (US$ Mn)

TABLE 200 France Vacation Ownership Market, by Exchange Programs, 2023-2030 (US$ Mn)

TABLE 201 France Vacation Ownership Market, by Price Tier, 2017-2022 (US$ Mn)

TABLE 202 France Vacation Ownership Market, by Price Tier, 2023-2030 (US$ Mn)

TABLE 203 France Vacation Ownership Market, by Ownership Use, 2017-2022 (US$ Mn)

TABLE 204 France Vacation Ownership Market, by Ownership Use, 2023-2030 (US$ Mn)

TABLE 205 France Vacation Ownership Market, by Ownership Resale Market, 2017-2022 (US$ Mn)

TABLE 206 France Vacation Ownership Market, by Ownership Resale Market, 2023-2030 (US$ Mn)

TABLE 207 United Kingdom Vacation Ownership Market, by Ownership Type, 2017-2022 (US$ Mn)

TABLE 208 United Kingdom Vacation Ownership Market, by Ownership Type, 2023-2030 (US$ Mn)

TABLE 209 United Kingdom Vacation Ownership Market, by Resort Type, 2017-2022 (US$ Mn)

TABLE 210 United Kingdom Vacation Ownership Market, by Resort Type, 2023-2030 (US$ Mn)

TABLE 211 United Kingdom Vacation Ownership Market, by Ownership Duration, 2017-2022 (US$ Mn)

TABLE 212 United Kingdom Vacation Ownership Market, by Ownership Duration, 2023-2030 (US$ Mn)

TABLE 213 United Kingdom Vacation Ownership Market, by Location and Geography, 2017-2022 (US$ Mn)

TABLE 214 United Kingdom Vacation Ownership Market, by Location and Geography, 2023-2030 (US$ Mn)

TABLE 215 United Kingdom Vacation Ownership Market, by Developer and Brand, 2017-2022 (US$ Mn)

TABLE 216 United Kingdom Vacation Ownership Market, by Developer and Brand, 2023-2030 (US$ Mn)

TABLE 217 United Kingdom Vacation Ownership Market, by Exchange Programs, 2017-2022 (US$ Mn)

TABLE 218 United Kingdom Vacation Ownership Market, by Exchange Programs, 2023-2030 (US$ Mn)

TABLE 219 United Kingdom Vacation Ownership Market, by Price Tier, 2017-2022 (US$ Mn)

TABLE 220 United Kingdom Vacation Ownership Market, by Price Tier, 2023-2030 (US$ Mn)

TABLE 221 United Kingdom Vacation Ownership Market, by Ownership Use, 2017-2022 (US$ Mn)

TABLE 222 United Kingdom Vacation Ownership Market, by Ownership Use, 2023-2030 (US$ Mn)

TABLE 223 United Kingdom Vacation Ownership Market, by Ownership Resale Market, 2017-2022 (US$ Mn)

TABLE 224 United Kingdom Vacation Ownership Market, by Ownership Resale Market, 2023-2030 (US$ Mn)

TABLE 225 Italy Vacation Ownership Market, by Ownership Type, 2017-2022 (US$ Mn)

TABLE 226 Italy Vacation Ownership Market, by Ownership Type, 2023-2030 (US$ Mn)

TABLE 227 Italy Vacation Ownership Market, by Resort Type, 2017-2022 (US$ Mn)

TABLE 228 Italy Vacation Ownership Market, by Resort Type, 2023-2030 (US$ Mn)

TABLE 229 Italy Vacation Ownership Market, by Ownership Duration, 2017-2022 (US$ Mn)

TABLE 230 Italy Vacation Ownership Market, by Ownership Duration, 2023-2030 (US$ Mn)

TABLE 231 Italy Vacation Ownership Market, by Location and Geography, 2017-2022 (US$ Mn)

TABLE 232 Italy Vacation Ownership Market, by Location and Geography, 2023-2030 (US$ Mn)

TABLE 233 Italy Vacation Ownership Market, by Developer and Brand, 2017-2022 (US$ Mn)

TABLE 234 Italy Vacation Ownership Market, by Developer and Brand, 2023-2030 (US$ Mn)

TABLE 235 Italy Vacation Ownership Market, by Exchange Programs, 2017-2022 (US$ Mn)

TABLE 236 Italy Vacation Ownership Market, by Exchange Programs, 2023-2030 (US$ Mn)

TABLE 237 Italy Vacation Ownership Market, by Price Tier, 2017-2022 (US$ Mn)

TABLE 238 Italy Vacation Ownership Market, by Price Tier, 2023-2030 (US$ Mn)

TABLE 239 Italy Vacation Ownership Market, by Ownership Use, 2017-2022 (US$ Mn)

TABLE 240 Italy Vacation Ownership Market, by Ownership Use, 2023-2030 (US$ Mn)

TABLE 241 Italy Vacation Ownership Market, by Ownership Resale Market, 2017-2022 (US$ Mn)

TABLE 242 Italy Vacation Ownership Market, by Ownership Resale Market, 2023-2030 (US$ Mn)

TABLE 243 Spain Vacation Ownership Market, by Ownership Type, 2017-2022 (US$ Mn)

TABLE 244 Spain Vacation Ownership Market, by Ownership Type, 2023-2030 (US$ Mn)

TABLE 245 Spain Vacation Ownership Market, by Resort Type, 2017-2022 (US$ Mn)

TABLE 246 Spain Vacation Ownership Market, by Resort Type, 2023-2030 (US$ Mn)

TABLE 247 Spain Vacation Ownership Market, by Ownership Duration, 2017-2022 (US$ Mn)

TABLE 248 Spain Vacation Ownership Market, by Ownership Duration, 2023-2030 (US$ Mn)

TABLE 249 Spain Vacation Ownership Market, by Location and Geography, 2017-2022 (US$ Mn)

TABLE 250 Spain Vacation Ownership Market, by Location and Geography, 2023-2030 (US$ Mn)

TABLE 251 Spain Vacation Ownership Market, by Developer and Brand, 2017-2022 (US$ Mn)

TABLE 252 Spain Vacation Ownership Market, by Developer and Brand, 2023-2030 (US$ Mn)

TABLE 253 Spain Vacation Ownership Market, by Exchange Programs, 2017-2022 (US$ Mn)

TABLE 254 Spain Vacation Ownership Market, by Exchange Programs, 2023-2030 (US$ Mn)

TABLE 255 Spain Vacation Ownership Market, by Price Tier, 2017-2022 (US$ Mn)

TABLE 256 Spain Vacation Ownership Market, by Price Tier, 2023-2030 (US$ Mn)

TABLE 257 Spain Vacation Ownership Market, by Ownership Use, 2017-2022 (US$ Mn)

TABLE 258 Spain Vacation Ownership Market, by Ownership Use, 2023-2030 (US$ Mn)

TABLE 259 Spain Vacation Ownership Market, by Ownership Resale Market, 2017-2022 (US$ Mn)

TABLE 260 Spain Vacation Ownership Market, by Ownership Resale Market, 2023-2030 (US$ Mn)

TABLE 261 Benelux Vacation Ownership Market, by Ownership Type, 2017-2022 (US$ Mn)

TABLE 262 Benelux Vacation Ownership Market, by Ownership Type, 2023-2030 (US$ Mn)

TABLE 263 Benelux Vacation Ownership Market, by Resort Type, 2017-2022 (US$ Mn)

TABLE 264 Benelux Vacation Ownership Market, by Resort Type, 2023-2030 (US$ Mn)

TABLE 265 Benelux Vacation Ownership Market, by Ownership Duration, 2017-2022 (US$ Mn)

TABLE 266 Benelux Vacation Ownership Market, by Ownership Duration, 2023-2030 (US$ Mn)

TABLE 267 Benelux Vacation Ownership Market, by Location and Geography, 2017-2022 (US$ Mn)

TABLE 268 Benelux Vacation Ownership Market, by Location and Geography, 2023-2030 (US$ Mn)

TABLE 269 Benelux Vacation Ownership Market, by Developer and Brand, 2017-2022 (US$ Mn)

TABLE 270 Benelux Vacation Ownership Market, by Developer and Brand, 2023-2030 (US$ Mn)

TABLE 271 Benelux Vacation Ownership Market, by Exchange Programs, 2017-2022 (US$ Mn)

TABLE 272 Benelux Vacation Ownership Market, by Exchange Programs, 2023-2030 (US$ Mn)

TABLE 273 Benelux Vacation Ownership Market, by Price Tier, 2017-2022 (US$ Mn)

TABLE 274 Benelux Vacation Ownership Market, by Price Tier, 2023-2030 (US$ Mn)

TABLE 275 Benelux Vacation Ownership Market, by Ownership Use, 2017-2022 (US$ Mn)

TABLE 276 Benelux Vacation Ownership Market, by Ownership Use, 2023-2030 (US$ Mn)

TABLE 277 Benelux Vacation Ownership Market, by Ownership Resale Market, 2017-2022 (US$ Mn)

TABLE 278 Benelux Vacation Ownership Market, by Ownership Resale Market, 2023-2030 (US$ Mn)

TABLE 279 Russia Vacation Ownership Market, by Ownership Type, 2017-2022 (US$ Mn)

TABLE 280 Russia Vacation Ownership Market, by Ownership Type, 2023-2030 (US$ Mn)

TABLE 281 Russia Vacation Ownership Market, by Resort Type, 2017-2022 (US$ Mn)

TABLE 282 Russia Vacation Ownership Market, by Resort Type, 2023-2030 (US$ Mn)

TABLE 283 Russia Vacation Ownership Market, by Ownership Duration, 2017-2022 (US$ Mn)

TABLE 284 Russia Vacation Ownership Market, by Ownership Duration, 2023-2030 (US$ Mn)

TABLE 285 Russia Vacation Ownership Market, by Location and Geography, 2017-2022 (US$ Mn)

TABLE 286 Russia Vacation Ownership Market, by Location and Geography, 2023-2030 (US$ Mn)

TABLE 287 Russia Vacation Ownership Market, by Developer and Brand, 2017-2022 (US$ Mn)

TABLE 288 Russia Vacation Ownership Market, by Developer and Brand, 2023-2030 (US$ Mn)

TABLE 289 Russia Vacation Ownership Market, by Exchange Programs, 2017-2022 (US$ Mn)

TABLE 290 Russia Vacation Ownership Market, by Exchange Programs, 2023-2030 (US$ Mn)

TABLE 291 Russia Vacation Ownership Market, by Price Tier, 2017-2022 (US$ Mn)

TABLE 292 Russia Vacation Ownership Market, by Price Tier, 2023-2030 (US$ Mn)

TABLE 293 Russia Vacation Ownership Market, by Ownership Use, 2017-2022 (US$ Mn)

TABLE 294 Russia Vacation Ownership Market, by Ownership Use, 2023-2030 (US$ Mn)

TABLE 295 Russia Vacation Ownership Market, by Ownership Resale Market, 2017-2022 (US$ Mn)

TABLE 296 Russia Vacation Ownership Market, by Ownership Resale Market, 2023-2030 (US$ Mn)

TABLE 297 Rest of Europe Vacation Ownership Market, by Ownership Type, 2017-2022 (US$ Mn)

TABLE 298 Rest of Europe Vacation Ownership Market, by Ownership Type, 2023-2030 (US$ Mn)

TABLE 299 Rest of Europe Vacation Ownership Market, by Resort Type, 2017-2022 (US$ Mn)

TABLE 300 Rest of Europe Vacation Ownership Market, by Resort Type, 2023-2030 (US$ Mn)

TABLE 301 Rest of Europe Vacation Ownership Market, by Ownership Duration, 2017-2022 (US$ Mn)

TABLE 302 Rest of Europe Vacation Ownership Market, by Ownership Duration, 2023-2030 (US$ Mn)

TABLE 303 Rest of Europe Vacation Ownership Market, by Location and Geography, 2017-2022 (US$ Mn)

TABLE 304 Rest of Europe Vacation Ownership Market, by Location and Geography, 2023-2030 (US$ Mn)

TABLE 305 Rest of Europe Vacation Ownership Market, by Developer and Brand, 2017-2022 (US$ Mn)

TABLE 306 Rest of Europe Vacation Ownership Market, by Developer and Brand, 2023-2030 (US$ Mn)

TABLE 307 Rest of Europe Vacation Ownership Market, by Exchange Programs, 2017-2022 (US$ Mn)

TABLE 308 Rest of Europe Vacation Ownership Market, by Exchange Programs, 2023-2030 (US$ Mn)

TABLE 309 Rest of Europe Vacation Ownership Market, by Price Tier, 2017-2022 (US$ Mn)

TABLE 310 Rest of Europe Vacation Ownership Market, by Price Tier, 2023-2030 (US$ Mn)

TABLE 311 Rest of Europe Vacation Ownership Market, by Ownership Use, 2017-2022 (US$ Mn)

TABLE 312 Rest of Europe Vacation Ownership Market, by Ownership Use, 2023-2030 (US$ Mn)

TABLE 313 Rest of Europe Vacation Ownership Market, by Ownership Resale Market, 2017-2022 (US$ Mn)

TABLE 314 Rest of Europe Vacation Ownership Market, by Ownership Resale Market, 2023-2030 (US$ Mn)

TABLE 315 Asia Pacific Vacation Ownership Market, by Ownership Type, 2017-2022 (US$ Mn)

TABLE 316 Asia Pacific Vacation Ownership Market, by Ownership Type, 2023-2030 (US$ Mn)

TABLE 317 Asia Pacific Vacation Ownership Market, by Resort Type, 2017-2022 (US$ Mn)

TABLE 318 Asia Pacific Vacation Ownership Market, by Resort Type, 2023-2030 (US$ Mn)

TABLE 319 Asia Pacific Vacation Ownership Market, by Ownership Duration, 2017-2022 (US$ Mn)

TABLE 320 Asia Pacific Vacation Ownership Market, by Ownership Duration, 2023-2030 (US$ Mn)

TABLE 321 Asia Pacific Vacation Ownership Market, by Location and Geography, 2017-2022 (US$ Mn)

TABLE 322 Asia Pacific Vacation Ownership Market, by Location and Geography, 2023-2030 (US$ Mn)

TABLE 323 Asia Pacific Vacation Ownership Market, by Developer and Brand, 2017-2022 (US$ Mn)

TABLE 324 Asia Pacific Vacation Ownership Market, by Developer and Brand, 2023-2030 (US$ Mn)

TABLE 325 Asia Pacific Vacation Ownership Market, by Exchange Programs, 2017-2022 (US$ Mn)

TABLE 326 Asia Pacific Vacation Ownership Market, by Exchange Programs, 2023-2030 (US$ Mn)

TABLE 327 Asia Pacific Vacation Ownership Market, by Price Tier, 2017-2022 (US$ Mn)

TABLE 328 Asia Pacific Vacation Ownership Market, by Price Tier, 2023-2030 (US$ Mn)

TABLE 329 Asia Pacific Vacation Ownership Market, by Ownership Use, 2017-2022 (US$ Mn)

TABLE 330 Asia Pacific Vacation Ownership Market, by Ownership Use, 2023-2030 (US$ Mn)

TABLE 331 Asia Pacific Vacation Ownership Market, by Ownership Resale Market, 2017-2022 (US$ Mn)

TABLE 332 Asia Pacific Vacation Ownership Market, by Ownership Resale Market, 2023-2030 (US$ Mn)

TABLE 333 China Vacation Ownership Market, by Ownership Type, 2017-2022 (US$ Mn)

TABLE 334 China Vacation Ownership Market, by Ownership Type, 2023-2030 (US$ Mn)

TABLE 335 China Vacation Ownership Market, by Resort Type, 2017-2022 (US$ Mn)

TABLE 336 China Vacation Ownership Market, by Resort Type, 2023-2030 (US$ Mn)

TABLE 337 China Vacation Ownership Market, by Ownership Duration, 2017-2022 (US$ Mn)

TABLE 338 China Vacation Ownership Market, by Ownership Duration, 2023-2030 (US$ Mn)

TABLE 339 China Vacation Ownership Market, by Location and Geography, 2017-2022 (US$ Mn)

TABLE 340 China Vacation Ownership Market, by Location and Geography, 2023-2030 (US$ Mn)

TABLE 341 China Vacation Ownership Market, by Developer and Brand, 2017-2022 (US$ Mn)

TABLE 342 China Vacation Ownership Market, by Developer and Brand, 2023-2030 (US$ Mn)

TABLE 343 China Vacation Ownership Market, by Exchange Programs, 2017-2022 (US$ Mn)

TABLE 344 China Vacation Ownership Market, by Exchange Programs, 2023-2030 (US$ Mn)

TABLE 345 China Vacation Ownership Market, by Price Tier, 2017-2022 (US$ Mn)

TABLE 346 China Vacation Ownership Market, by Price Tier, 2023-2030 (US$ Mn)

TABLE 347 China Vacation Ownership Market, by Ownership Use, 2017-2022 (US$ Mn)

TABLE 348 China Vacation Ownership Market, by Ownership Use, 2023-2030 (US$ Mn)

TABLE 349 China Vacation Ownership Market, by Ownership Resale Market, 2017-2022 (US$ Mn)

TABLE 350 China Vacation Ownership Market, by Ownership Resale Market, 2023-2030 (US$ Mn)

TABLE 351 Japan Vacation Ownership Market, by Ownership Type, 2017-2022 (US$ Mn)

TABLE 352 Japan Vacation Ownership Market, by Ownership Type, 2023-2030 (US$ Mn)

TABLE 353 Japan Vacation Ownership Market, by Resort Type, 2017-2022 (US$ Mn)

TABLE 354 Japan Vacation Ownership Market, by Resort Type, 2023-2030 (US$ Mn)

TABLE 355 Japan Vacation Ownership Market, by Ownership Duration, 2017-2022 (US$ Mn)

TABLE 356 Japan Vacation Ownership Market, by Ownership Duration, 2023-2030 (US$ Mn)

TABLE 357 Japan Vacation Ownership Market, by Location and Geography, 2017-2022 (US$ Mn)

TABLE 358 Japan Vacation Ownership Market, by Location and Geography, 2023-2030 (US$ Mn)

TABLE 359 Japan Vacation Ownership Market, by Developer and Brand, 2017-2022 (US$ Mn)

TABLE 360 Japan Vacation Ownership Market, by Developer and Brand, 2023-2030 (US$ Mn)

TABLE 361 Japan Vacation Ownership Market, by Exchange Programs, 2017-2022 (US$ Mn)

TABLE 362 Japan Vacation Ownership Market, by Exchange Programs, 2023-2030 (US$ Mn)

TABLE 363 Japan Vacation Ownership Market, by Price Tier, 2017-2022 (US$ Mn)

TABLE 364 Japan Vacation Ownership Market, by Price Tier, 2023-2030 (US$ Mn)

TABLE 365 Japan Vacation Ownership Market, by Ownership Use, 2017-2022 (US$ Mn)

TABLE 366 Japan Vacation Ownership Market, by Ownership Use, 2023-2030 (US$ Mn)

TABLE 367 Japan Vacation Ownership Market, by Ownership Resale Market, 2017-2022 (US$ Mn)

TABLE 368 Japan Vacation Ownership Market, by Ownership Resale Market, 2023-2030 (US$ Mn)

TABLE 369 India Vacation Ownership Market, by Ownership Type, 2017-2022 (US$ Mn)

TABLE 370 India Vacation Ownership Market, by Ownership Type, 2023-2030 (US$ Mn)

TABLE 371 India Vacation Ownership Market, by Resort Type, 2017-2022 (US$ Mn)

TABLE 372 India Vacation Ownership Market, by Resort Type, 2023-2030 (US$ Mn)

TABLE 373 India Vacation Ownership Market, by Ownership Duration, 2017-2022 (US$ Mn)

TABLE 374 India Vacation Ownership Market, by Ownership Duration, 2023-2030 (US$ Mn)

TABLE 375 India Vacation Ownership Market, by Location and Geography, 2017-2022 (US$ Mn)

TABLE 376 India Vacation Ownership Market, by Location and Geography, 2023-2030 (US$ Mn)

TABLE 377 India Vacation Ownership Market, by Developer and Brand, 2017-2022 (US$ Mn)

TABLE 378 India Vacation Ownership Market, by Developer and Brand, 2023-2030 (US$ Mn)

TABLE 379 India Vacation Ownership Market, by Exchange Programs, 2017-2022 (US$ Mn)

TABLE 380 India Vacation Ownership Market, by Exchange Programs, 2023-2030 (US$ Mn)

TABLE 381 India Vacation Ownership Market, by Price Tier, 2017-2022 (US$ Mn)

TABLE 382 India Vacation Ownership Market, by Price Tier, 2023-2030 (US$ Mn)

TABLE 383 India Vacation Ownership Market, by Ownership Use, 2017-2022 (US$ Mn)

TABLE 384 India Vacation Ownership Market, by Ownership Use, 2023-2030 (US$ Mn)

TABLE 385 India Vacation Ownership Market, by Ownership Resale Market, 2017-2022 (US$ Mn)

TABLE 386 India Vacation Ownership Market, by Ownership Resale Market, 2023-2030 (US$ Mn)

TABLE 387 South Korea Vacation Ownership Market, by Ownership Type, 2017-2022 (US$ Mn)

TABLE 388 South Korea Vacation Ownership Market, by Ownership Type, 2023-2030 (US$ Mn)

TABLE 389 South Korea Vacation Ownership Market, by Resort Type, 2017-2022 (US$ Mn)

TABLE 390 South Korea Vacation Ownership Market, by Resort Type, 2023-2030 (US$ Mn)

TABLE 391 South Korea Vacation Ownership Market, by Ownership Duration, 2017-2022 (US$ Mn)

TABLE 392 South Korea Vacation Ownership Market, by Ownership Duration, 2023-2030 (US$ Mn)

TABLE 393 South Korea Vacation Ownership Market, by Location and Geography, 2017-2022 (US$ Mn)

TABLE 394 South Korea Vacation Ownership Market, by Location and Geography, 2023-2030 (US$ Mn)

TABLE 395 South Korea Vacation Ownership Market, by Developer and Brand, 2017-2022 (US$ Mn)

TABLE 396 South Korea Vacation Ownership Market, by Developer and Brand, 2023-2030 (US$ Mn)

TABLE 397 South Korea Vacation Ownership Market, by Exchange Programs, 2017-2022 (US$ Mn)

TABLE 398 South Korea Vacation Ownership Market, by Exchange Programs, 2023-2030 (US$ Mn)

TABLE 399 South Korea Vacation Ownership Market, by Price Tier, 2017-2022 (US$ Mn)

TABLE 400 South Korea Vacation Ownership Market, by Price Tier, 2023-2030 (US$ Mn)

TABLE 401 South Korea Vacation Ownership Market, by Ownership Use, 2017-2022 (US$ Mn)

TABLE 402 South Korea Vacation Ownership Market, by Ownership Use, 2023-2030 (US$ Mn)

TABLE 403 South Korea Vacation Ownership Market, by Ownership Resale Market, 2017-2022 (US$ Mn)

TABLE 404 South Korea Vacation Ownership Market, by Ownership Resale Market, 2023-2030 (US$ Mn)

TABLE 405 South-East Asia Vacation Ownership Market, by Ownership Type, 2017-2022 (US$ Mn)

TABLE 406 South-East Asia Vacation Ownership Market, by Ownership Type, 2023-2030 (US$ Mn)

TABLE 407 South-East Asia Vacation Ownership Market, by Resort Type, 2017-2022 (US$ Mn)

TABLE 408 South-East Asia Vacation Ownership Market, by Resort Type, 2023-2030 (US$ Mn)

TABLE 409 South-East Asia Vacation Ownership Market, by Ownership Duration, 2017-2022 (US$ Mn)

TABLE 410 South-East Asia Vacation Ownership Market, by Ownership Duration, 2023-2030 (US$ Mn)

TABLE 411 South-East Asia Vacation Ownership Market, by Location and Geography, 2017-2022 (US$ Mn)

TABLE 412 South-East Asia Vacation Ownership Market, by Location and Geography, 2023-2030 (US$ Mn)

TABLE 413 South-East Asia Vacation Ownership Market, by Developer and Brand, 2017-2022 (US$ Mn)

TABLE 414 South-East Asia Vacation Ownership Market, by Developer and Brand, 2023-2030 (US$ Mn)

TABLE 415 South-East Asia Vacation Ownership Market, by Exchange Programs, 2017-2022 (US$ Mn)

TABLE 416 South-East Asia Vacation Ownership Market, by Exchange Programs, 2023-2030 (US$ Mn)

TABLE 417 South-East Asia Vacation Ownership Market, by Price Tier, 2017-2022 (US$ Mn)

TABLE 418 South-East Asia Vacation Ownership Market, by Price Tier, 2023-2030 (US$ Mn)

TABLE 419 South-East Asia Vacation Ownership Market, by Ownership Use, 2017-2022 (US$ Mn)

TABLE 420 South-East Asia Vacation Ownership Market, by Ownership Use, 2023-2030 (US$ Mn)

TABLE 421 South-East Asia Vacation Ownership Market, by Ownership Resale Market, 2017-2022 (US$ Mn)

TABLE 422 South-East Asia Vacation Ownership Market, by Ownership Resale Market, 2023-2030 (US$ Mn)

TABLE 423 Rest of Asia Pacific Vacation Ownership Market, by Ownership Type, 2017-2022 (US$ Mn)

TABLE 424 Rest of Asia Pacific Vacation Ownership Market, by Ownership Type, 2023-2030 (US$ Mn)

TABLE 425 Rest of Asia Pacific Vacation Ownership Market, by Resort Type, 2017-2022 (US$ Mn)

TABLE 426 Rest of Asia Pacific Vacation Ownership Market, by Resort Type, 2023-2030 (US$ Mn)

TABLE 427 Rest of Asia Pacific Vacation Ownership Market, by Ownership Duration, 2017-2022 (US$ Mn)

TABLE 428 Rest of Asia Pacific Vacation Ownership Market, by Ownership Duration, 2023-2030 (US$ Mn)

TABLE 429 Rest of Asia Pacific Vacation Ownership Market, by Location and Geography, 2017-2022 (US$ Mn)

TABLE 430 Rest of Asia Pacific Vacation Ownership Market, by Location and Geography, 2023-2030 (US$ Mn)

TABLE 431 Rest of Asia Pacific Vacation Ownership Market, by Developer and Brand, 2017-2022 (US$ Mn)

TABLE 432 Rest of Asia Pacific Vacation Ownership Market, by Developer and Brand, 2023-2030 (US$ Mn)

TABLE 433 Rest of Asia Pacific Vacation Ownership Market, by Exchange Programs, 2017-2022 (US$ Mn)

TABLE 434 Rest of Asia Pacific Vacation Ownership Market, by Exchange Programs, 2023-2030 (US$ Mn)

TABLE 435 Rest of Asia Pacific Vacation Ownership Market, by Price Tier, 2017-2022 (US$ Mn)

TABLE 436 Rest of Asia Pacific Vacation Ownership Market, by Price Tier, 2023-2030 (US$ Mn)

TABLE 437 Rest of Asia Pacific Vacation Ownership Market, by Ownership Use, 2017-2022 (US$ Mn)

TABLE 438 Rest of Asia Pacific Vacation Ownership Market, by Ownership Use, 2023-2030 (US$ Mn)

TABLE 439 Rest of Asia Pacific Vacation Ownership Market, by Ownership Resale Market, 2017-2022 (US$ Mn)

TABLE 440 Rest of Asia Pacific Vacation Ownership Market, by Ownership Resale Market, 2023-2030 (US$ Mn)

TABLE 441 Latin America Vacation Ownership Market, by Ownership Type, 2017-2022 (US$ Mn)

TABLE 442 Latin America Vacation Ownership Market, by Ownership Type, 2023-2030 (US$ Mn)

TABLE 443 Latin America Vacation Ownership Market, by Resort Type, 2017-2022 (US$ Mn)

TABLE 444 Latin America Vacation Ownership Market, by Resort Type, 2023-2030 (US$ Mn)

TABLE 445 Latin America Vacation Ownership Market, by Ownership Duration, 2017-2022 (US$ Mn)

TABLE 446 Latin America Vacation Ownership Market, by Ownership Duration, 2023-2030 (US$ Mn)

TABLE 447 Latin America Vacation Ownership Market, by Location and Geography, 2017-2022 (US$ Mn)

TABLE 448 Latin America Vacation Ownership Market, by Location and Geography, 2023-2030 (US$ Mn)

TABLE 449 Latin America Vacation Ownership Market, by Developer and Brand, 2017-2022 (US$ Mn)

TABLE 450 Latin America Vacation Ownership Market, by Developer and Brand, 2023-2030 (US$ Mn)

TABLE 451 Latin America Vacation Ownership Market, by Exchange Programs, 2017-2022 (US$ Mn)

TABLE 452 Latin America Vacation Ownership Market, by Exchange Programs, 2023-2030 (US$ Mn)

TABLE 453 Latin America Vacation Ownership Market, by Price Tier, 2017-2022 (US$ Mn)

TABLE 454 Latin America Vacation Ownership Market, by Price Tier, 2023-2030 (US$ Mn)

TABLE 455 Latin America Vacation Ownership Market, by Ownership Use, 2017-2022 (US$ Mn)

TABLE 456 Latin America Vacation Ownership Market, by Ownership Use, 2023-2030 (US$ Mn)

TABLE 457 Latin America Vacation Ownership Market, by Ownership Resale Market, 2017-2022 (US$ Mn)

TABLE 458 Latin America Vacation Ownership Market, by Ownership Resale Market, 2023-2030 (US$ Mn)

TABLE 459 Brazil Vacation Ownership Market, by Ownership Type, 2017-2022 (US$ Mn)

TABLE 460 Brazil Vacation Ownership Market, by Ownership Type, 2023-2030 (US$ Mn)

TABLE 461 Brazil Vacation Ownership Market, by Resort Type, 2017-2022 (US$ Mn)

TABLE 462 Brazil Vacation Ownership Market, by Resort Type, 2023-2030 (US$ Mn)

TABLE 463 Brazil Vacation Ownership Market, by Ownership Duration, 2017-2022 (US$ Mn)

TABLE 464 Brazil Vacation Ownership Market, by Ownership Duration, 2023-2030 (US$ Mn)

TABLE 465 Brazil Vacation Ownership Market, by Location and Geography, 2017-2022 (US$ Mn)

TABLE 466 Brazil Vacation Ownership Market, by Location and Geography, 2023-2030 (US$ Mn)

TABLE 467 Brazil Vacation Ownership Market, by Developer and Brand, 2017-2022 (US$ Mn)

TABLE 468 Brazil Vacation Ownership Market, by Developer and Brand, 2023-2030 (US$ Mn)

TABLE 469 Brazil Vacation Ownership Market, by Exchange Programs, 2017-2022 (US$ Mn)

TABLE 470 Brazil Vacation Ownership Market, by Exchange Programs, 2023-2030 (US$ Mn)

TABLE 471 Brazil Vacation Ownership Market, by Price Tier, 2017-2022 (US$ Mn)

TABLE 472 Brazil Vacation Ownership Market, by Price Tier, 2023-2030 (US$ Mn)

TABLE 473 Brazil Vacation Ownership Market, by Ownership Use, 2017-2022 (US$ Mn)

TABLE 474 Brazil Vacation Ownership Market, by Ownership Use, 2023-2030 (US$ Mn)

TABLE 475 Brazil Vacation Ownership Market, by Ownership Resale Market, 2017-2022 (US$ Mn)

TABLE 476 Brazil Vacation Ownership Market, by Ownership Resale Market, 2023-2030 (US$ Mn)

TABLE 477 Argentina Vacation Ownership Market, by Ownership Type, 2017-2022 (US$ Mn)

TABLE 478 Argentina Vacation Ownership Market, by Ownership Type, 2023-2030 (US$ Mn)

TABLE 479 Argentina Vacation Ownership Market, by Resort Type, 2017-2022 (US$ Mn)

TABLE 480 Argentina Vacation Ownership Market, by Resort Type, 2023-2030 (US$ Mn)

TABLE 481 Argentina Vacation Ownership Market, by Ownership Duration, 2017-2022 (US$ Mn)

TABLE 482 Argentina Vacation Ownership Market, by Ownership Duration, 2023-2030 (US$ Mn)

TABLE 483 Argentina Vacation Ownership Market, by Location and Geography, 2017-2022 (US$ Mn)

TABLE 484 Argentina Vacation Ownership Market, by Location and Geography, 2023-2030 (US$ Mn)

TABLE 485 Argentina Vacation Ownership Market, by Developer and Brand, 2017-2022 (US$ Mn)

TABLE 486 Argentina Vacation Ownership Market, by Developer and Brand, 2023-2030 (US$ Mn)

TABLE 487 Argentina Vacation Ownership Market, by Exchange Programs, 2017-2022 (US$ Mn)

TABLE 488 Argentina Vacation Ownership Market, by Exchange Programs, 2023-2030 (US$ Mn)

TABLE 489 Argentina Vacation Ownership Market, by Price Tier, 2017-2022 (US$ Mn)

TABLE 490 Argentina Vacation Ownership Market, by Price Tier, 2023-2030 (US$ Mn)

TABLE 491 Argentina Vacation Ownership Market, by Ownership Use, 2017-2022 (US$ Mn)

TABLE 492 Argentina Vacation Ownership Market, by Ownership Use, 2023-2030 (US$ Mn)

TABLE 493 Argentina Vacation Ownership Market, by Ownership Resale Market, 2017-2022 (US$ Mn)

TABLE 494 Argentina Vacation Ownership Market, by Ownership Resale Market, 2023-2030 (US$ Mn)

TABLE 495 Rest of Latin America Vacation Ownership Market, by Ownership Type, 2017-2022 (US$ Mn)

TABLE 496 Rest of Latin America Vacation Ownership Market, by Ownership Type, 2023-2030 (US$ Mn)

TABLE 497 Rest of Latin America Vacation Ownership Market, by Resort Type, 2017-2022 (US$ Mn)

TABLE 498 Rest of Latin America Vacation Ownership Market, by Resort Type, 2023-2030 (US$ Mn)

TABLE 499 Rest of Latin America Vacation Ownership Market, by Ownership Duration, 2017-2022 (US$ Mn)

TABLE 500 Rest of Latin America Vacation Ownership Market, by Ownership Duration, 2023-2030 (US$ Mn)

TABLE 501 Rest of Latin America Vacation Ownership Market, by Location and Geography, 2017-2022 (US$ Mn)

TABLE 502 Rest of Latin America Vacation Ownership Market, by Location and Geography, 2023-2030 (US$ Mn)

TABLE 503 Rest of Latin America Vacation Ownership Market, by Developer and Brand, 2017-2022 (US$ Mn)

TABLE 504 Rest of Latin America Vacation Ownership Market, by Developer and Brand, 2023-2030 (US$ Mn)

TABLE 505 Rest of Latin America Vacation Ownership Market, by Exchange Programs, 2017-2022 (US$ Mn)

TABLE 506 Rest of Latin America Vacation Ownership Market, by Exchange Programs, 2023-2030 (US$ Mn)

TABLE 507 Rest of Latin America Vacation Ownership Market, by Price Tier, 2017-2022 (US$ Mn)

TABLE 508 Rest of Latin America Vacation Ownership Market, by Price Tier, 2023-2030 (US$ Mn)

TABLE 509 Rest of Latin America Vacation Ownership Market, by Ownership Use, 2017-2022 (US$ Mn)

TABLE 510 Rest of Latin America Vacation Ownership Market, by Ownership Use, 2023-2030 (US$ Mn)

TABLE 511 Rest of Latin America Vacation Ownership Market, by Ownership Resale Market, 2017-2022 (US$ Mn)

TABLE 512 Rest of Latin America Vacation Ownership Market, by Ownership Resale Market, 2023-2030 (US$ Mn)

TABLE 513 Middle East Vacation Ownership Market, by Ownership Type, 2017-2022 (US$ Mn)

TABLE 514 Middle East Vacation Ownership Market, by Ownership Type, 2023-2030 (US$ Mn)

TABLE 515 Middle East Vacation Ownership Market, by Resort Type, 2017-2022 (US$ Mn)

TABLE 516 Middle East Vacation Ownership Market, by Resort Type, 2023-2030 (US$ Mn)

TABLE 517 Middle East Vacation Ownership Market, by Ownership Duration, 2017-2022 (US$ Mn)

TABLE 518 Middle East Vacation Ownership Market, by Ownership Duration, 2023-2030 (US$ Mn)

TABLE 519 Middle East Vacation Ownership Market, by Location and Geography, 2017-2022 (US$ Mn)

TABLE 520 Middle East Vacation Ownership Market, by Location and Geography, 2023-2030 (US$ Mn)

TABLE 521 Middle East Vacation Ownership Market, by Developer and Brand, 2017-2022 (US$ Mn)

TABLE 522 Middle East Vacation Ownership Market, by Developer and Brand, 2023-2030 (US$ Mn)

TABLE 523 Middle East Vacation Ownership Market, by Exchange Programs, 2017-2022 (US$ Mn)

TABLE 524 Middle East Vacation Ownership Market, by Exchange Programs, 2023-2030 (US$ Mn)

TABLE 525 Middle East Vacation Ownership Market, by Price Tier, 2017-2022 (US$ Mn)

TABLE 526 Middle East Vacation Ownership Market, by Price Tier, 2023-2030 (US$ Mn)

TABLE 527 Middle East Vacation Ownership Market, by Ownership Use, 2017-2022 (US$ Mn)

TABLE 528 Middle East Vacation Ownership Market, by Ownership Use, 2023-2030 (US$ Mn)

TABLE 529 Middle East Vacation Ownership Market, by Ownership Resale Market, 2017-2022 (US$ Mn)

TABLE 530 Middle East Vacation Ownership Market, by Ownership Resale Market, 2023-2030 (US$ Mn)

TABLE 531 UAE Vacation Ownership Market, by Ownership Type, 2017-2022 (US$ Mn)

TABLE 532 UAE Vacation Ownership Market, by Ownership Type, 2023-2030 (US$ Mn)

TABLE 533 UAE Vacation Ownership Market, by Resort Type, 2017-2022 (US$ Mn)

TABLE 534 UAE Vacation Ownership Market, by Resort Type, 2023-2030 (US$ Mn)

TABLE 535 UAE Vacation Ownership Market, by Ownership Duration, 2017-2022 (US$ Mn)

TABLE 536 UAE Vacation Ownership Market, by Ownership Duration, 2023-2030 (US$ Mn)

TABLE 537 UAE Vacation Ownership Market, by Location and Geography, 2017-2022 (US$ Mn)

TABLE 538 UAE Vacation Ownership Market, by Location and Geography, 2023-2030 (US$ Mn)

TABLE 539 UAE Vacation Ownership Market, by Developer and Brand, 2017-2022 (US$ Mn)

TABLE 540 UAE Vacation Ownership Market, by Developer and Brand, 2023-2030 (US$ Mn)

TABLE 541 UAE Vacation Ownership Market, by Exchange Programs, 2017-2022 (US$ Mn)

TABLE 542 UAE Vacation Ownership Market, by Exchange Programs, 2023-2030 (US$ Mn)

TABLE 543 UAE Vacation Ownership Market, by Price Tier, 2017-2022 (US$ Mn)

TABLE 544 UAE Vacation Ownership Market, by Price Tier, 2023-2030 (US$ Mn)

TABLE 545 UAE Vacation Ownership Market, by Ownership Use, 2017-2022 (US$ Mn)

TABLE 546 UAE Vacation Ownership Market, by Ownership Use, 2023-2030 (US$ Mn)

TABLE 547 UAE Vacation Ownership Market, by Ownership Resale Market, 2017-2022 (US$ Mn)

TABLE 548 UAE Vacation Ownership Market, by Ownership Resale Market, 2023-2030 (US$ Mn)

TABLE 549 Saudi Arabia Vacation Ownership Market, by Ownership Type, 2017-2022 (US$ Mn)

TABLE 550 Saudi Arabia Vacation Ownership Market, by Ownership Type, 2023-2030 (US$ Mn)

TABLE 551 Saudi Arabia Vacation Ownership Market, by Resort Type, 2017-2022 (US$ Mn)

TABLE 552 Saudi Arabia Vacation Ownership Market, by Resort Type, 2023-2030 (US$ Mn)

TABLE 553 Saudi Arabia Vacation Ownership Market, by Ownership Duration, 2017-2022 (US$ Mn)

TABLE 554 Saudi Arabia Vacation Ownership Market, by Ownership Duration, 2023-2030 (US$ Mn)

TABLE 555 Saudi Arabia Vacation Ownership Market, by Location and Geography, 2017-2022 (US$ Mn)

TABLE 556 Saudi Arabia Vacation Ownership Market, by Location and Geography, 2023-2030 (US$ Mn)

TABLE 557 Saudi Arabia Vacation Ownership Market, by Developer and Brand, 2017-2022 (US$ Mn)

TABLE 558 Saudi Arabia Vacation Ownership Market, by Developer and Brand, 2023-2030 (US$ Mn)

TABLE 559 Saudi Arabia Vacation Ownership Market, by Exchange Programs, 2017-2022 (US$ Mn)

TABLE 560 Saudi Arabia Vacation Ownership Market, by Exchange Programs, 2023-2030 (US$ Mn)

TABLE 561 Saudi Arabia Vacation Ownership Market, by Price Tier, 2017-2022 (US$ Mn)

TABLE 562 Saudi Arabia Vacation Ownership Market, by Price Tier, 2023-2030 (US$ Mn)

TABLE 563 Saudi Arabia Vacation Ownership Market, by Ownership Use, 2017-2022 (US$ Mn)

TABLE 564 Saudi Arabia Vacation Ownership Market, by Ownership Use, 2023-2030 (US$ Mn)

TABLE 565 Saudi Arabia Vacation Ownership Market, by Ownership Resale Market, 2017-2022 (US$ Mn)

TABLE 566 Saudi Arabia Vacation Ownership Market, by Ownership Resale Market, 2023-2030 (US$ Mn)

TABLE 567 Rest of Middle East Vacation Ownership Market, by Ownership Type, 2017-2022 (US$ Mn)

TABLE 568 Rest of Middle East Vacation Ownership Market, by Ownership Type, 2023-2030 (US$ Mn)

TABLE 569 Rest of Middle East Vacation Ownership Market, by Resort Type, 2017-2022 (US$ Mn)

TABLE 570 Rest of Middle East Vacation Ownership Market, by Resort Type, 2023-2030 (US$ Mn)

TABLE 571 Rest of Middle East Vacation Ownership Market, by Ownership Duration, 2017-2022 (US$ Mn)

TABLE 572 Rest of Middle East Vacation Ownership Market, by Ownership Duration, 2023-2030 (US$ Mn)

TABLE 573 Rest of Middle East Vacation Ownership Market, by Location and Geography, 2017-2022 (US$ Mn)

TABLE 574 Rest of Middle East Vacation Ownership Market, by Location and Geography, 2023-2030 (US$ Mn)

TABLE 575 Rest of Middle East Vacation Ownership Market, by Developer and Brand, 2017-2022 (US$ Mn)

TABLE 576 Rest of Middle East Vacation Ownership Market, by Developer and Brand, 2023-2030 (US$ Mn)

TABLE 577 Rest of Middle East Vacation Ownership Market, by Exchange Programs, 2017-2022 (US$ Mn)

TABLE 578 Rest of Middle East Vacation Ownership Market, by Exchange Programs, 2023-2030 (US$ Mn)

TABLE 579 Rest of Middle East Vacation Ownership Market, by Price Tier, 2017-2022 (US$ Mn)

TABLE 580 Rest of Middle East Vacation Ownership Market, by Price Tier, 2023-2030 (US$ Mn)

TABLE 581 Rest of Middle East Vacation Ownership Market, by Ownership Use, 2017-2022 (US$ Mn)

TABLE 582 Rest of Middle East Vacation Ownership Market, by Ownership Use, 2023-2030 (US$ Mn)

TABLE 583 Rest of Middle East Vacation Ownership Market, by Ownership Resale Market, 2017-2022 (US$ Mn)

TABLE 584 Rest of Middle East Vacation Ownership Market, by Ownership Resale Market, 2023-2030 (US$ Mn)

TABLE 585 Africa Vacation Ownership Market, by Ownership Type, 2017-2022 (US$ Mn)

TABLE 586 Africa Vacation Ownership Market, by Ownership Type, 2023-2030 (US$ Mn)

TABLE 587 Africa Vacation Ownership Market, by Resort Type, 2017-2022 (US$ Mn)

TABLE 588 Africa Vacation Ownership Market, by Resort Type, 2023-2030 (US$ Mn)

TABLE 589 Africa Vacation Ownership Market, by Ownership Duration, 2017-2022 (US$ Mn)

TABLE 590 Africa Vacation Ownership Market, by Ownership Duration, 2023-2030 (US$ Mn)

TABLE 591 Africa Vacation Ownership Market, by Location and Geography, 2017-2022 (US$ Mn)

TABLE 592 Africa Vacation Ownership Market, by Location and Geography, 2023-2030 (US$ Mn)

TABLE 593 Africa Vacation Ownership Market, by Developer and Brand, 2017-2022 (US$ Mn)

TABLE 594 Africa Vacation Ownership Market, by Developer and Brand, 2023-2030 (US$ Mn)

TABLE 595 Africa Vacation Ownership Market, by Exchange Programs, 2017-2022 (US$ Mn)

TABLE 596 Africa Vacation Ownership Market, by Exchange Programs, 2023-2030 (US$ Mn)

TABLE 597 Africa Vacation Ownership Market, by Price Tier, 2017-2022 (US$ Mn)

TABLE 598 Africa Vacation Ownership Market, by Price Tier, 2023-2030 (US$ Mn)

TABLE 599 Africa Vacation Ownership Market, by Ownership Use, 2017-2022 (US$ Mn)

TABLE 600 Africa Vacation Ownership Market, by Ownership Use, 2023-2030 (US$ Mn)

TABLE 601 Africa Vacation Ownership Market, by Ownership Resale Market, 2017-2022 (US$ Mn)

TABLE 602 Africa Vacation Ownership Market, by Ownership Resale Market, 2023-2030 (US$ Mn)

TABLE 603 South Africa Vacation Ownership Market, by Ownership Type, 2017-2022 (US$ Mn)

TABLE 604 South Africa Vacation Ownership Market, by Ownership Type, 2023-2030 (US$ Mn)

TABLE 605 South Africa Vacation Ownership Market, by Resort Type, 2017-2022 (US$ Mn)

TABLE 606 South Africa Vacation Ownership Market, by Resort Type, 2023-2030 (US$ Mn)

TABLE 607 South Africa Vacation Ownership Market, by Ownership Duration, 2017-2022 (US$ Mn)

TABLE 608 South Africa Vacation Ownership Market, by Ownership Duration, 2023-2030 (US$ Mn)

TABLE 609 South Africa Vacation Ownership Market, by Location and Geography, 2017-2022 (US$ Mn)

TABLE 610 South Africa Vacation Ownership Market, by Location and Geography, 2023-2030 (US$ Mn)

TABLE 611 South Africa Vacation Ownership Market, by Developer and Brand, 2017-2022 (US$ Mn)

TABLE 612 South Africa Vacation Ownership Market, by Developer and Brand, 2023-2030 (US$ Mn)

TABLE 613 South Africa Vacation Ownership Market, by Exchange Programs, 2017-2022 (US$ Mn)

TABLE 614 South Africa Vacation Ownership Market, by Exchange Programs, 2023-2030 (US$ Mn)

TABLE 615 South Africa Vacation Ownership Market, by Price Tier, 2017-2022 (US$ Mn)

TABLE 616 South Africa Vacation Ownership Market, by Price Tier, 2023-2030 (US$ Mn)

TABLE 617 South Africa Vacation Ownership Market, by Ownership Use, 2017-2022 (US$ Mn)

TABLE 618 South Africa Vacation Ownership Market, by Ownership Use, 2023-2030 (US$ Mn)

TABLE 619 South Africa Vacation Ownership Market, by Ownership Resale Market, 2017-2022 (US$ Mn)

TABLE 620 South Africa Vacation Ownership Market, by Ownership Resale Market, 2023-2030 (US$ Mn)

TABLE 621 Egypt Vacation Ownership Market, by Ownership Type, 2017-2022 (US$ Mn)

TABLE 622 Egypt Vacation Ownership Market, by Ownership Type, 2023-2030 (US$ Mn)

TABLE 623 Egypt Vacation Ownership Market, by Resort Type, 2017-2022 (US$ Mn)

TABLE 624 Egypt Vacation Ownership Market, by Resort Type, 2023-2030 (US$ Mn)

TABLE 625 Egypt Vacation Ownership Market, by Ownership Duration, 2017-2022 (US$ Mn)

TABLE 626 Egypt Vacation Ownership Market, by Ownership Duration, 2023-2030 (US$ Mn)

TABLE 627 Egypt Vacation Ownership Market, by Location and Geography, 2017-2022 (US$ Mn)

TABLE 628 Egypt Vacation Ownership Market, by Location and Geography, 2023-2030 (US$ Mn)

TABLE 629 Egypt Vacation Ownership Market, by Developer and Brand, 2017-2022 (US$ Mn)

TABLE 630 Egypt Vacation Ownership Market, by Developer and Brand, 2023-2030 (US$ Mn)

TABLE 631 Egypt Vacation Ownership Market, by Exchange Programs, 2017-2022 (US$ Mn)

TABLE 632 Egypt Vacation Ownership Market, by Exchange Programs, 2023-2030 (US$ Mn)

TABLE 633 Egypt Vacation Ownership Market, by Price Tier, 2017-2022 (US$ Mn)

TABLE 634 Egypt Vacation Ownership Market, by Price Tier, 2023-2030 (US$ Mn)

TABLE 635 Egypt Vacation Ownership Market, by Ownership Use, 2017-2022 (US$ Mn)

TABLE 636 Egypt Vacation Ownership Market, by Ownership Use, 2023-2030 (US$ Mn)

TABLE 637 Egypt Vacation Ownership Market, by Ownership Resale Market, 2017-2022 (US$ Mn)

TABLE 638 Egypt Vacation Ownership Market, by Ownership Resale Market, 2023-2030 (US$ Mn)

TABLE 639 Rest of Africa Vacation Ownership Market, by Ownership Type, 2017-2022 (US$ Mn)

TABLE 640 Rest of Africa Vacation Ownership Market, by Ownership Type, 2023-2030 (US$ Mn)

TABLE 641 Rest of Africa Vacation Ownership Market, by Resort Type, 2017-2022 (US$ Mn)

TABLE 642 Rest of Africa Vacation Ownership Market, by Resort Type, 2023-2030 (US$ Mn)

TABLE 643 Rest of Africa Vacation Ownership Market, by Ownership Duration, 2017-2022 (US$ Mn)

TABLE 644 Rest of Africa Vacation Ownership Market, by Ownership Duration, 2023-2030 (US$ Mn)

TABLE 645 Rest of Africa Vacation Ownership Market, by Location and Geography, 2017-2022 (US$ Mn)

TABLE 646 Rest of Africa Vacation Ownership Market, by Location and Geography, 2023-2030 (US$ Mn)

TABLE 647 Rest of Africa Vacation Ownership Market, by Developer and Brand, 2017-2022 (US$ Mn)

TABLE 648 Rest of Africa Vacation Ownership Market, by Developer and Brand, 2023-2030 (US$ Mn)

TABLE 649 Rest of Africa Vacation Ownership Market, by Exchange Programs, 2017-2022 (US$ Mn)

TABLE 650 Rest of Africa Vacation Ownership Market, by Exchange Programs, 2023-2030 (US$ Mn)

TABLE 651 Rest of Africa Vacation Ownership Market, by Price Tier, 2017-2022 (US$ Mn)

TABLE 652 Rest of Africa Vacation Ownership Market, by Price Tier, 2023-2030 (US$ Mn)

TABLE 653 Rest of Africa Vacation Ownership Market, by Ownership Use, 2017-2022 (US$ Mn)

TABLE 654 Rest of Africa Vacation Ownership Market, by Ownership Use, 2023-2030 (US$ Mn)

TABLE 655 Rest of Africa Vacation Ownership Market, by Ownership Resale Market, 2017-2022 (US$ Mn)

TABLE 656 Rest of Africa Vacation Ownership Market, by Ownership Resale Market, 2023-2030 (US$ Mn)

Frequently asked questions

How big is the global market for vacation ownership right now?

In 2022, the market for vacation ownership was estimated to be worth USD 19158.5 million.

What is the vacation ownership market’s anticipated growth rate from 2023 to 2030?

The market for vacation ownership is anticipated to increase at a CAGR of 6.80% from 2023 to 2030, reaching USD 32428.84 million in 2030.

In terms of the ownership type, which market category is in the lead?

Fixed week ownership is the most popular category of ownership type.

Which segment is leading the market in terms of resort type?

Beach resorts, by the resort type, are the notable segment.

Which ownership duration segment is estimated to have the highest CAGR throughout the forecast period?

During the projection period, the fractional ownership category is anticipated to exhibit the highest CAGR.

In which region is the market for vacation ownership expanding?

The vacation ownership market was ruled by North America.

Who are the key participants in the market for vacation ownership globally?

The top players include Diamond Resorts, Hyatt, Wyndham, Marriott Vacations Worldwide, Disney Vacation Club., Hilton Grand Vacations, Interval International, Accor Vacation Club, Four Seasons Residence Clubs, Bluegreen Vacations and others.

What are the main market factors driving the vacation ownership sector?

The sector for vacation ownership is expanding due to factors like the rising demand for practical tourism, technology and online booking, increased flexibility, and rising disposable profits.

What main market challenges prevent the vacation ownership sector from growing?

Poor customer impression, downturns in the economy, competition from substitute lodging, and regulatory hurdles are just a few of the challenges that the vacation ownership industry is currently facing.

What are the main market opportunities for the vacation ownership sector?

The vacation ownership industry has enormous potential for development as a result of the growing freelancer movement, the growing acceptance of environmentally friendly tourism, and the rise of the market for premium vacation ownership.

Night Cream Market

Published:
Report ID: 37619

Pod Vapes arket

Published:
Report ID: 37623

Microfinance Market

Published:
Report ID: 37630

Makeup Remover Market

Published:
Report ID: 37626

Indoor Farming Market

Published:
Report ID: 37634

Eco-friendly Furniture Market

Published:
Report ID: 37489

Electric Guitars Market

Published:
Report ID: 37121

United Kingdom Toothpaste Tablet Market

Published:
Report ID: 36979

Electronic Cigarettes Market

Published:
Report ID: 36948

Soy Protein Ingredients Market

Published:
Report ID: 9445

Wine Corks Market

Published:
Report ID: 36862

Bag in Box Market

Published:
Report ID: 2124

Purchase Options

$2999
Delivery Format: Excel.
$4999
Designed for the individual purchaser.
$6999
Users located at a single corporate site or regional office.
$7999
Allowed for unlimited sharing globally within one company.
Smallform of Sample request

Have a question?

User Profile

Don’t settle for less – trust Mitul to help you find the best solution.

Report delivery within 24 to 48 hours

– Other Info –

What people say?-

User Review

I am very impressed with the information in this report. The author clearly did their research when they came up with this product and it has already given me a lot of ideas.

Jana Schmidt
CEDAR CX Technologies

– Connect with us –

Phone

+91 6232 49 3207


support

24/7 Research Support


sales@credenceresearch.com

– Research Methodology –

Going beyond the basics: advanced techniques in research methodology

– Trusted By –

Pepshi, LG, Nestle
Motorola, Honeywell, Johnson and johnson
LG Chem, SIEMENS, Pfizer
Unilever, Samsonite, QIAGEN