
Market Overview
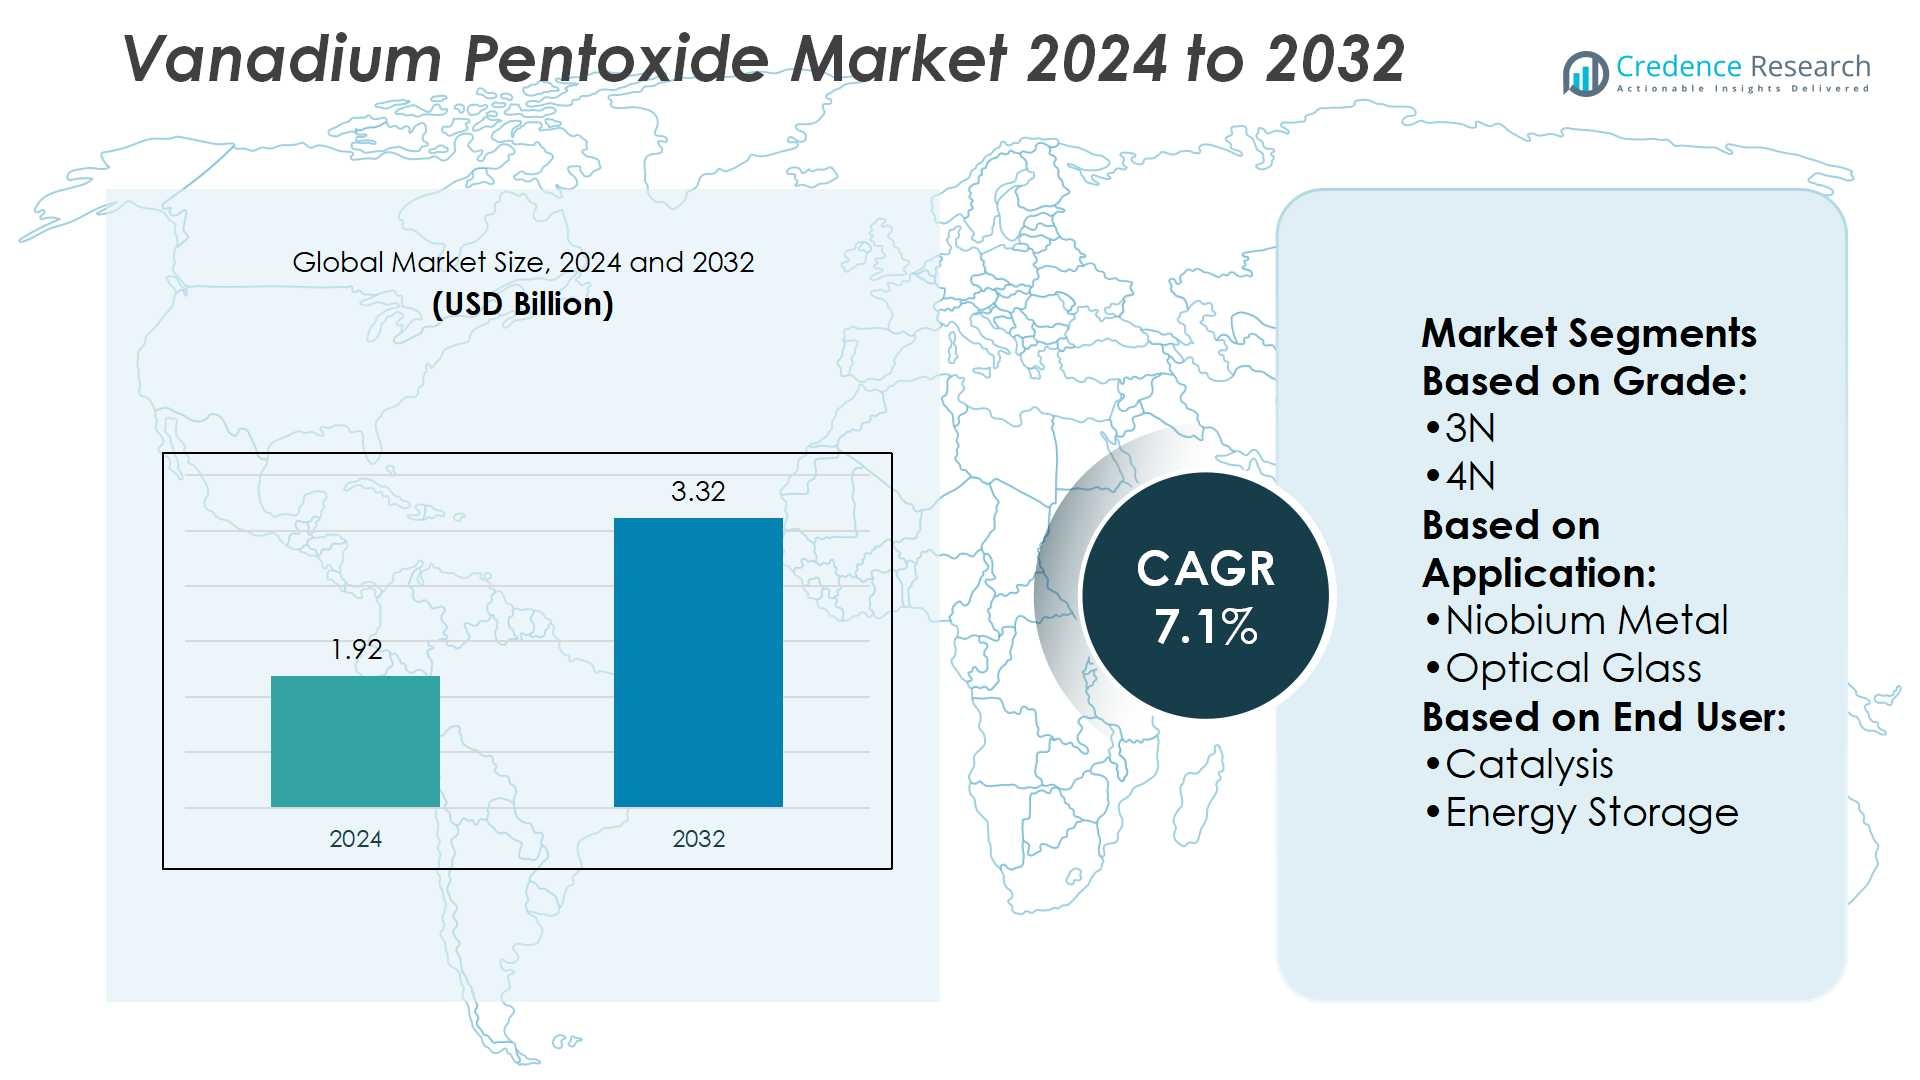
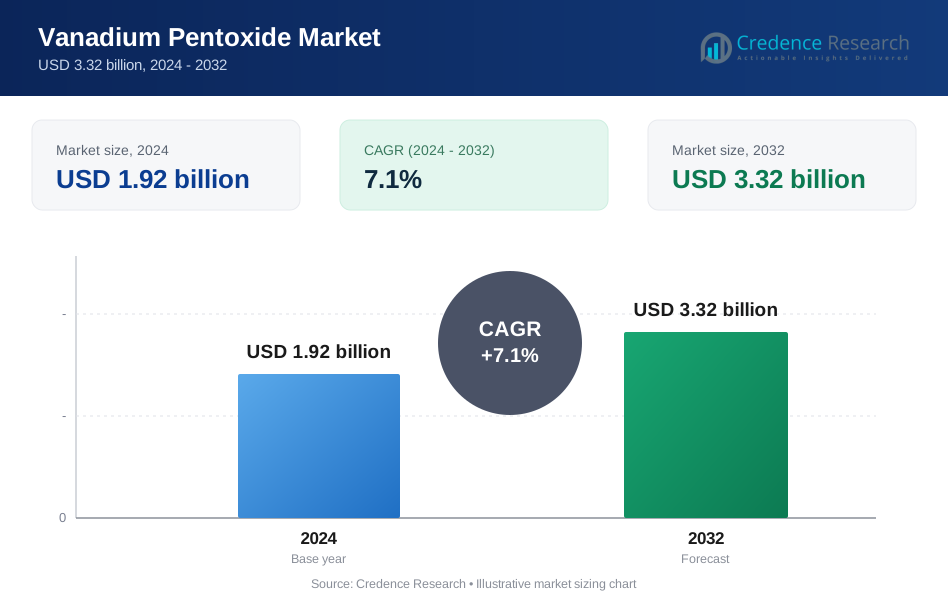
Vanadium Pentoxide Market size was valued USD 1.92 billion in 2024 and is anticipated to reach USD 3.32 billion by 2032, at a CAGR of 7.1% during the forecast period.
| REPORT ATTRIBUTE | DETAILS |
|---|---|
| Historical Period | 2020-2023 |
| Base Year | 2024 |
| Forecast Period | 2025-2032 |
| Vanadium Pentoxide Market Size 2024 | USD 1.92 Billion |
| Vanadium Pentoxide Market, CAGR | 7.1% |
| Vanadium Pentoxide Market Size 2032 | USD 3.32 Billion |
The vanadium pentoxide market is shaped by the presence of prominent players such as AMG, CBMM, Merck, F&X Electromaterials Limited, Hebei Suoyi Chemicals Co. Ltd, King Tan Tantalum Industries Ltd, MPIL, Taki Chemical Co., Ltd, XIMEI Resources Holding Limited, and Kurt J. Lesker Ltd. These companies focus on refining technologies, high-purity product development, and expanding applications in batteries, alloys, and catalysts. Strategic partnerships and supply agreements strengthen their global reach and resource security. Asia-Pacific leads the market with a 38% share, supported by rapid industrialization, large-scale steel production, and growing adoption of vanadium redox flow batteries across China, Japan, and South Korea.
Market Insights
- The Vanadium Pentoxide Market was valued at USD 1.92 billion in 2024 and is projected to reach USD 3.32 billion by 2032, registering a CAGR of 7.1% during the forecast period.
- Rising demand for vanadium redox flow batteries and increasing use of high-strength alloys in construction and aerospace act as major drivers supporting market growth.
- A key trend includes technological advancements in refining processes, enabling production of high-purity grades suitable for advanced energy storage and catalytic applications.
- Market growth faces restraints from raw material price volatility and competition from alternative materials like lithium-ion in the energy storage sector.
- Asia-Pacific dominates with a 38% market share, followed by North America at 24% and Europe at 21%, while the alloy manufacturing segment continues to hold the largest share, driven by steel and aerospace industries.
Market Segmentation Analysis:
By Grade
In the vanadium pentoxide market, the 3N grade dominates with the largest market share. This grade is preferred due to its high purity and broad industrial applications in alloys, glass, and catalysts. Its consistent quality makes it the standard choice for industries requiring stable chemical performance. Demand is supported by rising usage in steel reinforcement and specialty glass products. The 4N grade holds a smaller share, catering to high-end electronics and optical glass. Other grades remain niche, driven by cost-sensitive markets and less demanding industrial processes.
- For instance, the company produces vanadium pentoxide with a vanadium content of 99.7% and particle sizes controlled between 10–50 microns, enabling consistent alloy integration in high-strength steel.
By Application
Alloy manufacturing represents the leading application segment, capturing the largest share of the vanadium pentoxide market. Its dominance is fueled by the material’s critical role in producing high-strength steel and specialty alloys, especially in automotive and construction. The alloy segment benefits from ongoing infrastructure projects and increasing demand for lightweight yet durable components. Optical glass and capacitors are growing steadily, supported by electronics innovation. Niobium metal and metal extraction rely on vanadium pentoxide for refining, though they contribute smaller shares. Other applications add incremental demand through diversified industrial use.
- For instance, High-purity vanadium pentoxide, such as the 99.6% grade mentioned, is a standard commercial material used as an alloying element in steel production.
By End-User
Catalysis stands as the dominant end-user segment, accounting for the highest share in the vanadium pentoxide market. Its leadership is driven by vanadium’s efficiency in sulfuric acid production and chemical processing, which remain cornerstone applications worldwide. Energy storage is emerging as a fast-growing end-user segment, supported by vanadium redox flow batteries for renewable energy integration. Ceramics and glass continue to show steady demand, leveraging vanadium pentoxide’s optical and coloring properties. Together, these end-user groups highlight the material’s dual role in traditional chemical industries and new-age energy technologies.
Key Growth Drivers
Rising Demand in Energy Storage Applications
Vanadium pentoxide plays a central role in vanadium redox flow batteries, which are gaining adoption for large-scale renewable energy storage. Growing investments in solar and wind energy projects have accelerated demand for advanced storage technologies, where vanadium pentoxide ensures stability and high cycle life. Governments worldwide are supporting grid modernization, further boosting the use of VRFBs. The material’s efficiency in enabling long-duration storage positions it as a key component for meeting future renewable integration targets, creating strong growth potential for the market.
- For instance, VERBs enable long-duration energy storage, often 4 to 24 hours, which is critical for integrating intermittent renewable power sources like solar and wind. The use of high-purity is crucial for VRFB electrolyte to ensure consistent redox efficiency and prevent contamination that could degrade performance.
Expanding Use in Alloy Manufacturing
The steel and aerospace industries rely heavily on vanadium pentoxide for alloy production due to its ability to enhance strength and corrosion resistance. Demand is increasing as construction, automotive, and aviation sectors prioritize materials with superior durability and performance. Rising infrastructure projects, particularly in emerging economies, have boosted the consumption of vanadium-based alloys. In aerospace, high-performance alloys improve safety and reduce weight, making vanadium pentoxide critical in advanced manufacturing. This industrial reliance continues to be a major driver of market growth.
- For instance, certain specialty chemical producers supply high-purity, 3N grade vanadium pentoxide with controlled particle sizes and specific impurity levels, such as iron below 70 ppm.
Growing Adoption in Catalysts and Chemicals
Vanadium pentoxide is widely used as a catalyst in producing sulfuric acid, one of the most essential industrial chemicals. Increasing demand from chemical processing, fertilizers, and petroleum refining strengthens the need for this compound. Its catalytic properties improve process efficiency, lowering energy costs and emissions in large-scale production facilities. The growth of the global chemical industry, particularly in Asia-Pacific, further supports this trend. Companies are investing in advanced catalysts to align with sustainability goals, making vanadium pentoxide’s role in industrial catalysis more significant.
Key Trends & Opportunities
Emergence of Green Energy Applications
The transition toward clean energy presents opportunities for vanadium pentoxide in eco-friendly technologies. Its use in vanadium flow batteries positions the material as a solution to renewable intermittency issues. As nations commit to net-zero targets, funding for advanced storage solutions is expanding. This trend aligns with the growing focus on decarbonization, enabling the market to benefit from long-term structural changes in the energy sector.
- For instance, high-purity vanadium pentoxide with controlled particle sizes and specific impurity levels (such as iron below 50 ppm), is used to prepare electrolytes for vanadium redox flow batteries (VRFBs).
Technological Advancements in Material Processing
Innovations in extraction and purification techniques are improving vanadium pentoxide’s quality and performance across applications. New technologies allow manufacturers to reduce impurities, enhance energy efficiency, and increase production yield. These advancements strengthen its competitiveness against substitutes in batteries, alloys, and catalysis. Companies focusing on R&D are better positioned to capitalize on specialized, high-grade vanadium pentoxide for next-generation industrial and energy applications.
- For instance, certain specialty chemical producers supply high-purity, 3N grade vanadium pentoxide with controlled particle sizes (e.g., 10–45 microns) and specific impurity levels (such as iron below 65 ppm).
Opportunities in Emerging Markets
Rapid industrialization in Asia-Pacific, Latin America, and Africa is creating fresh demand for vanadium pentoxide in alloys, chemicals, and energy storage. Infrastructure expansion, rising steel consumption, and government support for renewable energy are key enablers. Local production initiatives and international collaborations provide opportunities for companies to establish a presence in high-growth economies, diversifying revenue streams and strengthening global supply chains.
Key Challenges
Volatility in Raw Material Supply
The market faces significant challenges due to fluctuations in vanadium ore availability and prices. Concentrated production in a few regions creates supply risks and vulnerability to geopolitical disruptions. Price instability makes long-term planning difficult for manufacturers and end users, affecting investment decisions in downstream applications like batteries and alloys. Managing raw material security remains a critical challenge for market participants.
Competition from Alternative Materials
Alternative energy storage technologies, such as lithium-ion batteries, pose strong competition for vanadium pentoxide in the energy sector. While VRFBs offer long-cycle advantages, lithium-ion dominates in terms of cost efficiency and scalability. In alloys, other additives can sometimes substitute vanadium, reducing dependency. This competitive pressure requires continuous innovation and cost optimization by manufacturers to secure market share and maintain growth momentum.
Regional Analysis
North America
North America holds a 24% share of the vanadium pentoxide market, driven by strong demand in energy storage and alloy manufacturing. The region benefits from rapid adoption of vanadium redox flow batteries for renewable integration and grid stability. Aerospace and defense industries also contribute significantly, as vanadium alloys improve strength-to-weight ratios. Supportive government policies promoting renewable energy and advanced materials further enhance growth. The United States remains the key contributor, with expanding investments in infrastructure and clean energy projects reinforcing regional demand for vanadium pentoxide across multiple industrial and technological applications.
Europe
Europe accounts for 21% of the vanadium pentoxide market, supported by strict environmental regulations and emphasis on sustainable energy. The European Union’s decarbonization initiatives drive demand for vanadium redox flow batteries, creating opportunities for energy storage providers. Additionally, the robust automotive and aerospace sectors consume significant quantities of vanadium alloys for lightweight and durable applications. Countries such as Germany, France, and the United Kingdom lead in consumption due to strong industrial bases. The region’s focus on advanced catalysts for emission reduction and chemical processing further supports steady growth in vanadium pentoxide demand.
Asia-Pacific
Asia-Pacific dominates the vanadium pentoxide market with a 38% share, supported by rapid industrialization and infrastructure expansion. China is the largest consumer, driven by extensive steel production and investment in renewable energy storage technologies. Japan and South Korea also contribute significantly with applications in electronics, automotive, and aerospace. The region’s fast-growing chemical industry further boosts demand for catalysts using vanadium pentoxide. Government-backed initiatives promoting clean energy adoption and large-scale construction projects reinforce its dominance. Asia-Pacific remains the most dynamic market, offering substantial growth opportunities for both local producers and global manufacturers of vanadium pentoxide.
Latin America
Latin America captures a 9% share of the vanadium pentoxide market, driven by rising demand in mining, construction, and steel production. Brazil leads regional consumption, supported by expanding infrastructure projects and industrial development. The adoption of vanadium redox flow batteries is gradually increasing, encouraged by renewable energy projects in countries like Chile. Regional opportunities are supported by untapped natural resources, providing potential for localized production. However, limited technological development compared to other regions constrains growth. Strategic collaborations and foreign investments are expected to strengthen Latin America’s position in the global vanadium pentoxide market.
Middle East & Africa
The Middle East & Africa hold an 8% share of the vanadium pentoxide market, with growth supported by rising industrialization and construction activity. South Africa is a key player, given its significant vanadium reserves and established mining sector. Regional demand is also influenced by large-scale infrastructure investments and a growing interest in renewable energy storage solutions. While adoption of advanced applications such as vanadium redox flow batteries is still in early stages, increasing investments from international companies offer long-term opportunities. The region’s resource advantage positions it as a critical supplier within global supply chains.
Market Segmentations:
By Grade:
- 3N
- 4N
By Application:
- Niobium Metal
- Optical Glass
By End User:
- Catalysis
- Energy Storage
By Geography
- North America
- U.S.
- Canada
- Mexico
- Europe
- Germany
- France
- U.K.
- Italy
- Spain
- Rest of Europe
- Asia Pacific
- China
- Japan
- India
- South Korea
- South-east Asia
- Rest of Asia Pacific
- Latin America
- Brazil
- Argentina
- Rest of Latin America
- Middle East & Africa
- GCC Countries
- South Africa
- Rest of the Middle East and Africa
Competitive Landscape
The vanadium pentoxide market companies such as AMG, CBMM, Merck, F&X Electromaterials Limited, Hebei Suoyi Chemicals Co. Ltd, King Tan Tantalum Industries Ltd, MPIL, Taki Chemical Co., Ltd, XIMEI Resources Holding Limited, and Kurt J. Lesker Ltd. The vanadium pentoxide market is characterized by moderate consolidation, where competition revolves around innovation, supply security, and technological efficiency. Companies are increasingly investing in refining techniques to produce higher-purity grades suitable for advanced applications in batteries, alloys, and catalysts. Strategic collaborations and long-term supply agreements have become essential for maintaining market stability, particularly in energy storage and industrial manufacturing. Regional competition is influenced by cost advantages in Asia-Pacific, while firms in North America and Europe focus on research-driven advancements to improve performance and sustainability. Rising demand from renewable energy storage applications continues to intensify competition, pushing producers to prioritize innovation, cost optimization, and environmental compliance to strengthen their position in the global market.
Key Player Analysis
- XIMEI Resources Holding Limited
- King Tan Tantalum Industries Ltd
- AMG
- Taki Chemical Co., Ltd
- Hebei Suoyi Chemicals Co. Ltd
- Kurt J. Lesker Ltd
- MPIL
- Merck
- CBMM
- F&X Electromaterials Limited
Recent Developments
- In August 2025, Premier African Minerals raised to complete Zulu commissioning. The company will use the proceeds for working capital and to finalize changes to the material flow through the flotation plant of the Zulu lithium and tantalum project, in Zimbabwe, which is in the process of being commissioned.
- In January 2025, Japanese company LE System significantly increased its global presence by exporting substantial quantities of vanadium flow battery materials, aiming to support energy storage projects worldwide.
- In November 2023, KEMIWATT and MANN+HUMMEL was launched to create a new range of Redox Flow Batteries. The long-duration stationary energy storage business and KEMIWATT see great benefit from their collaboration at a time when global use of renewable energy sources is accelerating.
Report Coverage
The research report offers an in-depth analysis based on Grade, Application, End-User and Geography. It details leading market players, providing an overview of their business, product offerings, investments, revenue streams, and key applications. Additionally, the report includes insights into the competitive environment, SWOT analysis, current market trends, as well as the primary drivers and constraints. Furthermore, it discusses various factors that have driven market expansion in recent years. The report also explores market dynamics, regulatory scenarios, and technological advancements that are shaping the industry. It assesses the impact of external factors and global economic changes on market growth. Lastly, it provides strategic recommendations for new entrants and established companies to navigate the complexities of the market.
Future Outlook
- The market will expand steadily with growing adoption of vanadium redox flow batteries.
- Rising renewable energy projects will continue to drive long-term demand for energy storage applications.
- Alloy manufacturing will remain a major consumer as construction and aerospace sectors grow.
- Technological advancements in refining will enhance the availability of high-purity vanadium pentoxide.
- Asia-Pacific will strengthen its dominance due to large-scale industrial and infrastructure development.
- Europe and North America will focus on sustainable energy storage and advanced alloy applications.
- Emerging economies in Latin America and Africa will provide new opportunities for market penetration.
- Supply chain integration and raw material security will remain critical priorities for producers.
- Competition from alternative storage technologies will push manufacturers to optimize efficiency and cost.
- Increased focus on environmental compliance will shape production practices and investment strategies.
Request a Free Sample
Fill in your details and we'll send you a free sample report.
- Sample data tables & charts
- Research methodology
Need a Custom Version of This Report?
Tailor the scope, geography, or segments to your exact requirements.
- Custom geography or segment scope
- Direct access to our analyst team
Frequently Asked Questions
What is the current market size for Vanadium Pentoxide Market, and what is its projected size in 2032?
At what Compound Annual Growth Rate is the Vanadium Pentoxide Market projected to grow between 2025 and 2032?
Which Vanadium Pentoxide Market segment held the largest share in 2024?
What are the primary factors fueling the growth of the Vanadium Pentoxide Market?
Who are the leading companies in the Vanadium Pentoxide Market?
Which region commanded the largest share of the Vanadium Pentoxide Market in 2024?
Table of Content
Chapter 1. Report Introduction
- 1.1 Report Description & Purpose
- 1.1.1 Report Title & Market Definition
- 1.1.2 Unique Selling Propositions (USP) & Key Differentiators
- 1.1.3 Value Proposition for Stakeholders
- 1.2 Research Objectives
- 1.2.1 Market Sizing Objectives (Volume & Revenue)
- 1.2.2 Segmentation Objectives
- 1.2.3 Competitive Intelligence Objectives
- 1.2.4 Forecast & Scenario Objectives
- 1.3 Report Scope
- 1.3.1 Vanadium Pentoxide Scope – Types & Subtypes Covered
- 1.3.2 Geographic Scope – Regions & Countries Covered
- 1.3.3 Historical Period, Base Year & Forecast Period (2024; forecast to 2032)
- 1.3.4 Inclusions & Exclusions
- 1.4 HS Code & Classification Framework
- 1.5 Currency, Units & Pricing Basis
- 1.6 Target Stakeholders
- 1.7 Limitations & Assumptions
Chapter 2. Executive Summary
- 2.1 Global Vanadium Pentoxide Market Snapshot
- 2.1.1 Market Size – Historical (2024) & Forecast (2024-2032) (2024: USD 1.92 billion → 2032: USD 3.32 billion)
- 2.1.2 Volume & Revenue – Global Totals
- 2.1.3 Key Market Highlights – Top Five Facts
- 2.2 Vanadium Pentoxide Market Segmentation Snapshot
- 2.2.1 Market Split by Region – 2024 vs. 2032
- 2.3 Competitive Snapshot
- 2.3.1 Top 10 Players by Revenue Share – 2024
- 2.3.2 Top 10 Players by Volume Share – 2024
- 2.3.3 Recent Strategic Developments (18-Month Summary)
- 2.4 Key Investment Highlights & Strategic Conclusions
Chapter 3. Vanadium Pentoxide Market Dynamics & Industry Analysis
- 3.1 Market Overview & Context
- 3.1.1 Vanadium Pentoxide Market Position in the Broader Automotive Value Chain
- 3.1.2 OEM vs. Replacement Market Dynamics
- 3.1.3 Market Maturity & Development Stage by Region
- 3.2 Vanadium Pentoxide Market Drivers
- 3.3 Vanadium Pentoxide Market Restraints & Challenges
- 3.4 Vanadium Pentoxide Market Opportunities
- 3.5 Porter's Five Forces Analysis
- 3.5.1 Threat of New Entrants
- 3.5.2 Bargaining Power of Suppliers
- 3.5.3 Bargaining Power of Buyers
- 3.5.4 Threat of Substitutes
- 3.5.5 Competitive Rivalry – Intensity Assessment
- 3.6 Vanadium Pentoxide Value Chain Analysis
- 3.6.1 Upstream – Raw Material/Input Suppliers
- 3.6.1.1 Raw Material/Input 1
- 3.6.1.2 Raw Material/Input 2
- 3.6.1.3 Raw Material/Input 3
- 3.6.2 Midstream – Production/Manufacturing/Service Delivery
- 3.6.2.1 Production/Process Overview
- 3.6.2.2 Key Facility Locations & Capacity by Manufacturer
- 3.6.3 Downstream – Distribution & End Consumer
- 3.6.3.1 Primary Channel – B2B/OEM
- 3.6.3.2 Secondary Channels – Dealer, Retail, Online, Direct
- 3.6.4 Value Chain Profitability Analysis
- 3.6.1 Upstream – Raw Material/Input Suppliers
- 3.7 PESTEL Analysis
- 3.7.1 Political Factors
- 3.7.2 Economic Factors
- 3.7.3 Social Factors
- 3.7.4 Technological Factors
- 3.7.5 Environmental Factors
- 3.7.6 Legal Factors
- 3.8 Vanadium Pentoxide Supply Chain Analysis
- 3.8.1 Raw Material/Input Supply Risk Assessment
- 3.8.2 Manufacturing Concentration Risk (Geographic Exposure)
- 3.8.3 Trade Disruption Impact Analysis
- 3.9 Regulatory & Policy Landscape
Note: The regulatory and policy landscape section covers regulations based on their applicability to the market, Vanadium Pentoxide category, geography, and scope of the study. Only regulatory frameworks with a material impact on operations, compliance, trade, sustainability, or market access are analyzed in detail.
Chapter 4. Key Investment Pockets & Opportunity Analysis
- 4.1 Vanadium Pentoxide Market Attractiveness Analysis
- 4.1.1 By Region – Investment Attractiveness Matrix (Volume × CAGR)
- 4.2 Absolute Revenue Growth Opportunity
- 4.2.1 By Region – Absolute USD Growth Through 2032
- 4.3 Incremental Volume Opportunity
- 4.3.1 By Region – Incremental Volume Through 2032
- 4.3.2 Segment – Incremental Volume
- 4.4 Emerging Submarket Opportunity Deep Dive (Subject to Applicability)
- 4.5 Emerging Market Opportunity Scorecards
- 4.5.1 United States
- 4.5.2 Europe
- 4.5.3 Asia
- 4.5.4 Middle East & Africa
Note: Emerging Market Opportunity Scorecards will be included based on relevance and strategic importance. Regions listed are indicative and may vary depending on data availability and market dynamics.
Chapter 5. Vanadium Pentoxide Import-Export Analysis & Trade Flows
- 5.1 Global Trade Overview
- 5.1.1 Global Export Value by Country (2024)
- 5.1.2 Global Export Volume by Country (2024)
- 5.1.3 Global Import Value by Country (2024)
- 5.1.4 Global Import Volume by Country (2024)
- 5.1.5 Net Trade Balance by Country (2024)
- 5.2 Export Analysis – Segment
- 5.2.1 Type 1 (HS Code)
- 5.2.2 Type 2 (HS Code)
- 5.2.3 Type 3 (HS Code)
- 5.2.4 Type 4 (HS Code)
- 5.2.5 Type 5 (HS Code)
- 5.3 Import Analysis – Segment
- 5.3.1 Type 1 (HS Code)
- 5.3.2 Type 2 (HS Code)
- 5.3.3 Type 3 (HS Code)
- 5.3.4 Type 4 (HS Code)
- 5.3.5 Type 5 (HS Code)
- 5.4 Average Unit Trade Prices
- 5.4.1 Average Export Price – Segment & Country
- 5.4.2 Average Import Price – Segment & Source Country
- 5.4.3 Price Trends (2024)
- 5.5 Key Trade Route Analysis
- 5.5.1 Trade Route 1
- 5.5.2 Trade Route 2
- 5.5.3 Trade Route 3
- 5.5.4 Trade Route 4
- 5.5.5 Trade Route 5
- 5.6 Trade Policy Impact Assessment
- 5.6.1 US Anti-Dumping & Section 301 Tariffs
- 5.6.2 EU Customs Union Impact
- 5.6.3 Major Free Trade Agreements
- 5.6.4 USMCA Rules of Origin
Note: Trade policy analysis will be included only where relevant to the Vanadium Pentoxide market.
Chapter 6. Competitive Landscape & Company Benchmarking
- 6.1 Vanadium Pentoxide Market Concentration & Structure
- 6.1.1 Herfindahl-Hirschman Index (HHI) – vs. 2024
- 6.1.2 Tier 1, Tier 2 & Tier 3 Market Structure
- 6.1.3 Global, Regional & Local Player Dynamics
- 6.2 Vanadium Pentoxide Market Share Analysis – 2024
- 6.2.1 Global Revenue Share by Company
- 6.2.2 Global Volume Share by Company
- 6.2.3 Regional Revenue Share
- 6.2.4 Market Share Evolution ( vs. 2024)
- 6.2.5 OEM Segment Share by Company
- 6.2.6 Replacement Segment Share by Company
- 6.3 Production/Delivery Capacity & Facility Analysis
- 6.3.1 Global Installed Capacity
- 6.3.2 Capacity Utilization Rates
- 6.3.3 Production/Output Volume
- 6.3.4 Facility Locations & Capacity Map
- 6.3.5 Planned Capacity Additions
- 6.4 Vanadium Pentoxide Competitive Benchmarking Matrix
- 6.4.1 Revenue, Volume, CAGR & Profitability Comparison
- 6.4.2 Channel Revenue Mix
- 6.4.3 Geographic Revenue Exposure
- 6.4.4 R&D Intensity
- 6.4.5 Sustainability Maturity
- 6.5 Strategic Developments in Vanadium Pentoxide (Last 24 Months)
- 6.5.1 Mergers, Acquisitions & Divestments
- 6.5.2 New Vanadium Pentoxide Launches
- 6.5.3 Facility Expansions
- 6.5.4 Strategic Alliances, Joint Ventures & Partnerships
- 6.5.5 Distribution Expansion & Market Entry
- 6.5.6 Sustainability & ESG Initiatives
- 6.6 Competitive Strategy Mapping
- 6.6.1 Leader, Challenger, Follower & Niche Classification
- 6.6.2 Pricing Strategy Comparison
- 6.6.3 Channel Strategy Matrix
Note: Strategic developments are included based on their materiality and the availability of reliable information.
Chapter 7. Global Vanadium Pentoxide Market – By Distribution Channel
- 7.1 Segment Overview
- 7.1.1 Volume & Revenue Split by Channel (2024 & 2032)
- 7.1.2 Channel Mix Evolution (2024-2032)
Chapter 8. Regional Market Analysis – Global Overview
- 8.1 Global Regional Overview
- 8.1.1 Regional Volume Share
- 8.1.2 Regional Revenue Share
- 8.1.3 Regional Volume by Region
- 8.1.4 Regional Revenue by Region
- 8.1.5 Regional Forecast Through 2032
- 8.2 Cross-Regional Segment Analysis
- 8.2.1 By Distribution Channel
- 8.2.2 By Brand/Price Tier
Chapter 9. North America Vanadium Pentoxide Market
- 9.1 United States
- 9.2 Canada
- 9.3 Mexico
Chapter 10. Europe Vanadium Pentoxide Market
- 10.1 Germany
- 10.2 France
- 10.3 Italy
- 10.4 United Kingdom
- 10.5 Spain
- 10.6 Poland
- 10.7 Russia
- 10.8 Netherlands
- 10.9 Belgium
- 10.10 Sweden
- 10.11 Denmark
- 10.12 Norway
- 10.13 Rest of Europe
Chapter 11. Asia Pacific Vanadium Pentoxide Market
- 11.1 China
- 11.2 India
- 11.3 Japan
- 11.4 South Korea
- 11.5 Thailand
- 11.6 Indonesia
- 11.7 Vietnam
- 11.8 Malaysia
- 11.9 Australia
- 11.10 Rest of Asia Pacific
Chapter 12. Latin America Vanadium Pentoxide Market
- 12.1 Brazil
- 12.2 Argentina
- 12.3 Colombia
- 12.4 Chile
- 12.5 Rest of Latin America
Chapter 13. Middle East Vanadium Pentoxide Market
- 13.1 Saudi Arabia
- 13.2 United Arab Emirates
- 13.3 Turkey
- 13.4 Israel
- 13.5 Iran
- 13.6 Rest of the Middle East
Chapter 14. Africa Vanadium Pentoxide Market
- 14.1 South Africa
- 14.2 Egypt
- 14.3 Nigeria
- 14.4 Morocco
- 14.5 Rest of Africa
Chapter 15. Vanadium Pentoxide Company Profiles
- 15.1 [Company 01]
- 15.1.1 Company Overview
- 15.1.2 Key Management Personnel
- 15.1.3 Products & Services Portfolio
- 15.1.4 Financial Performance
- 15.1.5 Key Market Focus & Geographic Presence
- 15.1.6 Recent Developments & Strategic Initiatives
Note: The company profile list is preliminary and may change based on research findings, market developments, data availability, and client requirements.
Chapter 16. Appendices
- Appendix A – List of Abbreviations & Acronyms
- Appendix B – Industry Classification Code Reference – Full Series
- Appendix C – Production & Capacity Data Tables
- Appendix D – End-Use & Demand Base Tables
- Appendix E – Consumption & Replacement Rate Assumptions
- Appendix F – ASP Reference Tables
- Appendix G – Manufacturing & Facility Database
- Appendix H – Import-Export Data Tables
- Appendix I – Regulatory Summary Tables
- Appendix J – Primary Research Participant List (Anonymized)
- Appendix K – Primary Research Questionnaire Framework
- Appendix L – Data Sources & Bibliography
- Appendix M – Market Size Divergence & Source Comparison
Chapter 17. Research Methodology
- 17.1 Research Framework & Philosophy
- 17.2 Secondary Research – Sources, Hierarchy & Data Extraction
- 17.3 Data Modeling – Bottom-Up & Top-Down Market Sizing
- 17.4 Primary Research – Stakeholder Framework, LOI & Sample Sizes
- 17.5 Forecast Methodology – Regression, Scenario & Sensitivity Analysis
- 17.6 Quality Control – Four-Layer Validation Framework
- 17.7 Limitations & Standard Assumptions
- 17.8 Disclaimer
