
Market Overview
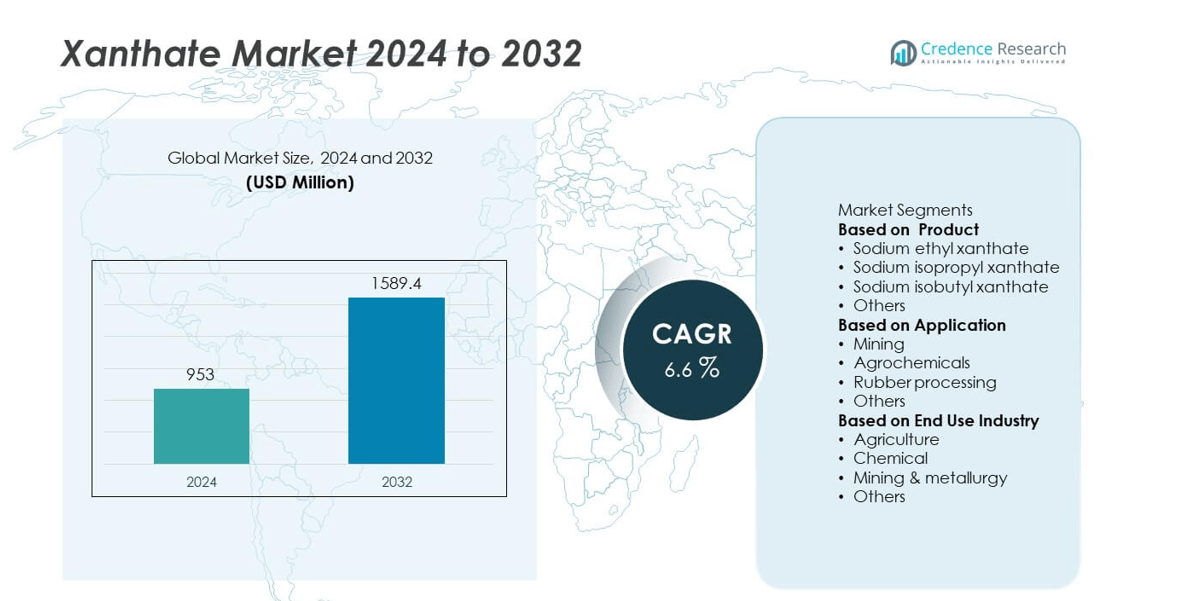
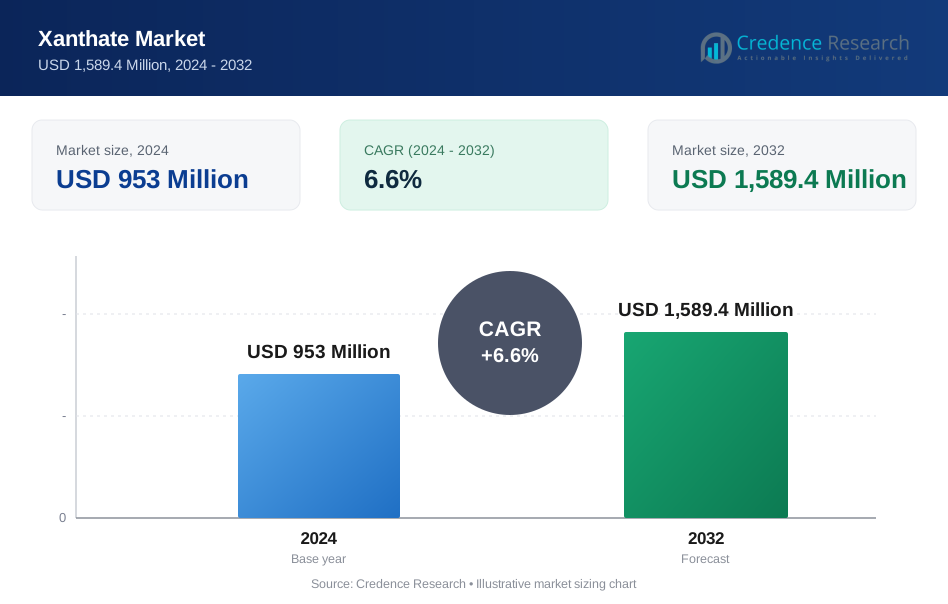
The global xanthate market was valued at USD 953 Million in 2024 and is projected to reach USD 1,589.4 Million by 2032, growing at a CAGR of 6.6% during the forecast period.
| REPORT ATTRIBUTE | DETAILS |
|---|---|
| Historical Period | 2020-2023 |
| Base Year | 2024 |
| Forecast Period | 2025-2032 |
| Xanthate Market Size 2024 | USD 953 Million |
| Xanthate Market, CAGR | 6.6% |
| Xanthate Market Size 2032 | USD 1,589.4 Million |
The xanthate market is led by major players such as Coogee Chemicals, Vizag Chemicals, Yantai Humon Group, Charles Tennant & Company, Newzeal Chem, Kavya Pharma, JAM Group, Tieling Flotation Reagent Co. Ltd, China Qingdao Hong Jin Chemical Company, and Senmin. These companies focus on supplying high-quality sodium ethyl, isopropyl, and isobutyl xanthates for mining and metallurgy applications. Asia-Pacific dominated the market with 42% share in 2024, driven by strong mining activities in China, India, and Australia. North America held 28% share, supported by demand from gold and copper mining operations, while Europe accounted for 20% share, boosted by chemical and industrial applications.
Market Insights
- The xanthate market was valued at USD 953 Million in 2024 and is projected to reach USD 1589.4 Million by 2032, growing at a CAGR of 6.6%.
- Rising demand from the mining sector for efficient flotation reagents is a key driver, as xanthates play a crucial role in improving mineral recovery rates in copper, zinc, and gold processing operations.
- Market trends focus on the development of environmentally friendly and low-toxicity xanthate formulations, along with growing automation in mineral processing plants to enhance efficiency and reduce operational costs.
- The market is competitive with key players including Coogee Chemicals, Vizag Chemicals, Yantai Humon Group, and Charles Tennant & Company expanding production capacity and forming strategic alliances with global mining companies to strengthen supply chains.
- Asia-Pacific led with 42% share in 2024, followed by North America with 28% and Europe with 20%, while sodium ethyl xanthate remained the dominant product segment with over 35% share.
Market Segmentation Analysis:
By Product
Sodium isobutyl xanthate dominated the xanthate market with over 40% share in 2024, driven by its high efficiency and selectivity in flotation processes. It is widely used in the beneficiation of sulfide ores such as copper, zinc, and lead due to its strong collecting power and cost-effectiveness. Its superior performance in both alkaline and neutral pH ranges makes it the preferred choice in large-scale mining operations. Rising demand from the mineral processing sector and continued expansion of the mining industry in Asia-Pacific are expected to sustain growth in this product segment.
- For instance, Newzeal Chem, a specialty chemicals supplier established in 2023, has the potential to supply chemicals like sodium isobutyl xanthate to mining companies across India and Southeast Asia. Their supply could complement existing supplies from established Indian manufacturers like Amruta Industries or larger international players such as Qixia Tongda Flotation Reagent.
By Application
Mining accounted for over 70% share of the xanthate market in 2024, making it the dominant application segment. Xanthates are extensively used as flotation agents to separate valuable sulfide ores from gangue materials. Increased global demand for base metals like copper, nickel, and zinc is driving xanthate consumption in mineral processing plants. Ongoing investments in new mining projects, especially in Latin America and Africa, along with efforts to enhance ore recovery efficiency, are fueling sustained growth in this segment.
- For instance, Jam Group supplied xanthate reagents, among other mineral processing chemicals, to support mining operations globally, including in Latin America and Africa. Such supplies are used to increase flotation efficiency and improve metal recovery in the mining of various ores.
By End-Use Industry
The mining and metallurgy industry held the largest share with over 65% in 2024, as xanthates play a crucial role in improving recovery rates in ore processing operations. Expanding metal production and rising consumption in sectors such as construction, automotive, and electronics are boosting demand for xanthate-based flotation chemicals. Chemical and agriculture sectors follow as secondary consumers, using xanthates in pesticide formulations and chemical synthesis. Continued focus on improving yield in mining operations ensures that this end-use industry remains the primary growth driver for the global xanthate market.
Market Overview
Rising Demand from Mining and Metallurgy
The xanthate market is primarily driven by its extensive use in mining and metallurgy, which accounted for over 65% of demand in 2024. Xanthates serve as effective flotation agents for sulfide ores, helping improve recovery rates of copper, zinc, lead, and nickel. Expanding mining operations in Asia-Pacific, Latin America, and Africa are boosting consumption, supported by rising demand for base metals in infrastructure and electronics sectors. Investments in new mining projects and ore beneficiation plants continue to propel xanthate adoption globally.
- For instance, Australian Gold Reagents (a joint venture between Coogee Chemicals and Wesfarmers CSBP) made a final investment decision in early 2025 to expand its sodium cyanide production capacity in Kwinana, with first production from the expanded plant expected in the 2026 financial year. The expansion will increase capacity to meet growing demand from the gold mining industry in Australia and Asia-Pacific.
Expansion of Global Mineral Production
Growing consumption of metals across construction, automotive, and renewable energy industries is increasing the need for efficient mineral processing chemicals like xanthates. Global copper and zinc production has been rising steadily, creating significant opportunities for xanthate suppliers. Mining companies are focusing on maximizing ore recovery and optimizing operational efficiency, which drives demand for high-performance flotation agents. Technological advancements in mineral processing plants are also supporting the adoption of xanthate-based solutions for enhanced productivity.
- For instance, Yantai Humon Chemical Auxiliary Co., a subsidiary of Yantai Humon Group, has an annual production capacity of 78,000 metric tons of synthetic and dried xanthate products, allowing it to supply advanced xanthate products to mineral processors in China and international markets.
Growth in Emerging Markets
Emerging economies are witnessing rapid industrialization and infrastructure development, leading to rising demand for raw materials. Countries like China, India, and Brazil are investing heavily in mining projects to meet domestic metal requirements. This expansion of the mining sector is fueling xanthate consumption, especially in flotation processes for low-grade ores. Additionally, government initiatives supporting mining exploration and metallurgical process improvements further encourage the adoption of xanthates, driving strong market growth in developing regions during the forecast period.
Key Trends & Opportunities
Shift Toward Environmentally Safer Formulations
Sustainability concerns are encouraging the development of xanthate formulations with lower toxicity and reduced environmental impact. Manufacturers are investing in greener production methods and safer handling processes to comply with stringent regulatory standards. Demand is growing for biodegradable and eco-friendly flotation agents that maintain high selectivity and recovery rates. This trend presents opportunities for innovation and product differentiation, allowing suppliers to strengthen market position while meeting sustainability goals in the mining industry.
- For instance, Hefei TNJ Chemical Co., Ltd. (China) has a publicly stated commitment on its website to environmental protection and compliance with regulations set by China's environmental authorities.
Technological Advancements in Ore Processing
Advancements in mineral processing technologies are boosting the adoption of xanthates by improving process efficiency and selectivity. Modern flotation systems and automation enable better control of reagent dosage and recovery performance, optimizing xanthate usage. The integration of digital monitoring tools and data analytics in mineral processing plants allows for enhanced performance tracking, creating opportunities for suppliers to offer tailored xanthate solutions. This technological progress drives consistent demand for high-quality, performance-oriented flotation chemicals.
- For instance, a major European chemical plant integrated AI-driven analytics to optimize production, resulting in a documented reduction in waste by preventing its creation in the first place.
Key Challenges
Environmental and Regulatory Restrictions
Stringent regulations on the use and disposal of xanthates pose a challenge for market players. Concerns over toxicity and potential water contamination have led to increased monitoring and restrictions on xanthate use in several regions. Compliance with environmental regulations adds to production and operational costs, impacting profitability. Manufacturers must invest in safer formulations and robust waste management solutions to mitigate regulatory risks and ensure sustainable market presence.
Volatility in Raw Material Prices
The production cost of xanthates is influenced by fluctuations in raw material prices, including carbon disulfide and alcohols. Price volatility can affect margins for manufacturers and create uncertainty in supply contracts with mining companies. This challenge is further compounded by global supply chain disruptions, which can lead to delays and cost escalations. Companies need to adopt effective procurement strategies and explore local sourcing options to minimize the impact of price fluctuations on production and profitability.
Regional Analysis
North America
North America held 28% share of the xanthate market in 2024, driven by robust mining activities and demand for base metals such as copper, zinc, and nickel. The U.S. and Canada are major contributors, with ongoing investments in ore beneficiation plants and exploration projects. Technological advancements in flotation processes and the adoption of environmentally compliant reagents support market growth. The region’s focus on sustainable mining operations and stricter environmental regulations encourage the development of safer xanthate formulations. Growth in infrastructure and renewable energy projects further boosts the need for metals, sustaining demand for flotation chemicals.
Europe
Europe accounted for 22% share in 2024, supported by growing mining and mineral processing activities, particularly in Russia, Poland, and Scandinavia. The region emphasizes eco-friendly and sustainable mineral processing, driving demand for high-performance, low-toxicity xanthates. European regulations encourage the use of safer chemicals, pushing manufacturers to innovate and develop greener solutions. The market is also influenced by demand from downstream industries such as automotive and construction, which require consistent metal supply. Investments in advanced mineral processing technologies enhance flotation efficiency, creating opportunities for xanthate producers to provide tailored, high-quality flotation agents.
Asia-Pacific
Asia-Pacific dominated the xanthate market with 35% share in 2024, fueled by extensive mining operations in China, India, and Australia. Rapid industrialization, urbanization, and infrastructure development are increasing demand for metals such as copper, lead, and zinc, driving xanthate consumption. China remains the largest producer and consumer due to its strong base metals industry and focus on improving ore recovery rates. Rising investments in mineral processing plants and government-backed mining initiatives support further market growth. Asia-Pacific’s growing focus on productivity and operational efficiency ensures steady demand for effective flotation agents like xanthates across diverse mining sectors.
Middle East & Africa
The Middle East & Africa captured 10% share in 2024, with South Africa leading due to its significant mining activities in gold, platinum, and base metals. Countries such as Saudi Arabia and UAE are investing in expanding mining infrastructure to diversify their economies, further supporting xanthate demand. The region benefits from abundant mineral reserves, and modernization of processing plants is driving adoption of advanced flotation chemicals. Rising foreign investments and joint ventures with global mining companies are boosting production capacity. Environmental awareness is gradually increasing, encouraging the adoption of safer, high-efficiency xanthate formulations.
Latin America
Latin America accounted for 5% share of the xanthate market in 2024, with key contributions from Brazil, Chile, and Peru. The region is a major hub for copper, gold, and silver mining, creating consistent demand for flotation agents. Expansion of mining projects and the discovery of new ore reserves continue to fuel xanthate consumption. Governments are supporting foreign investments in mineral extraction, encouraging modernization of processing facilities. However, environmental and social regulations are becoming stricter, driving the need for safer, sustainable reagents. Strong export markets for base metals ensure steady growth for xanthate suppliers in the region.
Market Segmentations:
By Product
- Sodium ethyl xanthate
- Sodium isopropyl xanthate
- Sodium isobutyl xanthate
- Others
By Application
- Mining
- Agrochemicals
- Rubber processing
- Others
By End Use Industry
- Agriculture
- Chemical
- Mining & metallurgy
- Others
By Geography
- North America
- U.S.
- Canada
- Mexico
- Europe
- UK
- France
- Germany
- Italy
- Spain
- Russia
- Belgium
- Netherlands
- Austria
- Sweden
- Poland
- Denmark
- Switzerland
- Rest of Europe
- Asia Pacific
- China
- Japan
- South Korea
- India
- Australia
- Thailand
- Indonesia
- Vietnam
- Malaysia
- Philippines
- Taiwan
- Rest of Asia Pacific
- Latin America
- Brazil
- Argentina
- Peru
- Chile
- Colombia
- Rest of Latin America
- Middle East
- UAE
- KSA
- Israel
- Turkey
- Iran
- Rest of Middle East
- Africa
- Egypt
- Nigeria
- Algeria
- Morocco
- Rest of Africa
Competitive Landscape
Competitive landscape of the xanthate market is shaped by leading players including Coogee Chemicals, Vizag Chemicals, Yantai Humon Group, Charles Tennant & Company, Newzeal Chem, Kavya Pharma, JAM Group, Tieling Flotation Reagent Co. Ltd, China Qingdao Hong Jin Chemical Company, and Senmin. These companies focus on manufacturing high-quality sodium ethyl, isopropyl, and isobutyl xanthates to meet global demand from mining and metallurgy sectors. Strategies include capacity expansions, partnerships with major mining firms, and investments in sustainable production technologies. Players are also prioritizing compliance with environmental regulations by developing safer, eco-friendly flotation reagents. Competitive dynamics are driven by pricing strategies, product consistency, and global distribution capabilities. Many companies are expanding operations in Asia-Pacific and Latin America, where mining activities are growing rapidly. Continuous R&D efforts to enhance flotation performance and reduce toxicity are helping key players strengthen their market presence and build long-term relationships with end users.
Key Player Analysis
- Coogee Chemicals
- Vizag Chemicals
- Yantai Humon Group
- Charles Tennant & Company
- Newzeal Chem
- Kavya Pharma
- JAM Group
- Tieling Flotation Reagent Co. Ltd
- China Qingdao Hong Jin Chemical Company
- Senmin
Recent Developments
- In August 2025, Coogee Chemicals expanded its potassium ethyl xanthate production capacity by 8,000 metric tons annually to meet rising demand from the mining sector, especially copper and gold flotation operations in Asia-Pacific.
- In 2025, Yantai Humon Group upgraded its xanthate manufacturing facility to increase annual production by 10,000 metric tons, focusing on potassium amyl xanthate used extensively in base metal mining in China.
- In 2024, Coogee Chemicals expanded its liquid xanthate production facility in Western Australia, doubling its capacity to supply automated mining sites across the Asia-Pacific region.
Report Coverage
The research report offers an in-depth analysis based on Product, Application, End Use Industry and Geography. It details leading market players, providing an overview of their business, product offerings, investments, revenue streams, and key applications. Additionally, the report includes insights into the competitive environment, SWOT analysis, current market trends, as well as the primary drivers and constraints. Furthermore, it discusses various factors that have driven market expansion in recent years. The report also explores market dynamics, regulatory scenarios, and technological advancements that are shaping the industry. It assesses the impact of external factors and global economic changes on market growth. Lastly, it provides strategic recommendations for new entrants and established companies to navigate the complexities of the market.
Future Outlook
- Demand for xanthates will grow with expansion of global mining and mineral processing projects.
- Sodium ethyl xanthate will remain the leading product due to high efficiency in flotation applications.
- Adoption of eco-friendly and low-toxicity xanthate formulations will increase to meet regulatory standards.
- Automation and digital monitoring in mineral processing will boost precision use of xanthates.
- Asia-Pacific will continue to dominate driven by strong production in China, India, and Australia.
- Strategic partnerships between suppliers and mining companies will enhance long-term supply security.
- Research into bio-based alternatives will create opportunities for sustainable xanthate production.
- Fluctuations in raw material prices will encourage development of cost-efficient production technologies.
- Growth in copper and gold demand will directly support higher xanthate consumption.
- Investments in capacity expansion and distribution networks will strengthen global market presence.
Request a Free Sample
Fill in your details and we'll send you a free sample report.
- Sample data tables & charts
- Research methodology
Need a Custom Version of This Report?
Tailor the scope, geography, or segments to your exact requirements.
- Custom geography or segment scope
- Direct access to our analyst team
Frequently Asked Questions
What is the current market size for Xanthate market, and what is its projected size in 2032?
At what Compound Annual Growth Rate is the Xanthate market projected to grow between 2025 and 2032?
Which Xanthate market segment held the largest share in 2024?
What are the primary factors fueling the growth of the Xanthate market?
Who are the leading companies in the Xanthate market?
Table of Content
Chapter 1. Report Introduction
- 1.1 Report Description & Purpose
- 1.1.1 Report Title & Market Definition
- 1.1.2 Unique Selling Propositions (USP) & Key Differentiators
- 1.1.3 Value Proposition for Stakeholders
- 1.2 Research Objectives
- 1.2.1 Market Sizing Objectives (Volume & Revenue)
- 1.2.2 Segmentation Objectives
- 1.2.3 Competitive Intelligence Objectives
- 1.2.4 Forecast & Scenario Objectives
- 1.3 Report Scope
- 1.3.1 Xanthate Scope – Types & Subtypes Covered
- 1.3.2 Geographic Scope – Regions & Countries Covered
- 1.3.3 Historical Period, Base Year & Forecast Period (2024; forecast to 2032)
- 1.3.4 Inclusions & Exclusions
- 1.4 HS Code & Classification Framework
- 1.5 Currency, Units & Pricing Basis
- 1.6 Target Stakeholders
- 1.7 Limitations & Assumptions
Chapter 2. Executive Summary
- 2.1 Global Xanthate Market Snapshot
- 2.1.1 Market Size – Historical (2024) & Forecast (2024-2032) (2024: USD 953 Million → 2032: USD 1,589.4 Million)
- 2.1.2 Volume & Revenue – Global Totals
- 2.1.3 Key Market Highlights – Top Five Facts
- 2.2 Xanthate Market Segmentation Snapshot
- 2.2.1 Market Split by Region – 2024 vs. 2032
- 2.3 Competitive Snapshot
- 2.3.1 Top 10 Players by Revenue Share – 2024
- 2.3.2 Top 10 Players by Volume Share – 2024
- 2.3.3 Recent Strategic Developments (18-Month Summary)
- 2.4 Key Investment Highlights & Strategic Conclusions
Chapter 3. Xanthate Market Dynamics & Industry Analysis
- 3.1 Market Overview & Context
- 3.1.1 Xanthate Market Position in the Broader Automotive Value Chain
- 3.1.2 OEM vs. Replacement Market Dynamics
- 3.1.3 Market Maturity & Development Stage by Region
- 3.2 Xanthate Market Drivers
- 3.3 Xanthate Market Restraints & Challenges
- 3.4 Xanthate Market Opportunities
- 3.5 Porter's Five Forces Analysis
- 3.5.1 Threat of New Entrants
- 3.5.2 Bargaining Power of Suppliers
- 3.5.3 Bargaining Power of Buyers
- 3.5.4 Threat of Substitutes
- 3.5.5 Competitive Rivalry – Intensity Assessment
- 3.6 Xanthate Value Chain Analysis
- 3.6.1 Upstream – Raw Material/Input Suppliers
- 3.6.1.1 Raw Material/Input 1
- 3.6.1.2 Raw Material/Input 2
- 3.6.1.3 Raw Material/Input 3
- 3.6.2 Midstream – Production/Manufacturing/Service Delivery
- 3.6.2.1 Production/Process Overview
- 3.6.2.2 Key Facility Locations & Capacity by Manufacturer
- 3.6.3 Downstream – Distribution & End Consumer
- 3.6.3.1 Primary Channel – B2B/OEM
- 3.6.3.2 Secondary Channels – Dealer, Retail, Online, Direct
- 3.6.4 Value Chain Profitability Analysis
- 3.6.1 Upstream – Raw Material/Input Suppliers
- 3.7 PESTEL Analysis
- 3.7.1 Political Factors
- 3.7.2 Economic Factors
- 3.7.3 Social Factors
- 3.7.4 Technological Factors
- 3.7.5 Environmental Factors
- 3.7.6 Legal Factors
- 3.8 Xanthate Supply Chain Analysis
- 3.8.1 Raw Material/Input Supply Risk Assessment
- 3.8.2 Manufacturing Concentration Risk (Geographic Exposure)
- 3.8.3 Trade Disruption Impact Analysis
- 3.9 Regulatory & Policy Landscape
Note: The regulatory and policy landscape section covers regulations based on their applicability to the market, Xanthate category, geography, and scope of the study. Only regulatory frameworks with a material impact on operations, compliance, trade, sustainability, or market access are analyzed in detail.
Chapter 4. Key Investment Pockets & Opportunity Analysis
- 4.1 Xanthate Market Attractiveness Analysis
- 4.1.1 By Region – Investment Attractiveness Matrix (Volume × CAGR)
- 4.2 Absolute Revenue Growth Opportunity
- 4.2.1 By Region – Absolute USD Growth Through 2032
- 4.3 Incremental Volume Opportunity
- 4.3.1 By Region – Incremental Volume Through 2032
- 4.3.2 Segment – Incremental Volume
- 4.4 Emerging Submarket Opportunity Deep Dive (Subject to Applicability)
- 4.5 Emerging Market Opportunity Scorecards
- 4.5.1 United States
- 4.5.2 Europe
- 4.5.3 Asia
- 4.5.4 Middle East & Africa
Note: Emerging Market Opportunity Scorecards will be included based on relevance and strategic importance. Regions listed are indicative and may vary depending on data availability and market dynamics.
Chapter 5. Xanthate Import-Export Analysis & Trade Flows
- 5.1 Global Trade Overview
- 5.1.1 Global Export Value by Country (2024)
- 5.1.2 Global Export Volume by Country (2024)
- 5.1.3 Global Import Value by Country (2024)
- 5.1.4 Global Import Volume by Country (2024)
- 5.1.5 Net Trade Balance by Country (2024)
- 5.2 Export Analysis – Segment
- 5.2.1 Type 1 (HS Code)
- 5.2.2 Type 2 (HS Code)
- 5.2.3 Type 3 (HS Code)
- 5.2.4 Type 4 (HS Code)
- 5.2.5 Type 5 (HS Code)
- 5.3 Import Analysis – Segment
- 5.3.1 Type 1 (HS Code)
- 5.3.2 Type 2 (HS Code)
- 5.3.3 Type 3 (HS Code)
- 5.3.4 Type 4 (HS Code)
- 5.3.5 Type 5 (HS Code)
- 5.4 Average Unit Trade Prices
- 5.4.1 Average Export Price – Segment & Country
- 5.4.2 Average Import Price – Segment & Source Country
- 5.4.3 Price Trends (2024)
- 5.5 Key Trade Route Analysis
- 5.5.1 Trade Route 1
- 5.5.2 Trade Route 2
- 5.5.3 Trade Route 3
- 5.5.4 Trade Route 4
- 5.5.5 Trade Route 5
- 5.6 Trade Policy Impact Assessment
- 5.6.1 US Anti-Dumping & Section 301 Tariffs
- 5.6.2 EU Customs Union Impact
- 5.6.3 Major Free Trade Agreements
- 5.6.4 USMCA Rules of Origin
Note: Trade policy analysis will be included only where relevant to the Xanthate market.
Chapter 6. Competitive Landscape & Company Benchmarking
- 6.1 Xanthate Market Concentration & Structure
- 6.1.1 Herfindahl-Hirschman Index (HHI) – vs. 2024
- 6.1.2 Tier 1, Tier 2 & Tier 3 Market Structure
- 6.1.3 Global, Regional & Local Player Dynamics
- 6.2 Xanthate Market Share Analysis – 2024
- 6.2.1 Global Revenue Share by Company
- 6.2.2 Global Volume Share by Company
- 6.2.3 Regional Revenue Share
- 6.2.4 Market Share Evolution ( vs. 2024)
- 6.2.5 OEM Segment Share by Company
- 6.2.6 Replacement Segment Share by Company
- 6.3 Production/Delivery Capacity & Facility Analysis
- 6.3.1 Global Installed Capacity
- 6.3.2 Capacity Utilization Rates
- 6.3.3 Production/Output Volume
- 6.3.4 Facility Locations & Capacity Map
- 6.3.5 Planned Capacity Additions
- 6.4 Xanthate Competitive Benchmarking Matrix
- 6.4.1 Revenue, Volume, CAGR & Profitability Comparison
- 6.4.2 Channel Revenue Mix
- 6.4.3 Geographic Revenue Exposure
- 6.4.4 R&D Intensity
- 6.4.5 Sustainability Maturity
- 6.5 Strategic Developments in Xanthate (Last 24 Months)
- 6.5.1 Mergers, Acquisitions & Divestments
- 6.5.2 New Xanthate Launches
- 6.5.3 Facility Expansions
- 6.5.4 Strategic Alliances, Joint Ventures & Partnerships
- 6.5.5 Distribution Expansion & Market Entry
- 6.5.6 Sustainability & ESG Initiatives
- 6.6 Competitive Strategy Mapping
- 6.6.1 Leader, Challenger, Follower & Niche Classification
- 6.6.2 Pricing Strategy Comparison
- 6.6.3 Channel Strategy Matrix
Note: Strategic developments are included based on their materiality and the availability of reliable information.
Chapter 7. Global Xanthate Market – By Distribution Channel
- 7.1 Segment Overview
- 7.1.1 Volume & Revenue Split by Channel (2024 & 2032)
- 7.1.2 Channel Mix Evolution (2024-2032)
Chapter 8. Regional Market Analysis – Global Overview
- 8.1 Global Regional Overview
- 8.1.1 Regional Volume Share
- 8.1.2 Regional Revenue Share
- 8.1.3 Regional Volume by Region
- 8.1.4 Regional Revenue by Region
- 8.1.5 Regional Forecast Through 2032
- 8.2 Cross-Regional Segment Analysis
- 8.2.1 By Distribution Channel
- 8.2.2 By Brand/Price Tier
Chapter 9. North America Xanthate Market
- 9.1 United States
- 9.2 Canada
- 9.3 Mexico
Chapter 10. Europe Xanthate Market
- 10.1 Germany
- 10.2 France
- 10.3 Italy
- 10.4 United Kingdom
- 10.5 Spain
- 10.6 Poland
- 10.7 Russia
- 10.8 Netherlands
- 10.9 Belgium
- 10.10 Sweden
- 10.11 Denmark
- 10.12 Norway
- 10.13 Rest of Europe
Chapter 11. Asia Pacific Xanthate Market
- 11.1 China
- 11.2 India
- 11.3 Japan
- 11.4 South Korea
- 11.5 Thailand
- 11.6 Indonesia
- 11.7 Vietnam
- 11.8 Malaysia
- 11.9 Australia
- 11.10 Rest of Asia Pacific
Chapter 12. Latin America Xanthate Market
- 12.1 Brazil
- 12.2 Argentina
- 12.3 Colombia
- 12.4 Chile
- 12.5 Rest of Latin America
Chapter 13. Middle East Xanthate Market
- 13.1 Saudi Arabia
- 13.2 United Arab Emirates
- 13.3 Turkey
- 13.4 Israel
- 13.5 Iran
- 13.6 Rest of the Middle East
Chapter 14. Africa Xanthate Market
- 14.1 South Africa
- 14.2 Egypt
- 14.3 Nigeria
- 14.4 Morocco
- 14.5 Rest of Africa
Chapter 15. Xanthate Company Profiles
- 15.1 [Company 01]
- 15.1.1 Company Overview
- 15.1.2 Key Management Personnel
- 15.1.3 Products & Services Portfolio
- 15.1.4 Financial Performance
- 15.1.5 Key Market Focus & Geographic Presence
- 15.1.6 Recent Developments & Strategic Initiatives
Note: The company profile list is preliminary and may change based on research findings, market developments, data availability, and client requirements.
Chapter 16. Appendices
- Appendix A – List of Abbreviations & Acronyms
- Appendix B – Industry Classification Code Reference – Full Series
- Appendix C – Production & Capacity Data Tables
- Appendix D – End-Use & Demand Base Tables
- Appendix E – Consumption & Replacement Rate Assumptions
- Appendix F – ASP Reference Tables
- Appendix G – Manufacturing & Facility Database
- Appendix H – Import-Export Data Tables
- Appendix I – Regulatory Summary Tables
- Appendix J – Primary Research Participant List (Anonymized)
- Appendix K – Primary Research Questionnaire Framework
- Appendix L – Data Sources & Bibliography
- Appendix M – Market Size Divergence & Source Comparison
Chapter 17. Research Methodology
- 17.1 Research Framework & Philosophy
- 17.2 Secondary Research – Sources, Hierarchy & Data Extraction
- 17.3 Data Modeling – Bottom-Up & Top-Down Market Sizing
- 17.4 Primary Research – Stakeholder Framework, LOI & Sample Sizes
- 17.5 Forecast Methodology – Regression, Scenario & Sensitivity Analysis
- 17.6 Quality Control – Four-Layer Validation Framework
- 17.7 Limitations & Standard Assumptions
- 17.8 Disclaimer
