Market Overview:
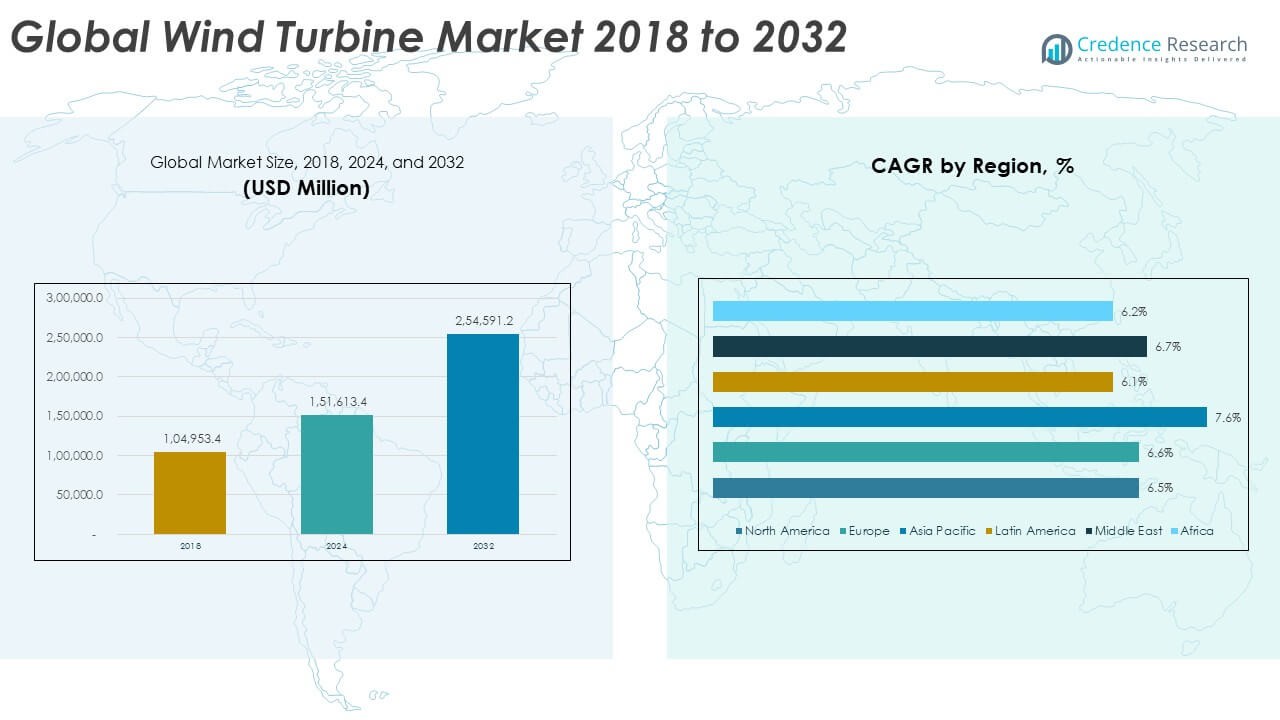
The Global Wind Turbine Market size was valued at USD 104,953.4 million in 2018 to USD 151,613.4 million in 2024 and is anticipated to reach USD 254,591.2 million by 2032, at a CAGR of 6.74% during the forecast period.
| REPORT ATTRIBUTE |
DETAILS |
| Historical Period |
2020-2023 |
| Base Year |
2024 |
| Forecast Period |
2025-2032 |
| Wind Turbine Market Size 2024 |
USD 151,613.4 Million |
| Wind Turbine Market, CAGR |
6.74% |
| Wind Turbine Market Size 2032 |
USD 254,591.2 Million |
The market growth is primarily driven by rising investments in renewable energy infrastructure and government initiatives promoting clean energy transition. Increasing awareness of carbon reduction goals, advancements in turbine efficiency, and falling production costs are enhancing adoption. Offshore wind projects are gaining strong traction due to higher energy yields and improved turbine technology, while continuous innovation in blade design and digital monitoring systems supports market efficiency.
Regionally, Asia-Pacific leads the market due to strong wind energy expansion in China and India, supported by favorable government policies and grid integration projects. Europe remains a key contributor with large-scale offshore installations in the UK, Germany, and Denmark. North America shows steady growth with rising investment in hybrid renewable systems. Emerging markets in Latin America and Africa are witnessing new project launches, driven by supportive energy transition policies and foreign investments.
Access crucial information at unmatched prices!
Request your sample report today & start making informed decisions powered by Credence Research Inc.!
Download Sample
Market Insights:
- The Global Wind Turbine Market size was valued at USD 104,953.4 million in 2018, grew to USD 151,613.4 million in 2024, and is expected to reach USD 254,591.2 million by 2032, registering a CAGR of 6.74% during the forecast period.
- Asia Pacific holds the largest share at 31%, driven by rapid industrialization, large-scale capacity additions in China and India, and strong government incentives for renewable energy expansion.
- North America follows with 29% share, supported by federal tax incentives, corporate PPAs, and offshore wind projects along the U.S. coastline, while Europe captures 22% due to its leadership in offshore technology and mature policy framework.
- The fastest-growing region is Asia Pacific, fueled by policy-driven investments, local manufacturing strength, and the rise of hybrid renewable projects integrating wind with solar and storage systems.
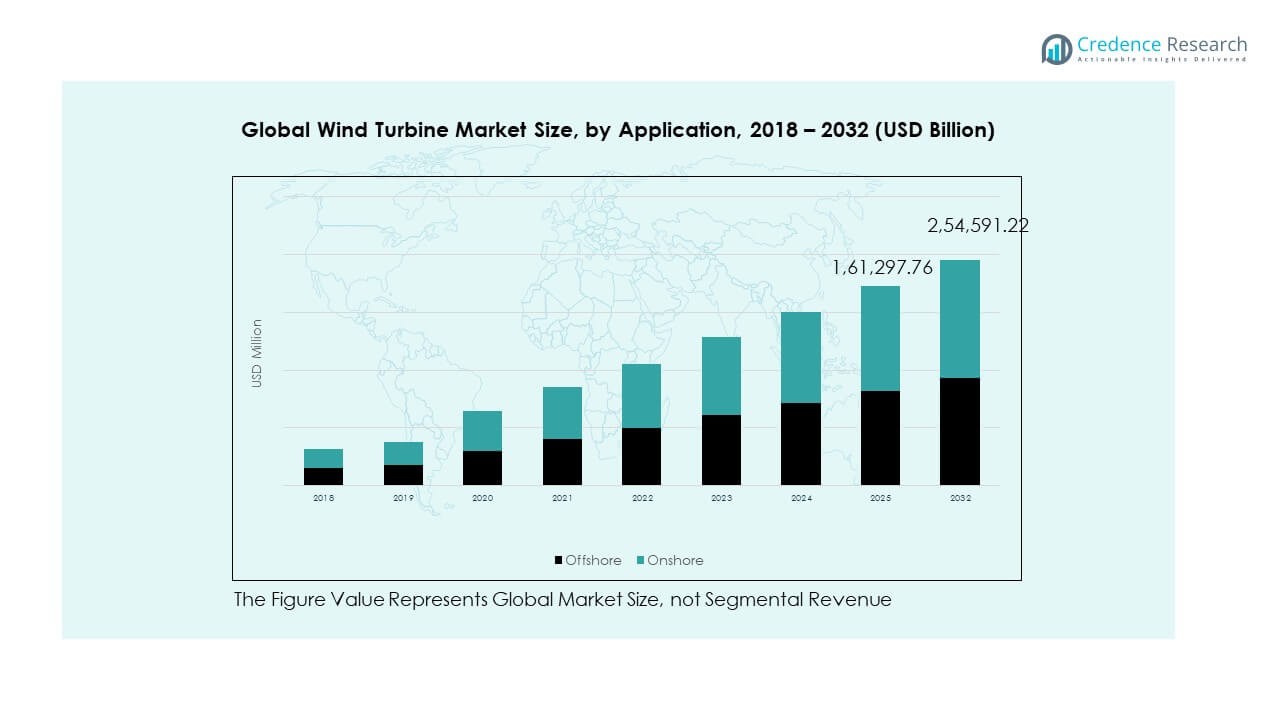
- In 2024, onshore wind accounted for around 65% of the total market, while offshore contributed nearly 35%, with the offshore segment projected to grow faster due to high-capacity installations and advances in floating turbine technology.
Market Drivers:
Rising Global Shift Toward Renewable Energy and Decarbonization Policies
The Global Wind Turbine Market is expanding due to strong global initiatives to reduce carbon emissions and dependence on fossil fuels. Governments are implementing renewable energy targets and offering financial incentives to accelerate wind energy adoption. Growing environmental concerns and international commitments under agreements like the Paris Accord strengthen the demand for sustainable energy systems. It benefits from supportive tax credits, subsidies, and low-interest project financing. The reduction in turbine costs and higher energy yields improve the technology’s competitiveness against conventional sources. Increased public and private investments in clean energy infrastructure also drive industry growth. The growing emphasis on grid modernization and energy storage complements the demand for efficient turbines. Overall, the policy and financial environment encourages long-term development and capacity expansion worldwide.
- For instance, in May 2025, Vestas surpassed 1 GW in firm onshore orders for its 7 MW+ wind turbine variants in Germany, highlighting rapid decarbonization under rigorous policy frameworks with high-volume, high-efficiency installations.
Technological Advancements Enhancing Efficiency and Reducing Operational Costs
Rapid advancements in turbine design, materials, and digital monitoring systems have improved the efficiency and durability of wind turbines. Manufacturers are developing larger rotor diameters, longer blades, and higher hub heights to maximize power generation. Smart sensors and predictive maintenance systems enhance operational reliability and reduce downtime. These innovations make wind projects more profitable and cost-effective. The Global Wind Turbine Market benefits from increased automation and AI-driven performance analytics. Integration with hybrid renewable systems improves grid stability and energy supply consistency. Offshore wind technology is advancing rapidly, enabling deeper installations and higher capacity factors. Continuous R&D efforts from major OEMs further drive product innovation and market growth.
- For instance, GE Vernova’s Haliade-X 13 MW+ next-gen offshore platform began operations at the Dogger Bank wind farm in October 2023, and it will be scaled up to 277 turbines (mix of 13 and 14 MW), supplying up to 5% of the UK’s total electricity demand.
Rising Corporate Investment and Power Purchase Agreements (PPAs)
Corporations are increasingly investing in wind energy projects to meet sustainability goals and reduce operational carbon footprints. The expansion of long-term power purchase agreements supports steady revenue streams for developers. Multinational companies are partnering with renewable energy providers to secure green energy supplies at fixed costs. The Global Wind Turbine Market gains from this trend as more industrial and commercial users prioritize clean energy adoption. Corporate buyers play a vital role in financing utility-scale and distributed wind projects. The shift toward self-generation and microgrid integration increases turbine deployment across new applications. Growing investor confidence in renewable projects enhances capital inflows. Stable returns from PPAs create predictable growth opportunities for the entire value chain.
Expansion of Offshore Wind Projects and Grid Integration Initiatives
Offshore wind installations are expanding rapidly due to stronger and more consistent wind resources available at sea. Governments in Europe, Asia-Pacific, and North America are launching large-scale offshore projects to diversify their energy mix. The Global Wind Turbine Market is benefiting from advanced foundation designs and floating turbines that allow deeper-water deployment. Grid expansion projects are supporting better transmission of offshore energy to onshore networks. The decline in installation and maintenance costs strengthens the viability of offshore developments. Collaboration between governments and private developers ensures long-term investment stability. The integration of smart grids enhances energy efficiency and reduces curtailment. Offshore wind continues to emerge as a critical contributor to the global renewable energy landscape.
Market Trends:
Adoption of Smart Turbine Technologies and Predictive Maintenance Systems
Digital transformation is reshaping wind energy operations through the adoption of IoT, AI, and data analytics. The Global Wind Turbine Market is witnessing rising demand for intelligent control systems that monitor performance in real time. Predictive maintenance solutions help operators detect faults early and reduce unplanned downtime. Digital twins simulate turbine behavior under various environmental conditions, improving operational efficiency. The use of cloud-based platforms enhances fleet management and maintenance scheduling. Machine learning algorithms optimize energy output and extend turbine lifespan. These digital tools also aid in resource forecasting and performance benchmarking. The growing trend of digitalization improves overall reliability and profitability of wind projects.
- For instance, Siemens Gamesa, using NVIDIA’s Omniverse platform, has deployed digital twins and AI-driven analytics to optimize wind farm layouts globally, covering over 100 GW of wind power as of 2025, improving production efficiency and reducing operating costs for tens of thousands of turbines worldwide.
Growth in Hybrid and Distributed Energy Systems Integration
The industry is seeing increasing integration of wind turbines with solar, storage, and microgrid systems. This hybrid configuration improves reliability and ensures a steady power supply. The Global Wind Turbine Market benefits from distributed generation models that reduce transmission losses and grid dependency. Hybrid projects support 24-hour renewable energy availability and make renewable adoption feasible in remote regions. Energy storage advancements further stabilize fluctuating wind output. Grid operators are deploying control systems to balance power across diverse sources. The trend supports grid resilience and supports regions with variable weather conditions. These integrated systems are reshaping the structure of modern renewable power infrastructure.
- For instance, in September 2025, Goldwind announced a $2.7 billion investment into a 3 GW integrated wind project in Inner Mongolia, with over 80% of output allocated to green hydrogen, ammonia, and methanol production, and green chemicals output expected to reach 600,000 tons methanol and 400,000 tons ammonia per year.
Rising Offshore Wind Capacity and Floating Turbine Development
The expansion of offshore wind farms continues to be one of the strongest trends in global renewable growth. The Global Wind Turbine Market is evolving toward larger, floating offshore installations capable of deep-water deployment. These systems enable energy capture from regions previously inaccessible to traditional fixed-bottom turbines. Advancements in materials and anchoring technologies are improving structural safety and cost efficiency. Offshore wind provides higher capacity factors and lower variability compared to onshore systems. Governments are offering dedicated zones and auction programs for offshore developments. Increased collaboration among energy firms and shipbuilders supports faster project completion. This trend is expected to dominate future renewable capacity expansion strategies.
Sustainability Focus and Use of Recyclable Composite Materials
Manufacturers are adopting recyclable materials to reduce environmental impact and comply with circular economy goals. The Global Wind Turbine Market is seeing efforts to replace traditional fiberglass blades with eco-friendly composites. Research focuses on biodegradable polymers and thermoplastic resins for easier recycling. Turbine end-of-life management is gaining attention from regulators and industry stakeholders. The development of closed-loop recycling systems improves sustainability performance. Material innovation enhances turbine strength while lowering production emissions. Companies are investing in sustainable manufacturing facilities powered by renewable energy. These initiatives reflect a shift toward greener and more responsible production processes.
Market Challenges Analysis:
High Capital Expenditure and Complex Supply Chain Constraints
Wind turbine projects require significant upfront investment, covering turbine manufacturing, logistics, and installation. The Global Wind Turbine Market faces high capital intensity that can limit participation from smaller developers. Transporting large components to remote or offshore sites increases operational costs. The supply chain often depends on specialized vessels, heavy cranes, and skilled labor. Currency fluctuations and material price volatility further affect cost stability. Manufacturers face rising raw material costs, particularly for steel, composites, and rare-earth magnets. Project financing can be challenging in developing regions due to credit limitations. The complexity of permitting and land acquisition also delays project execution. These financial and logistical barriers hinder large-scale deployment and profitability.
Grid Integration, Intermittency, and Environmental Regulations
Integrating wind power into existing grid networks remains a technical and regulatory challenge. The Global Wind Turbine Market contends with power variability that can strain grid stability. Limited energy storage capacity restricts the ability to balance intermittent output. Grid upgrades and smart infrastructure investments are required to accommodate higher renewable penetration. Stringent environmental impact assessments delay new project approvals. Wildlife conservation, noise, and visual impact concerns create additional regulatory hurdles. Offshore projects must comply with maritime and ecological guidelines, increasing development time. Delays in policy approvals and transmission connectivity affect overall efficiency. Managing these integration and compliance challenges remains crucial for long-term market expansion.
Market Opportunities:
Rising Demand in Emerging Economies and Offshore Expansion Potential
Emerging markets in Asia, Latin America, and Africa offer major opportunities for new wind capacity additions. The Global Wind Turbine Market is positioned to benefit from favorable policy reforms and infrastructure modernization. Nations like India, Brazil, and Vietnam are promoting private investment in wind energy to meet growing electricity demand. Offshore potential along coastlines in these regions remains largely untapped. Low installation costs and high wind potential create an attractive business environment. International partnerships are enabling technology transfer and local manufacturing. Expanding regional grids and interconnections improve project viability. This geographic diversification enhances global competitiveness and long-term stability.
Innovation in Turbine Design and Energy Storage Integration
Continuous research in turbine architecture and blade aerodynamics drives new market opportunities. The Global Wind Turbine Market is moving toward modular, lightweight designs for easier assembly and maintenance. Integration with advanced energy storage systems improves output predictability and reduces curtailment. Battery hybridization ensures steady power supply during low-wind conditions. Manufacturers are exploring hydrogen generation using excess wind power to expand renewable applications. Floating turbines open vast new offshore zones for installation. Collaboration among energy firms, governments, and technology providers accelerates innovation. These advancements create future-ready opportunities for sustainable and scalable wind energy deployment.
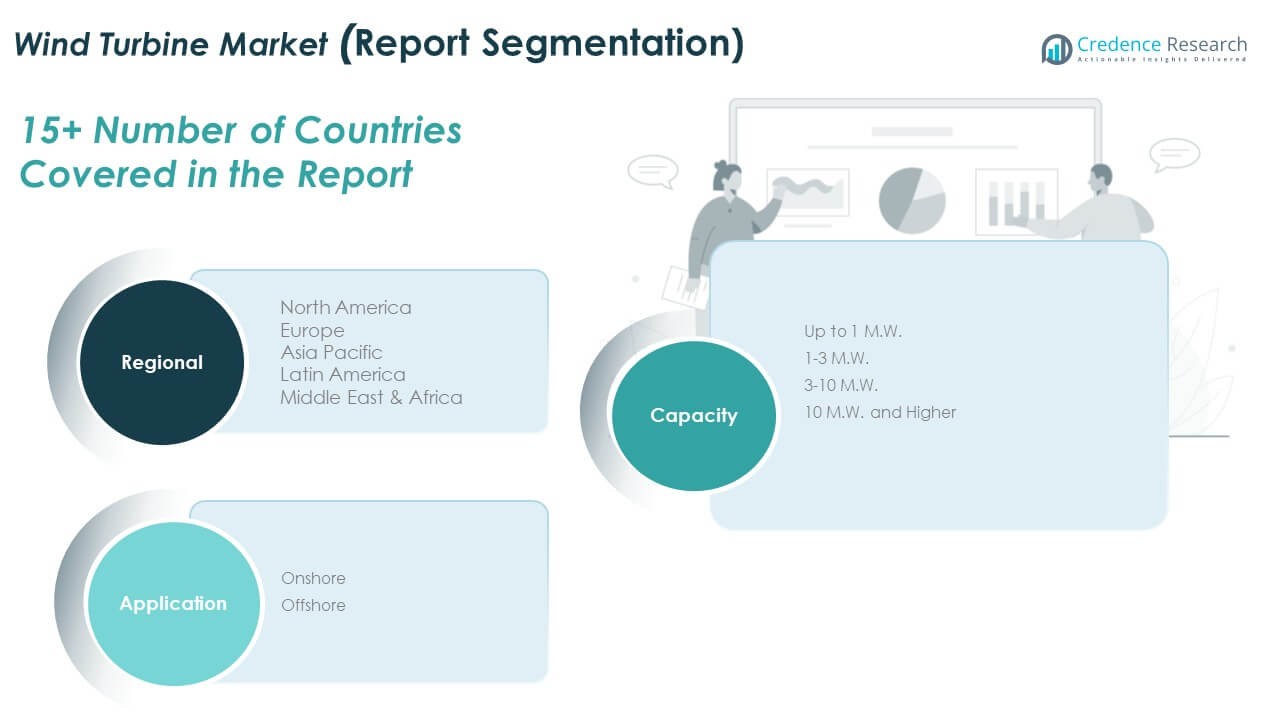
Market Segmentation Analysis:
By Capacity Segment
The Global Wind Turbine Market is segmented into Up to 1 MW, 1–3 MW, 3–10 MW, and 10 MW and Higher. The 1–3 MW segment holds a major share due to widespread adoption across onshore wind farms and balanced efficiency-to-cost ratios. The 3–10 MW segment is expanding rapidly, supported by utility-scale and offshore projects requiring high-capacity turbines. The 10 MW and Higher segment represents the next growth frontier, driven by large offshore installations and innovations in rotor and blade technology. Smaller turbines below 1 MW continue to serve community-scale and hybrid renewable projects, particularly in remote areas. Continuous improvements in energy yield and modular turbine design strengthen the performance of mid-to-large capacity categories. Manufacturers are investing in scalable systems that enhance energy capture in low and high wind environments. The demand shift toward higher capacity turbines aligns with global decarbonization and cost-efficiency goals.
- For instance, Nordex Group, in June 2025, secured major orders to supply N163/6.X turbines totaling 147 MW for Latvia’s Pienava wind farm—the largest such contract for the country, as well as multiple 6.X MW turbine contracts in Germany and the UK for onshore high-capacity applications.
By Application Segment
The market is divided into Onshore and Offshore applications. Onshore wind remains the dominant segment due to established infrastructure, faster deployment, and lower maintenance costs. It supports rural electrification and large-scale grid integration in both developed and developing economies. Offshore wind is gaining strong traction, supported by government incentives and technological advancements in floating platforms. Offshore projects deliver higher energy output and longer operational lifespans. The Global Wind Turbine Market benefits from this diversification, creating a balanced ecosystem of land-based and marine energy solutions that enhance grid reliability and renewable energy supply worldwide.
- For instance, Hornsea 2 offshore wind farm (Ørsted/Siemens Gamesa) uses 165 units of 8 MW turbines off the UK coast, achieving 1.32 GW capacity—making it the world’s largest operating offshore wind installation since 2022 and capable of supplying power to over 1.3 million British homes.
Segmentation:
By Capacity Segment
- Up to 1 MW
- 1–3 MW
- 3–10 MW
- 10 MW and Higher
By Application Segment
By Region
- North America
- Europe
- Germany
- France
- U.K.
- Italy
- Spain
- Rest of Europe
- Asia Pacific
- China
- Japan
- India
- South Korea
- South-east Asia
- Rest of Asia Pacific
- Latin America
- Brazil
- Argentina
- Rest of Latin America
- Middle East & Africa
- GCC Countries
- South Africa
- Rest of the Middle East and Africa
Regional Analysis:
North America
The North America Wind Turbine Market size was valued at USD 37,552.33 million in 2018 to USD 53,668.99 million in 2024 and is anticipated to reach USD 88,826.88 million by 2032, at a CAGR of 6.5% during the forecast period. North America holds around 29% share of the Global Wind Turbine Market, driven by the U.S. and Canada’s strong renewable energy targets. The U.S. leads regional growth with expanding onshore and offshore installations supported by federal tax incentives and corporate PPAs. Canada continues to develop large-scale projects in Alberta and Ontario, backed by favorable wind resources. It benefits from a mature grid network and access to advanced turbine technologies. Offshore developments along the East Coast and Great Lakes are gaining momentum. Rising investments from private and institutional investors further strengthen the sector. Modernization of transmission infrastructure and cross-border energy trade support long-term stability.
Europe
The Europe Wind Turbine Market size was valued at USD 28,054.05 million in 2018 to USD 40,116.92 million in 2024 and is anticipated to reach USD 66,448.31 million by 2032, at a CAGR of 6.6% during the forecast period. Europe contributes nearly 22% share of the Global Wind Turbine Market, anchored by strong policy frameworks and offshore leadership. Germany, the U.K., and Denmark remain top contributors due to supportive renewable laws and advanced manufacturing capabilities. It maintains momentum through green transition initiatives and carbon neutrality goals. Offshore wind capacity expansion in the North Sea and Baltic Sea drives regional investment. Countries like Spain and France are focusing on hybrid and repowering projects to optimize efficiency. The European Union’s renewable directives and funding programs stimulate innovation and technology exports. The presence of major OEMs further consolidates Europe’s dominance in turbine development and export potential.
Asia Pacific
The Asia Pacific Wind Turbine Market size was valued at USD 21,420.99 million in 2018 to USD 32,562.24 million in 2024 and is anticipated to reach USD 58,301.39 million by 2032, at a CAGR of 7.6% during the forecast period. Asia Pacific dominates with about 31% share of the Global Wind Turbine Market, driven by rapid industrialization and power demand. China leads with the world’s largest installed capacity and a strong domestic manufacturing ecosystem. India follows with expanding onshore wind farms supported by government auctions and green corridor programs. Japan, South Korea, and Australia are focusing on offshore wind projects for energy diversification. It benefits from low turbine production costs and an integrated supply chain network. Regional collaboration in technology transfer accelerates innovation and cost efficiency. Strong policy support and clean energy financing continue to attract private investments. The region remains the fastest-growing contributor to global renewable expansion.
Latin America
The Latin America Wind Turbine Market size was valued at USD 11,198.53 million in 2018 to USD 15,670.33 million in 2024 and is anticipated to reach USD 25,179.07 million by 2032, at a CAGR of 6.1% during the forecast period. Latin America accounts for nearly 10% share of the Global Wind Turbine Market, with Brazil leading in installed capacity and new project pipelines. Mexico and Argentina are developing wind corridors supported by favorable wind conditions and policy incentives. It benefits from lower land costs and high capacity factors across coastal regions. The expansion of private sector participation and long-term PPAs fuels regional growth. Governments are encouraging hybrid renewable integration for grid stability. Technological collaborations with European and Asian firms enhance efficiency and performance. The rising focus on clean power access and export potential boosts investment prospects.
Middle East
The Middle East Wind Turbine Market size was valued at USD 4,554.98 million in 2018 to USD 6,554.03 million in 2024 and is anticipated to reach USD 10,947.42 million by 2032, at a CAGR of 6.7% during the forecast period. The Middle East represents around 5% share of the Global Wind Turbine Market, led by the UAE and Saudi Arabia’s diversification from oil-based energy. National Vision programs and clean energy strategies promote large-scale renewable projects. It benefits from vast desert terrains with consistent wind resources. Offshore and hybrid wind-solar projects are gaining policy attention. Partnerships with global turbine manufacturers drive technology adoption and skill development. Regional governments are implementing tenders and auction schemes to attract foreign investors. Strong infrastructure and financing frameworks support the transition toward cleaner energy systems. The growing energy export diversification boosts regional competitiveness in renewables.
Africa
The Africa Wind Turbine Market size was valued at USD 2,172.54 million in 2018 to USD 3,040.93 million in 2024 and is anticipated to reach USD 4,888.15 million by 2032, at a CAGR of 6.2% during the forecast period. Africa holds approximately 3% share of the Global Wind Turbine Market, led by South Africa, Egypt, and Morocco. Growing electrification needs and renewable-friendly policies drive adoption. It benefits from international funding and regional energy partnerships. South Africa continues to expand its Renewable Energy Independent Power Producer Procurement Program (REIPPPP). North African nations are leveraging wind resources for domestic and export power generation. Local manufacturing initiatives are gaining support through technology transfer agreements. The continent’s vast wind potential remains underdeveloped but promising. Infrastructure development and favorable regulation will accelerate market growth in the coming years.
Shape Your Report to Specific Countries or Regions & Enjoy 30% Off!
Key Player Analysis:
- Vestas Wind Systems A/S
- Siemens Gamesa Renewable Energy S.A.
- GE Renewable Energy
- Enercon GmbH
- Nordex SE
- Inox Wind
- Mingyang Smart Energy Group Ltd.
- Goldwind
- Envision Energy
- Other Key Players
Competitive Analysis:
The Global Wind Turbine Market is characterized by high competition among global and regional manufacturers focused on capacity expansion and innovation. Major players such as Vestas, Siemens Gamesa, GE Renewable Energy, Goldwind, and Nordex dominate through strong product portfolios and large-scale installations. It continues to witness strategic alliances, R&D collaborations, and mergers aimed at improving turbine efficiency and reliability. The market’s competitiveness is driven by technological differentiation in blade design, digital control systems, and offshore capabilities. Companies are investing in service networks and predictive maintenance solutions to enhance customer retention. Expanding production footprints across Asia and Europe ensures cost efficiency and faster delivery cycles.
Recent Developments:
- In October 2025, GE Renewable Energy (GE Vernova) announced the acquisition of the remaining 50% stake in Prolec GE from its partner Xignux, bringing full ownership and enhancing GE’s offering in grid and electrification solutions with a $5.275 billion deal. The transaction bolsters GE Vernova’s capacity to supply critical electrical infrastructure amidst surging demand, especially from the data center market in North America.
- In September 2025, Vestas Wind Systems A/S announced four new orders totaling 132 MW, marking a significant expansion of its presence across critical wind energy markets globally. In addition, Vestas entered into a strategic partnership with Perses Energy Solutions for the Las Pavas wind project, further demonstrating its commitment to strategic collaborations within the sector. On September 4, 2025, Vestas officially took over the Goleniów onshore blade factory in Poland, a move reinforcing its European manufacturing capabilities. Likewise, in July 2025, Vestas formed a memorandum of cooperation with Nippon Steel for steel supply to support wind towers in Europe, Asia, and Japan, exemplifying worldwide supply chain strengthening.
- Enercon GmbH, in September 2025, announced a partnership agreement with JUWI to develop wind energy projects in Germany, reflecting Enercon’s proactive expansion into hybrid wind solutions. Around the same time, Enercon focused on launching its E-175 EP5 large onshore turbine—an integrated system for hybrid energy plants designed for performance and flexibility in diverse grid environments.
Report Coverage:
The research report offers an in-depth analysis based on Capacity Segment and Application Segment. It details leading market players, providing an overview of their business, product offerings, investments, revenue streams, and key applications. Additionally, the report includes insights into the competitive environment, SWOT analysis, current market trends, as well as the primary drivers and constraints. Furthermore, it discusses various factors that have driven market expansion in recent years. The report also explores market dynamics, regulatory scenarios, and technological advancements that are shaping the industry. It assesses the impact of external factors and global economic changes on market growth. Lastly, it provides strategic recommendations for new entrants and established companies to navigate the complexities of the market.
Future Outlook:
- Rising government incentives and renewable energy mandates will expand wind project installations worldwide.
- Offshore wind will continue to gain importance with advancements in floating turbine technology.
- Digitalization and AI-based performance monitoring will improve operational efficiency.
- Corporate PPAs and decarbonization commitments will drive large-scale investment in clean energy.
- Innovations in recyclable materials and lightweight blades will enhance sustainability.
- Hybrid projects integrating wind with solar and storage will support grid reliability.
- Local manufacturing initiatives will strengthen regional supply chain resilience.
- The demand for turbines above 10 MW will grow in utility-scale offshore applications.
- Emerging markets in Asia, Latin America, and Africa will experience accelerated adoption.
- Strategic collaborations among OEMs, utilities, and governments will define future market competitiveness.


