
Antioxidants Market Overview:
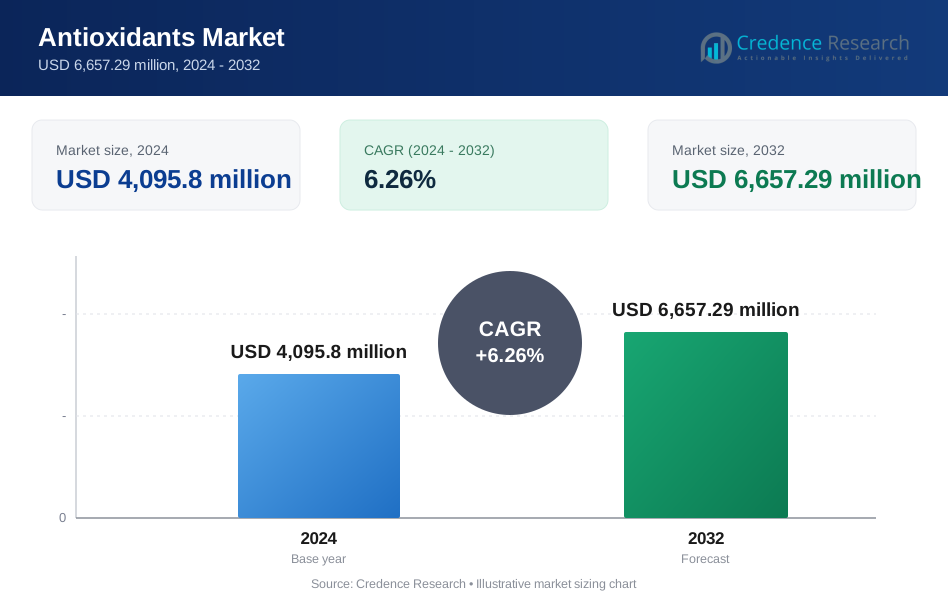
The global antioxidants market was valued at USD 4,095.8 million in 2024 and is anticipated to reach USD 6,657.29 million by 2032, expanding at a CAGR of 6.26% during the forecast period.
| REPORT ATTRIBUTE | DETAILS |
|---|---|
| Historical Period | 2020-2023 |
| Base Year | 2024 |
| Forecast Period | 2025-2032 |
| Antioxidants Market Size 2024 | USD 4,095.8 million |
| Antioxidants Market , CAGR | 6.26% |
| Antioxidants Market Size 2032 | USD 6,657.29 million |
Antioxidants Market Insights
- Market growth is primarily driven by rising consumption of processed foods, expansion of commercial animal feed production, and increasing need for oxidation control in pharmaceuticals, fuels, lubricants, plastics, and rubber products to enhance shelf life and performance stability.
- Key trends include a gradual shift toward natural antioxidants in food and personal care, increased use of customized antioxidant blends, and sustained dominance of synthetic antioxidants, which account for nearly 58% of total demand due to cost efficiency and high thermal stability.
- The competitive landscape is moderately consolidated, with leading players focusing on portfolio expansion, regulatory compliance, application-specific solutions, and global distribution strength to maintain long-term customer relationships.
- Regionally, Asia Pacific leads with about 38% market share, followed by North America (24%) and Europe (22%), while food and feed additives remain the dominant application segment with approximately 46% share.
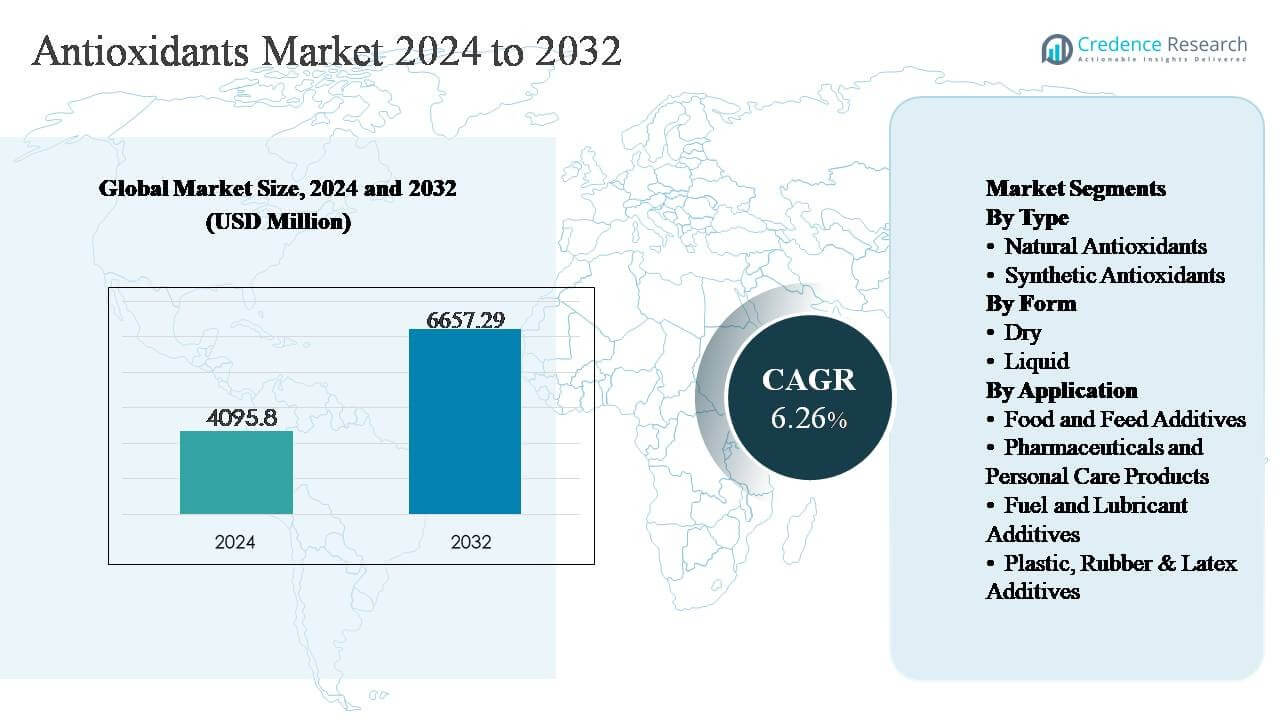
Antioxidants Market Segmentation Analysis:
By Type:
By type, the antioxidants market is segmented into natural and synthetic antioxidants, with synthetic antioxidants dominating the segment, accounting for approximately 58% of the market share. Their dominance is driven by superior cost efficiency, consistent performance, and strong thermal stability, making them widely preferred in high-volume applications such as food processing, animal feed, plastics, and fuels. Compounds such as BHA, BHT, and TBHQ are extensively used due to their long shelf life and reliable oxidation control. Meanwhile, natural antioxidants are gaining steady traction, supported by clean-label trends and growing regulatory and consumer preference for plant-derived solutions.
- For instance, BASF manufactures hindered phenolic antioxidants under the Irganox™ brand at global facilities including McIntosh, Alabama offering high-performance grades that maintain polymer stability at processing temperatures exceeding 280 °C.
By Form:
Based on form, the market is categorized into dry and liquid antioxidants, with the dry form holding a dominant share of nearly 62%. Dry antioxidants are widely favored due to their ease of handling, longer storage stability, precise dosing, and compatibility with solid formulations in food, feed, pharmaceutical, and polymer processing. Powdered antioxidants are particularly prevalent in feed premixes, bakery products, and plastic compounding applications. Liquid antioxidants, while smaller in share, are gaining adoption in fuel, lubricant, and cosmetic formulations where rapid dispersion, uniform blending, and process efficiency are critical performance requirements.
- For instance, Kemin Industries operates dedicated dry blending and spray-drying units at its Iowa manufacturing site capable of producing antioxidant premixes in batch sizes exceeding 20 metric tons per production run, ensuring consistent particle size distribution below 300 microns for uniform feed incorporation.
By Application:
By application, food and feed additives represent the dominant sub-segment, contributing around 46% of the total market share. Growth is driven by rising global food production, increased demand for shelf-life extension, and the need to preserve nutritional quality in processed foods and animal feed. Antioxidants are essential for preventing lipid oxidation in fats, oils, and feed formulations. Pharmaceuticals and personal care products form a significant secondary segment, supported by formulation stability needs, while fuel, lubricant, and plastic, rubber & latex additives continue to expand due to industrial growth and material durability requirements.
Key Growth Drivers
Expanding Demand from Food and Animal Feed Industries
The growing scale of global food processing and animal nutrition industries remains a primary driver of the antioxidants market. Antioxidants are critical for preventing oxidative degradation in fats, oils, and nutrient-rich formulations, thereby extending shelf life and maintaining product quality. Rapid urbanization, rising disposable incomes, and increased consumption of packaged and convenience foods have significantly increased reliance on antioxidant additives. In animal feed, antioxidants support feed stability, nutrient retention, and animal health, especially in high-energy diets used in poultry, swine, and aquaculture. The shift toward intensive livestock farming and commercial feed production continues to reinforce consistent demand. Regulatory emphasis on feed safety and quality further strengthens adoption across both developed and emerging markets.
- For instance, Archer Daniels Midland (ADM) operates edible oil refining and food ingredient facilities that process more than 40,000 metric tons of vegetable oils per day, where antioxidant systems such as tocopherols and synthetic stabilizers are dosed at controlled milligram-per-kilogram levels to maintain peroxide values within food-grade specifications throughout storage and distribution.
Rising Use in Pharmaceuticals and Personal Care Formulations
Pharmaceutical and personal care applications are emerging as strong growth drivers due to the functional role antioxidants play in stabilizing active ingredients and enhancing product efficacy. In pharmaceuticals, antioxidants protect APIs from oxidative degradation, supporting longer shelf life and therapeutic effectiveness. In personal care and cosmetics, they are widely used to preserve formulations, prevent rancidity of oils, and deliver skin-protective benefits. Growth in preventive healthcare, aging populations, and rising awareness of skincare and wellness products has accelerated antioxidant consumption. Additionally, increasing production of dermatological, nutraceutical, and topical formulations continues to create sustained demand across global manufacturing hubs.
- For instance, Merck KGaA manufactures pharmaceutical-grade antioxidants such as ascorbic acid and sodium metabisulfite at its Darmstadt operations, where controlled synthesis and purification lines produce batches exceeding 5,000 kg with residual impurity levels maintained below pharmacopeial limits, enabling oxidative stability of injectable and solid oral dosage formulations.
Industrial Expansion in Fuels, Lubricants, and Polymers
The expanding use of antioxidants in fuels, lubricants, plastics, rubber, and latex applications is another major growth driver. Antioxidants enhance thermal stability, oxidation resistance, and material durability, which are critical for high-performance industrial products. In fuels and lubricants, antioxidants help prevent sludge formation and viscosity breakdown under extreme operating conditions. In plastics and rubber, they extend product life and improve resistance to heat and UV exposure. Growth in automotive production, infrastructure development, and industrial manufacturing particularly in Asia Pacific continues to support strong and diversified industrial demand for antioxidant solutions.
Key Trends & Opportunities
Increasing Shift Toward Natural and Clean-Label Antioxidants
A major trend shaping the antioxidants market is the gradual shift toward natural and plant-based antioxidant solutions. Clean-label preferences, regulatory scrutiny of synthetic additives, and growing consumer awareness are encouraging manufacturers to explore alternatives such as tocopherols, rosemary extracts, and ascorbic acid derivatives. Food, beverage, and personal care brands are increasingly reformulating products to align with natural positioning and sustainability goals. This shift presents strong opportunities for suppliers investing in botanical sourcing, extraction technologies, and standardized natural formulations. While cost remains a consideration, innovation and scale are improving commercial viability.
- For instance, DSM-Firmenich produces natural mixed tocopherols from identity-preserved, non-GMO vegetable oil distillates at its state-of-the-art production facilities, such as its site in Sisseln, Switzerland.
Application-Specific and Customized Antioxidant Blends
Another key opportunity lies in the development of application-specific and customized antioxidant blends. End users increasingly seek solutions tailored to specific processing conditions, shelf-life requirements, and regulatory frameworks. Customized blends improve performance efficiency while reducing overall additive usage. This trend is particularly evident in animal feed premixes, specialty plastics, high-temperature lubricants, and advanced pharmaceutical formulations. Suppliers offering technical support, formulation expertise, and performance validation are well positioned to gain competitive advantage. Customization also strengthens long-term customer relationships and enhances value-added service offerings.
- For instance, Lanxess develops customized antioxidant systems for lubricants at its application laboratories, utilizing high-temperature oxidation stability testing rigs that operate continuously above 150 °C to ensure long-term protection in industrial gear oils and hydraulic fluids.
Key Challenges
Regulatory Complexity and Compliance Pressure
Regulatory compliance remains a significant challenge for antioxidant manufacturers, particularly across food, feed, and pharmaceutical applications. Approval requirements, usage limits, and labeling standards vary widely across regions, increasing the complexity of global product commercialization. Synthetic antioxidants face heightened scrutiny in certain markets, while natural antioxidants must meet strict quality, consistency, and safety standards. Navigating evolving regulations increases development costs and time-to-market. Smaller manufacturers may struggle to maintain compliance across multiple jurisdictions, while larger players must continuously invest in testing, documentation, and regulatory engagement.
Volatility in Raw Material Supply and Pricing
Fluctuations in raw material availability and pricing present another key challenge for the antioxidants market. Natural antioxidants are particularly exposed to agricultural supply variability, climate conditions, and geopolitical disruptions affecting sourcing regions. Synthetic antioxidants, while more stable in production, are sensitive to petrochemical feedstock price volatility and energy costs. These factors can pressure margins and disrupt supply chains, especially during periods of high demand. Managing procurement risks, maintaining inventory stability, and balancing cost competitiveness without compromising quality remain ongoing challenges for market participants.
Regional Analysis
Asia Pacific
Asia Pacific dominates the global antioxidants market with an estimated 38% market share, driven by strong growth in food processing, animal feed production, pharmaceuticals, and polymer manufacturing. Rapid urbanization, expanding middle-class consumption, and rising demand for packaged foods significantly support antioxidant usage across the region. China and India lead consumption due to large-scale livestock farming, feed manufacturing capacity, and expanding pharmaceutical production bases. Additionally, the region’s growing automotive and plastics industries continue to drive demand for antioxidants in polymers and lubricants. Favorable manufacturing economics and expanding export-oriented industries further strengthen Asia Pacific’s leadership position.
North America
North America accounts for approximately 24% of the global antioxidants market, supported by advanced food processing industries, stringent quality standards, and high consumption of packaged and functional foods. The United States represents the largest contributor, driven by strong demand across food additives, animal nutrition, pharmaceuticals, and personal care products. High regulatory compliance requirements promote consistent use of approved antioxidants to ensure product stability and safety. Growth in high-performance lubricants, specialty plastics, and healthcare formulations also contributes to regional demand. Continuous innovation and strong presence of multinational manufacturers reinforce North America’s stable and technology-driven market position.
Europe
Europe holds nearly 22% market share in the global antioxidants market, driven by strict regulatory frameworks, mature food and feed industries, and a strong focus on product quality and safety. Countries such as Germany, France, and the United Kingdom represent key consumption hubs, supported by well-established pharmaceutical, cosmetic, and specialty chemical sectors. The region shows increasing adoption of natural antioxidants, influenced by clean-label trends and sustainability initiatives. Additionally, Europe’s strong automotive and polymer manufacturing base sustains demand for antioxidants in plastics, rubber, and lubricants, ensuring steady growth across industrial applications.
Latin America
Latin America represents around 9% of the global antioxidants market, supported by expanding food processing, animal feed, and agricultural industries. Brazil and Mexico are the leading markets, driven by large livestock populations, growing meat exports, and increasing demand for feed preservatives. Rising urbanization and packaged food consumption further support antioxidant adoption in food applications. While the region remains cost-sensitive, demand for effective synthetic antioxidants remains strong. Gradual growth in pharmaceutical manufacturing and industrial applications, including plastics and rubber, continues to improve market penetration across emerging Latin American economies.
Middle East & Africa
The Middle East & Africa accounts for approximately 7% market share and represents a developing but steadily expanding antioxidants market. Growth is driven by increasing food imports, rising packaged food consumption, and expanding livestock and poultry production in key countries such as Saudi Arabia, South Africa, and the UAE. Antioxidants are increasingly used to improve shelf life and product stability under harsh climatic conditions. Industrial demand from lubricants, fuels, and plastics is gradually rising alongside infrastructure and automotive sector development. Although smaller in scale, the region offers long-term growth potential as food security and industrialization initiatives progress.
Antioxidants Market Segmentations:
By Type
- Natural Antioxidants
- Synthetic Antioxidants
By Form
- Dry
- Liquid
By Application
- Food and Feed Additives
- Pharmaceuticals and Personal Care Products
- Fuel and Lubricant Additives
- Plastic, Rubber & Latex Additives
By Geography
- North America
- U.S.
- Canada
- Mexico
- Europe
- Germany
- France
- U.K.
- Italy
- Spain
- Rest of Europe
- Asia Pacific
- China
- Japan
- India
- South Korea
- South-east Asia
- Rest of Asia Pacific
- Latin America
- Brazil
- Argentina
- Rest of Latin America
- Middle East & Africa
- GCC Countries
- South Africa
- Rest of the Middle East and Africa
Competitive Landscape
The competitive landscape of the antioxidants market is characterized by the presence of established multinational chemical and ingredient manufacturers competing on product performance, regulatory compliance, and application expertise. Leading players maintain diversified portfolios spanning synthetic and natural antioxidants to serve food, feed, pharmaceutical, personal care, and industrial end-use sectors.
Companies emphasize continuous innovation in formulation stability, thermal resistance, and oxidation control to meet evolving customer requirements. Strategic priorities include expanding production capacity, strengthening global distribution networks, and offering application-specific and customized antioxidant blends. Major participants also invest in technical support services and collaborative development with end users to enhance product integration and long-term partnerships.
Additionally, mergers, acquisitions, and geographic expansion remain key strategies to strengthen market presence, access emerging markets, and broaden technological capabilities, reinforcing competitive differentiation in a highly regulated and performance-driven global market.
Key Player Analysis
- BASF SE
- Camlin Fine Sciences Ltd.
- Chr. Hansen Holding A/S
- DuPont de Nemours, Inc.
- Eastman Chemical Company
- Kemin Industries, Inc.
- Koninklijke DSM N.V.
- Naturex
- Archer Daniels Midland Company
- Barentz
Recent Developments
- In March 2025, BASF announced an investment to increase the production capacity of aminic antioxidants for lubricant applications at its Puebla, Mexico manufacturing site, reinforcing its ability to meet rising oxidative stability demands for engine and industrial oils.
- In July 2024, DuPont Nutrition & Health highlighted its GUARDIAN TOCO 30P antioxidant, a naturally-sourced mixed tocopherol powder designed for improved label-friendly lipid oxidation protection, particularly in food and nutraceutical formulations.
Report Coverage
The research report offers an in-depth analysis based on Type, Form, Application and Geography. It details leading market players, providing an overview of their business, product offerings, investments, revenue streams, and key applications. Additionally, the report includes insights into the competitive environment, SWOT analysis, current market trends, as well as the primary drivers and constraints. Furthermore, it discusses various factors that have driven market expansion in recent years. The report also explores market dynamics, regulatory scenarios, and technological advancements that are shaping the industry. It assesses the impact of external factors and global economic changes on market growth. Lastly, it provides strategic recommendations for new entrants and established companies to navigate the complexities of the market.
Request a Free Sample
Fill in your details and we'll send you a free sample report.
- Sample data tables & charts
- Research methodology
Need a Custom Version of This Report?
Tailor the scope, geography, or segments to your exact requirements.
- Custom geography or segment scope
- Direct access to our analyst team
Frequently Asked Questions
What is the current market size for Antioxidants, and what is its projected size in 2032?
At what Compound Annual Growth Rate is the Antioxidants market projected to grow between 2024 and 2032?
Which Antioxidants segment held the largest share in 2024?
What are the primary factors fueling the growth of the Antioxidants market?
Who are the leading companies in the Antioxidants market?
Which region commanded the largest share of the Antioxidants market in 2024?
Table of Content
Chapter 1. Report Introduction
- 1.1 Report Description & Purpose
- 1.1.1 Report Title & Market Definition
- 1.1.2 Unique Selling Propositions (USP) & Key Differentiators
- 1.1.3 Value Proposition for Stakeholders
- 1.2 Research Objectives
- 1.2.1 Market Sizing Objectives (Volume & Revenue)
- 1.2.2 Segmentation Objectives
- 1.2.3 Competitive Intelligence Objectives
- 1.2.4 Forecast & Scenario Objectives
- 1.3 Report Scope
- 1.3.1 Antioxidants Scope – Types & Subtypes Covered
- 1.3.2 Geographic Scope – Regions & Countries Covered
- 1.3.3 Historical Period, Base Year & Forecast Period (2024; forecast to 2032)
- 1.3.4 Inclusions & Exclusions
- 1.4 HS Code & Classification Framework
- 1.5 Currency, Units & Pricing Basis
- 1.6 Target Stakeholders
- 1.7 Limitations & Assumptions
Chapter 2. Executive Summary
- 2.1 Global Antioxidants Market Snapshot
- 2.1.1 Market Size – Historical (2024) & Forecast (2024-2032) (2024: USD 4,095.8 million → 2032: USD 6,657.29 million)
- 2.1.2 Volume & Revenue – Global Totals
- 2.1.3 Key Market Highlights – Top Five Facts
- 2.2 Antioxidants Market Segmentation Snapshot
- 2.2.1 Market Split by Region – 2024 vs. 2032
- 2.3 Competitive Snapshot
- 2.3.1 Top 10 Players by Revenue Share – 2024
- 2.3.2 Top 10 Players by Volume Share – 2024
- 2.3.3 Recent Strategic Developments (18-Month Summary)
- 2.4 Key Investment Highlights & Strategic Conclusions
Chapter 3. Antioxidants Market Dynamics & Industry Analysis
- 3.1 Market Overview & Context
- 3.1.1 Antioxidants Market Position in the Broader Automotive Value Chain
- 3.1.2 OEM vs. Replacement Market Dynamics
- 3.1.3 Market Maturity & Development Stage by Region
- 3.2 Antioxidants Market Drivers
- 3.3 Antioxidants Market Restraints & Challenges
- 3.4 Antioxidants Market Opportunities
- 3.5 Porter's Five Forces Analysis
- 3.5.1 Threat of New Entrants
- 3.5.2 Bargaining Power of Suppliers
- 3.5.3 Bargaining Power of Buyers
- 3.5.4 Threat of Substitutes
- 3.5.5 Competitive Rivalry – Intensity Assessment
- 3.6 Antioxidants Value Chain Analysis
- 3.6.1 Upstream – Raw Material/Input Suppliers
- 3.6.1.1 Raw Material/Input 1
- 3.6.1.2 Raw Material/Input 2
- 3.6.1.3 Raw Material/Input 3
- 3.6.2 Midstream – Production/Manufacturing/Service Delivery
- 3.6.2.1 Production/Process Overview
- 3.6.2.2 Key Facility Locations & Capacity by Manufacturer
- 3.6.3 Downstream – Distribution & End Consumer
- 3.6.3.1 Primary Channel – B2B/OEM
- 3.6.3.2 Secondary Channels – Dealer, Retail, Online, Direct
- 3.6.4 Value Chain Profitability Analysis
- 3.6.1 Upstream – Raw Material/Input Suppliers
- 3.7 PESTEL Analysis
- 3.7.1 Political Factors
- 3.7.2 Economic Factors
- 3.7.3 Social Factors
- 3.7.4 Technological Factors
- 3.7.5 Environmental Factors
- 3.7.6 Legal Factors
- 3.8 Antioxidants Supply Chain Analysis
- 3.8.1 Raw Material/Input Supply Risk Assessment
- 3.8.2 Manufacturing Concentration Risk (Geographic Exposure)
- 3.8.3 Trade Disruption Impact Analysis
- 3.9 Regulatory & Policy Landscape
Note: The regulatory and policy landscape section covers regulations based on their applicability to the market, Antioxidants category, geography, and scope of the study. Only regulatory frameworks with a material impact on operations, compliance, trade, sustainability, or market access are analyzed in detail.
Chapter 4. Key Investment Pockets & Opportunity Analysis
- 4.1 Antioxidants Market Attractiveness Analysis
- 4.1.1 By Region – Investment Attractiveness Matrix (Volume × CAGR)
- 4.2 Absolute Revenue Growth Opportunity
- 4.2.1 By Region – Absolute USD Growth Through 2032
- 4.3 Incremental Volume Opportunity
- 4.3.1 By Region – Incremental Volume Through 2032
- 4.3.2 Segment – Incremental Volume
- 4.4 Emerging Submarket Opportunity Deep Dive (Subject to Applicability)
- 4.5 Emerging Market Opportunity Scorecards
- 4.5.1 United States
- 4.5.2 Europe
- 4.5.3 Asia
- 4.5.4 Middle East & Africa
Note: Emerging Market Opportunity Scorecards will be included based on relevance and strategic importance. Regions listed are indicative and may vary depending on data availability and market dynamics.
Chapter 5. Antioxidants Import-Export Analysis & Trade Flows
- 5.1 Global Trade Overview
- 5.1.1 Global Export Value by Country (2024)
- 5.1.2 Global Export Volume by Country (2024)
- 5.1.3 Global Import Value by Country (2024)
- 5.1.4 Global Import Volume by Country (2024)
- 5.1.5 Net Trade Balance by Country (2024)
- 5.2 Export Analysis – Segment
- 5.2.1 Type 1 (HS Code)
- 5.2.2 Type 2 (HS Code)
- 5.2.3 Type 3 (HS Code)
- 5.2.4 Type 4 (HS Code)
- 5.2.5 Type 5 (HS Code)
- 5.3 Import Analysis – Segment
- 5.3.1 Type 1 (HS Code)
- 5.3.2 Type 2 (HS Code)
- 5.3.3 Type 3 (HS Code)
- 5.3.4 Type 4 (HS Code)
- 5.3.5 Type 5 (HS Code)
- 5.4 Average Unit Trade Prices
- 5.4.1 Average Export Price – Segment & Country
- 5.4.2 Average Import Price – Segment & Source Country
- 5.4.3 Price Trends (2024)
- 5.5 Key Trade Route Analysis
- 5.5.1 Trade Route 1
- 5.5.2 Trade Route 2
- 5.5.3 Trade Route 3
- 5.5.4 Trade Route 4
- 5.5.5 Trade Route 5
- 5.6 Trade Policy Impact Assessment
- 5.6.1 US Anti-Dumping & Section 301 Tariffs
- 5.6.2 EU Customs Union Impact
- 5.6.3 Major Free Trade Agreements
- 5.6.4 USMCA Rules of Origin
Note: Trade policy analysis will be included only where relevant to the Antioxidants market.
Chapter 6. Competitive Landscape & Company Benchmarking
- 6.1 Antioxidants Market Concentration & Structure
- 6.1.1 Herfindahl-Hirschman Index (HHI) – vs. 2024
- 6.1.2 Tier 1, Tier 2 & Tier 3 Market Structure
- 6.1.3 Global, Regional & Local Player Dynamics
- 6.2 Antioxidants Market Share Analysis – 2024
- 6.2.1 Global Revenue Share by Company
- 6.2.2 Global Volume Share by Company
- 6.2.3 Regional Revenue Share
- 6.2.4 Market Share Evolution ( vs. 2024)
- 6.2.5 OEM Segment Share by Company
- 6.2.6 Replacement Segment Share by Company
- 6.3 Production/Delivery Capacity & Facility Analysis
- 6.3.1 Global Installed Capacity
- 6.3.2 Capacity Utilization Rates
- 6.3.3 Production/Output Volume
- 6.3.4 Facility Locations & Capacity Map
- 6.3.5 Planned Capacity Additions
- 6.4 Antioxidants Competitive Benchmarking Matrix
- 6.4.1 Revenue, Volume, CAGR & Profitability Comparison
- 6.4.2 Channel Revenue Mix
- 6.4.3 Geographic Revenue Exposure
- 6.4.4 R&D Intensity
- 6.4.5 Sustainability Maturity
- 6.5 Strategic Developments in Antioxidants (Last 24 Months)
- 6.5.1 Mergers, Acquisitions & Divestments
- 6.5.2 New Antioxidants Launches
- 6.5.3 Facility Expansions
- 6.5.4 Strategic Alliances, Joint Ventures & Partnerships
- 6.5.5 Distribution Expansion & Market Entry
- 6.5.6 Sustainability & ESG Initiatives
- 6.6 Competitive Strategy Mapping
- 6.6.1 Leader, Challenger, Follower & Niche Classification
- 6.6.2 Pricing Strategy Comparison
- 6.6.3 Channel Strategy Matrix
Note: Strategic developments are included based on their materiality and the availability of reliable information.
Chapter 7. Global Antioxidants Market – By Distribution Channel
- 7.1 Segment Overview
- 7.1.1 Volume & Revenue Split by Channel (2024 & 2032)
- 7.1.2 Channel Mix Evolution (2024-2032)
Chapter 8. Regional Market Analysis – Global Overview
- 8.1 Global Regional Overview
- 8.1.1 Regional Volume Share
- 8.1.2 Regional Revenue Share
- 8.1.3 Regional Volume by Region
- 8.1.4 Regional Revenue by Region
- 8.1.5 Regional Forecast Through 2032
- 8.2 Cross-Regional Segment Analysis
- 8.2.1 By Distribution Channel
- 8.2.2 By Brand/Price Tier
Chapter 9. North America Antioxidants Market
- 9.1 United States
- 9.2 Canada
- 9.3 Mexico
Chapter 10. Europe Antioxidants Market
- 10.1 Germany
- 10.2 France
- 10.3 Italy
- 10.4 United Kingdom
- 10.5 Spain
- 10.6 Poland
- 10.7 Russia
- 10.8 Netherlands
- 10.9 Belgium
- 10.10 Sweden
- 10.11 Denmark
- 10.12 Norway
- 10.13 Rest of Europe
Chapter 11. Asia Pacific Antioxidants Market
- 11.1 China
- 11.2 India
- 11.3 Japan
- 11.4 South Korea
- 11.5 Thailand
- 11.6 Indonesia
- 11.7 Vietnam
- 11.8 Malaysia
- 11.9 Australia
- 11.10 Rest of Asia Pacific
Chapter 12. Latin America Antioxidants Market
- 12.1 Brazil
- 12.2 Argentina
- 12.3 Colombia
- 12.4 Chile
- 12.5 Rest of Latin America
Chapter 13. Middle East Antioxidants Market
- 13.1 Saudi Arabia
- 13.2 United Arab Emirates
- 13.3 Turkey
- 13.4 Israel
- 13.5 Iran
- 13.6 Rest of the Middle East
Chapter 14. Africa Antioxidants Market
- 14.1 South Africa
- 14.2 Egypt
- 14.3 Nigeria
- 14.4 Morocco
- 14.5 Rest of Africa
Chapter 15. Antioxidants Company Profiles
- 15.1 [Company 01]
- 15.1.1 Company Overview
- 15.1.2 Key Management Personnel
- 15.1.3 Products & Services Portfolio
- 15.1.4 Financial Performance
- 15.1.5 Key Market Focus & Geographic Presence
- 15.1.6 Recent Developments & Strategic Initiatives
Note: The company profile list is preliminary and may change based on research findings, market developments, data availability, and client requirements.
Chapter 16. Appendices
- Appendix A – List of Abbreviations & Acronyms
- Appendix B – Industry Classification Code Reference – Full Series
- Appendix C – Production & Capacity Data Tables
- Appendix D – End-Use & Demand Base Tables
- Appendix E – Consumption & Replacement Rate Assumptions
- Appendix F – ASP Reference Tables
- Appendix G – Manufacturing & Facility Database
- Appendix H – Import-Export Data Tables
- Appendix I – Regulatory Summary Tables
- Appendix J – Primary Research Participant List (Anonymized)
- Appendix K – Primary Research Questionnaire Framework
- Appendix L – Data Sources & Bibliography
- Appendix M – Market Size Divergence & Source Comparison
Chapter 17. Research Methodology
- 17.1 Research Framework & Philosophy
- 17.2 Secondary Research – Sources, Hierarchy & Data Extraction
- 17.3 Data Modeling – Bottom-Up & Top-Down Market Sizing
- 17.4 Primary Research – Stakeholder Framework, LOI & Sample Sizes
- 17.5 Forecast Methodology – Regression, Scenario & Sensitivity Analysis
- 17.6 Quality Control – Four-Layer Validation Framework
- 17.7 Limitations & Standard Assumptions
- 17.8 Disclaimer
