
| REPORT ATTRIBUTE | DETAILS |
|---|---|
| Historical Period | 2020-2023 |
| Base Year | 2024 |
| Forecast Period | 2025-2032 |
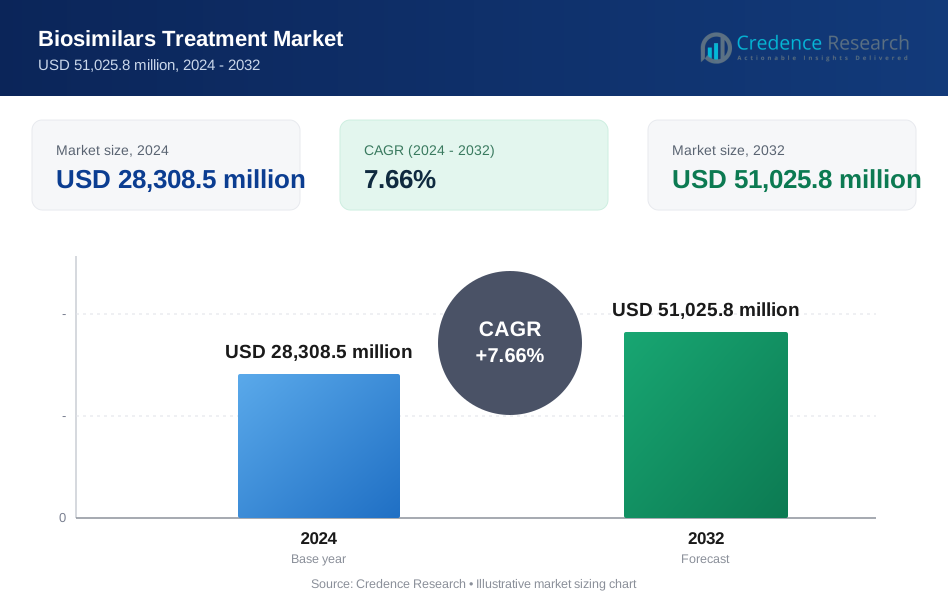
| Biosimilars Treatment Market Size 2024 | USD 28,308.5 million |
| Biosimilars Treatment Market, CAGR | 7.66% |
| Biosimilars Treatment MarketSize 2032 | USD 51,025.8 million |
Market Overview
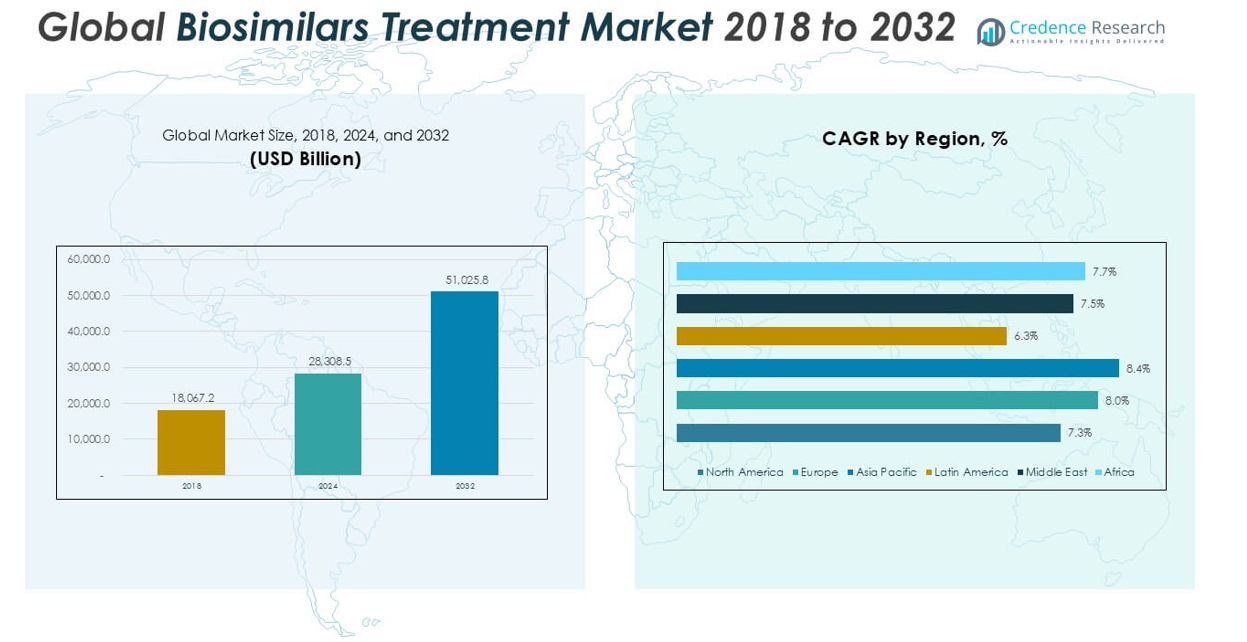
The Biosimilars Treatment market was valued at USD 18,067.2 million in 2018 and USD 28,308.5 million in 2024, and is anticipated to reach USD 51,025.8 million by 2032, at a CAGR of 7.66% during the forecast period.
The biosimilars treatment market features prominent players such as Pfizer, Sandoz International GmbH, Teva Pharmaceutical Industries Limited, Amgen, Biocon, Dr. Reddy’s Laboratories, F. Hoffman – La Roche, Celltrion, Eli Lilly and Company, and Samsung Bioepis, each contributing significantly to global market development through strategic partnerships and strong R&D investment. North America leads the market with a 34% share in 2024, driven by advanced healthcare infrastructure and robust biosimilar adoption. Europe follows with a 28% share, supported by mature regulatory frameworks and widespread acceptance. These regions serve as primary hubs for innovation, commercialization, and large-scale deployment of biosimilar therapies.
Market Insights
- The global biosimilars treatment market was valued at USD 28,308.5 million in 2024 and is projected to reach USD 51,025.8 million by 2032, registering a CAGR of 7.66%.
- Rising incidence of chronic diseases, increasing patent expiries of biologic drugs, and supportive regulatory pathways are driving the demand for biosimilars across key therapeutic segments.
- Market trends highlight expanding adoption in oncology and autoimmune disease treatment, with recombinant non-glycosylated proteins holding the largest product share at 42%, while oncology leads by application with a 38% share.
- The competitive landscape is shaped by major players such as Pfizer, Sandoz, Amgen, Biocon, and Dr. Reddy’s Laboratories, but high development costs, complex manufacturing, and physician reluctance act as notable restraints.
- Regionally, North America accounts for 34% of the market, followed by Europe at 28% and Asia Pacific at 21%, reflecting concentrated growth in established and emerging healthcare markets.
Market Segmentation Analysis:
By Product:
Recombinant non-glycosylated proteins represent the dominant product segment in the biosimilars treatment market, accounting for the largest market share in 2024. This leadership is driven by the extensive adoption of biosimilar versions of insulin, filgrastim, and growth hormones due to their established efficacy and lower manufacturing complexity. Growing prevalence of diabetes and cancer, coupled with favorable regulatory pathways for non-glycosylated molecules, continues to support segment expansion. Pharmaceutical companies focus on expanding product pipelines to address unmet clinical needs and sustain market growth.
- For instance, Sandoz’s Zarxio (filgrastim-sndz) was the first biosimilar approved by the U.S. FDA in March 2015, and by 2021, over 6 million doses of Zarxio had been administered in the United States.
By Application
Oncology remains the leading application segment, capturing the largest revenue share in the biosimilars treatment market. This dominance results from the increasing burden of cancer worldwide and the high cost of branded biologic therapies, which drives rapid uptake of biosimilar alternatives. Demand for cost-effective oncology biosimilars, such as trastuzumab and rituximab, continues to rise as healthcare systems seek to improve patient access and control expenditures. Robust clinical evidence and favorable reimbursement policies further propel market adoption within oncology.
- For instance, Celltrion’s Truxima (rituximab-abbs) had reached over 190,000 patients globally by the end of 2022 since its launch.
Market Overview
Patent Expiry of Biologics
The expiry of patents for major biologic drugs continues to drive growth in the biosimilars treatment market. As exclusivity for reference biologics ends, biosimilar manufacturers gain the opportunity to introduce cost-effective alternatives. This not only intensifies competition but also provides significant cost savings for healthcare systems and patients, fueling broader access and market expansion. Regulatory agencies have streamlined approval processes for biosimilars, which further accelerates product launches and market penetration.
- For instance, Amgen’s Amjevita (adalimumab-atto), after the expiry of Humira’s exclusivity, was launched in the U.S. in January 2023 and made available in 82,000 pharmacies nationwide through agreements with major wholesalers and pharmacy benefit managers.
Rising Prevalence of Chronic Diseases
A steady increase in the incidence of chronic conditions such as cancer, autoimmune disorders, and diabetes directly supports biosimilars market growth. These diseases often require long-term or lifelong biologic therapy, making affordable treatment options crucial for patients and healthcare providers. As the global population ages and disease burden rises, demand for cost-effective biosimilar therapies continues to escalate, reinforcing their role in improving health outcomes and reducing overall healthcare expenditure.
- For instance, Biocon supplied over 2.7 million vials of its biosimilar insulin Glargine (Semglee) to patients in the United States during 2022 alone.
Supportive Regulatory Environment
Global regulatory agencies have established clear, efficient pathways for biosimilar approval, enhancing manufacturer confidence and encouraging investment in biosimilar development. Policies that facilitate interchangeability, automatic substitution, and reimbursement for biosimilars stimulate their adoption. Countries implementing biosimilar-friendly frameworks see accelerated market uptake, increased physician and patient acceptance, and a more competitive pricing environment, all of which contribute to robust market growth.
Key Trends & Opportunities
Expansion of Oncology and Autoimmune Indications
The growing adoption of biosimilars in oncology and autoimmune therapy is a defining trend in the market. Successful launches of biosimilars for cancer drugs like trastuzumab and rituximab and autoimmune therapies such as infliximab are encouraging further innovation and portfolio diversification. Companies that capitalize on new therapeutic indications and demonstrate strong clinical evidence are positioned to gain a competitive edge and tap into large patient populations.
- For instance, Pfizer’s biosimilar Inflectra (infliximab-dyyb) was approved in more than 70 countries and had been prescribed to over 400,000 patients worldwide by 2021.
Increased Strategic Collaborations
Pharmaceutical firms are increasingly forming alliances, joint ventures, and licensing agreements to expand biosimilar pipelines and market reach. These collaborations facilitate access to advanced manufacturing technologies, regulatory expertise, and distribution channels. By sharing resources and expertise, companies can reduce development timelines and costs, accelerating the introduction of biosimilars into new markets and maximizing commercial opportunities.
- For instance, Samsung Bioepis and Biogen’s partnership has resulted in over 1 million patients being treated with their anti-TNF biosimilars in Europe as of 2022.
Key Challenges
Complex Manufacturing and Development
Biosimilars require highly sophisticated manufacturing processes, posing significant technical and operational challenges. Achieving consistent quality, safety, and efficacy that match the reference biologic demands substantial investment in state-of-the-art facilities and expertise. Any variability in production can lead to regulatory setbacks or market recalls, increasing risk for manufacturers and potentially delaying patient access to affordable treatments.
Market Acceptance and Physician Reluctance
Despite regulatory approvals, some physicians and patients remain cautious about transitioning from reference biologics to biosimilars. Concerns about efficacy, safety, and immunogenicity may slow adoption, especially in sensitive therapeutic areas such as oncology. Building trust through robust clinical data, physician education, and transparent communication is essential for increasing biosimilar uptake and overcoming market hesitancy.
Regulatory and Pricing Pressures
The biosimilars market faces ongoing regulatory and pricing pressures, especially as governments and payers negotiate for deeper discounts. While this supports greater patient access, it can erode profit margins and make market entry less attractive for new players. Navigating diverse regulatory requirements across regions adds complexity, requiring companies to invest in compliance and local market strategies to ensure long-term success.
Regional Analysis
North America
North America leads the biosimilars treatment market, accounting for approximately 34% of global revenue in 2024. The market expanded from USD 6,271.11 million in 2018 to USD 9,618.43 million in 2024 and is projected to reach USD 16,838.53 million by 2032, with a CAGR of 7.3%. Growth is driven by strong healthcare infrastructure, early adoption of biosimilars, and favorable reimbursement policies. The U.S. and Canada continue to promote biosimilar uptake through regulatory clarity and physician education, further strengthening the region’s leadership position.
Europe
Europe captures nearly 28% of the global biosimilars treatment market in 2024, rising from USD 4,896.20 million in 2018 to USD 7,806.28 million in 2024 and expected to reach USD 14,394.39 million by 2032, with a CAGR of 8.0%. The region benefits from robust biosimilar regulatory frameworks and strong support from national healthcare systems. Widespread physician and patient acceptance, combined with effective cost-containment strategies, drive market growth. Countries such as Germany, the UK, and France are key contributors to regional dominance and adoption rates.
Asia Pacific
Asia Pacific holds a market share of 21% in 2024, growing from USD 3,712.80 million in 2018 to USD 6,062.48 million in 2024 and projected to reach USD 11,516.53 million by 2032, at a CAGR of 8.4%. Expansion is fueled by increasing prevalence of chronic diseases, rapidly improving healthcare access, and rising government initiatives for biosimilar integration. Major markets including China, India, and South Korea are investing heavily in biosimilar R&D, making Asia Pacific a vital region for future market growth and innovation.
Latin America
Latin America represents 7% of the biosimilars treatment market in 2024, with values rising from USD 1,445.37 million in 2018 to USD 2,106.96 million in 2024 and forecasted to reach USD 3,418.73 million by 2032, at a CAGR of 6.3%. The market’s growth is supported by an increasing demand for affordable therapies and expanding public healthcare initiatives. Brazil and Mexico remain the leading markets, driving regional adoption through regulatory advancements and government procurement programs that encourage biosimilar utilization.
Middle East
The Middle East accounts for approximately 7% market share in 2024, up from USD 1,284.58 million in 2018 to USD 1,995.75 million in 2024 and expected to reach USD 3,556.50 million by 2032, posting a CAGR of 7.5%. The region’s market expansion is attributed to growing investments in healthcare infrastructure and a rising focus on chronic disease management. Efforts to diversify healthcare offerings and increase access to affordable biologic therapies underpin demand for biosimilars, with countries like Saudi Arabia and the UAE at the forefront.
Africa
Africa holds a 3% market share in the global biosimilars treatment market in 2024, growing from USD 457.10 million in 2018 to USD 718.63 million in 2024 and projected to reach USD 1,301.16 million by 2032, at a CAGR of 7.7%. Growth is driven by rising awareness, improving diagnostic capabilities, and expanding access to essential medicines. While biosimilar adoption remains at an early stage, targeted investments and international collaborations are supporting market entry and helping address significant unmet medical needs across the continent.
Market Segmentations:
By Product:
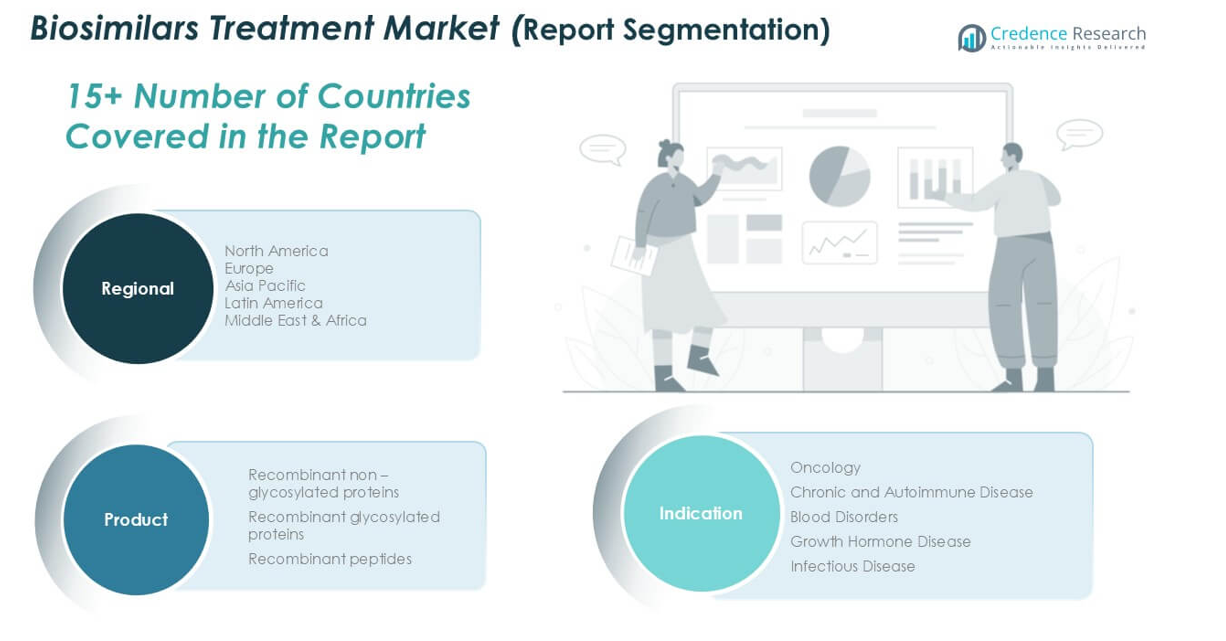
- Recombinant non-glycosylated proteins
- Recombinant glycosylated proteins
- Recombinant peptides
By Application:
- Oncology
- Chronic and Autoimmune Disease
- Blood Disorders
- Growth Hormone Disease
- Infectious Disease
By Geography:
- North America
- U.S.
- Canada
- Mexico
- Europe
- Germany
- France
- U.K.
- Italy
- Spain
- Rest of Europe
- Asia Pacific
- China
- Japan
- India
- South Korea
- South-east Asia
- Rest of Asia Pacific
- Latin America
- Brazil
- Argentina
- Rest of Latin America
- Middle East & Africa
- GCC Countries
- South Africa
- Rest of the Middle East and Africa
Competitive Landscape
The competitive landscape of the biosimilars treatment market is characterized by the presence of several leading global pharmaceutical companies and specialized biopharma firms, each striving to strengthen their market positions through innovation, expansion, and partnerships. Key players such as Pfizer, Sandoz International GmbH, Teva Pharmaceutical Industries Limited, Amgen, Biocon, Dr. Reddy’s Laboratories, F. Hoffman – La Roche, Celltrion, Eli Lilly and Company, and Samsung Bioepis actively invest in advanced R&D capabilities to develop high-quality biosimilar products that meet evolving regulatory standards. Strategic collaborations, licensing agreements, and co-development partnerships are frequently employed to access new markets and accelerate product launches. Companies compete on pricing, product differentiation, and robust clinical data to gain physician and payer confidence. Continuous portfolio diversification, geographic expansion, and emphasis on operational efficiency further define the competitive dynamics, while ongoing regulatory approvals and patent expirations create new opportunities for both established and emerging market participants.
Key Player Analysis
- Pfizer, Inc.
- Sandoz International GmbH
- Teva Pharmaceutical Industries Limited
- Amgen Inc.
- Biocon
- Dr. Reddy’s Laboratories
- F. Hoffman – La Roche Ltd.
- Celltrion, Inc.
- Eli Lilly and Company
- Samsung Bioepis
Recent Developments
- In June 2025, Dr. Reddy’s Laboratories announced a strategic partnership with Alvotech to co-develop, manufacture, and commercialize a biosimilar referencing Keytruda (pembrolizumab), a leading immuno-oncology drug. This collaboration targets global markets and aims to improve access to critical cancer therapies as Keytruda approaches patent expiry.
- In June 2025, Samsung Bioepis partnered with NIPRO Corporation in Japan to commercialize multiple biosimilar products, including SB17 (a biosimilar to Janssen's Stelara). This agreement marks Samsung Bioepis's first foray into the Japanese market with a local partner.
- In March 2025, Dr. Reddy’s entered commercialization and license agreements with Bio-Thera Solutions for BAT2206 (a proposed Stelara® biosimilar) and BAT2506 (a proposed Simponi® biosimilar) for Southeast Asia. Bio-Thera will handle development and manufacturing, while Dr. Reddy’s will seek regulatory approvals and manage commercialization.
- In February 2025, Sandoz launched Pyzchiva® (ustekinumab-ttwe), a biosimilar to Stelara®, in the US, expanding treatment options for chronic inflammatory diseases such as psoriasis and psoriatic arthritis for approximately 12 million patients. Pyzchiva® offers a full suite of dosing options and extended stability compared to the reference medicine.
Market Concentration & Characteristics
The biosimilars treatment market displays moderate to high concentration, with a select group of multinational pharmaceutical companies accounting for a significant share of global revenue. It is characterized by a high barrier to entry, driven by the technical complexity of biosimilar development, stringent regulatory requirements, and substantial investment in research, clinical trials, and manufacturing infrastructure. Companies that succeed in this market possess advanced biotechnology capabilities, robust intellectual property strategies, and the resources to navigate multi-phase approval pathways. The market emphasizes product quality, clinical comparability, and pharmacovigilance, with leading players prioritizing portfolio diversification and strategic alliances to expand reach and accelerate market access. Competitive differentiation relies on price competitiveness, demonstrated therapeutic equivalence, and strong relationships with payers and healthcare providers. Regional variations in regulatory acceptance, reimbursement policies, and healthcare infrastructure shape competitive intensity and adoption rates. The biosimilars treatment market is evolving rapidly as new molecules enter commercialization and healthcare systems increasingly integrate cost-effective biosimilar therapies.
Report Coverage
The research report offers an in-depth analysis based on Product, Application, and Geography. It details leading market players, providing an overview of their business, product offerings, investments, revenue streams, and key applications. Additionally, the report includes insights into the competitive environment, SWOT analysis, current market trends, as well as the primary drivers and constraints. Furthermore, it discusses various factors that have driven market expansion in recent years. The report also explores market dynamics, regulatory scenarios, and technological advancements that are shaping the industry. It assesses the impact of external factors and global economic changes on market growth. Lastly, it provides strategic recommendations for new entrants and established companies to navigate the complexities of the market.
Future Outlook
- Biosimilar pipelines will expand with more oncology and autoimmune indications reaching completion.
- Manufacturers will integrate advanced analytics and digital tools to streamline development and ensure quality.
- Regulatory frameworks will evolve toward faster approvals and clearer guidance for interchangeability.
- Strategic partnerships will increase between biotech firms and regional companies to accelerate market entry.
- Emerging markets in Asia and Latin America will amplify biosimilar uptake through cost-effective alternatives.
- Healthcare payers will implement stronger incentives to promote biosimilar adoption.
- Physicians will gain confidence in biosimilars through enhanced education and real-world evidence.
- Supply chain investments will enhance manufacturing scalability and distribution reliability.
- Biosimilar pricing competition will intensify, driving down treatment costs.
- Patient access to biologic therapies will widen as healthcare systems embrace biosimilars.
Request a Free Sample
Fill in your details and we'll send you a free sample report.
- Sample data tables & charts
- Research methodology
Need a Custom Version of This Report?
Tailor the scope, geography, or segments to your exact requirements.
- Custom geography or segment scope
- Direct access to our analyst team
Frequently Asked Questions
What is the current size of the Biosimilars Treatment Market?
What are the key segments within the Biosimilars Treatment Market?
What are some challenges faced by the Biosimilars Treatment Market?
Who are the major players in the Biosimilars Treatment Market?
Table of Content
Chapter 1. Report Introduction
- 1.1 Report Description & Purpose
- 1.1.1 Report Title & Market Definition
- 1.1.2 Unique Selling Propositions (USP) & Key Differentiators
- 1.1.3 Value Proposition for Stakeholders
- 1.2 Research Objectives
- 1.2.1 Market Sizing Objectives (Volume & Revenue)
- 1.2.2 Segmentation Objectives
- 1.2.3 Competitive Intelligence Objectives
- 1.2.4 Forecast & Scenario Objectives
- 1.3 Report Scope
- 1.3.1 Biosimilars Treatment Scope – Types & Subtypes Covered
- 1.3.2 Geographic Scope – Regions & Countries Covered
- 1.3.3 Historical Period, Base Year & Forecast Period (2024; forecast to 2032)
- 1.3.4 Inclusions & Exclusions
- 1.4 HS Code & Classification Framework
- 1.5 Currency, Units & Pricing Basis
- 1.6 Target Stakeholders
- 1.7 Limitations & Assumptions
Chapter 2. Executive Summary
- 2.1 Global Biosimilars Treatment Market Snapshot
- 2.1.1 Market Size – Historical (2024) & Forecast (2024-2032) (2024: USD 28,308.5 million → 2032: USD 51,025.8 million)
- 2.1.2 Volume & Revenue – Global Totals
- 2.1.3 Key Market Highlights – Top Five Facts
- 2.2 Biosimilars Treatment Market Segmentation Snapshot
- 2.2.1 Market Split by Region – 2024 vs. 2032
- 2.3 Competitive Snapshot
- 2.3.1 Top 10 Players by Revenue Share – 2024
- 2.3.2 Top 10 Players by Volume Share – 2024
- 2.3.3 Recent Strategic Developments (18-Month Summary)
- 2.4 Key Investment Highlights & Strategic Conclusions
Chapter 3. Biosimilars Treatment Market Dynamics & Industry Analysis
- 3.1 Market Overview & Context
- 3.1.1 Biosimilars Treatment Market Position in the Broader Automotive Value Chain
- 3.1.2 OEM vs. Replacement Market Dynamics
- 3.1.3 Market Maturity & Development Stage by Region
- 3.2 Biosimilars Treatment Market Drivers
- 3.3 Biosimilars Treatment Market Restraints & Challenges
- 3.4 Biosimilars Treatment Market Opportunities
- 3.5 Porter's Five Forces Analysis
- 3.5.1 Threat of New Entrants
- 3.5.2 Bargaining Power of Suppliers
- 3.5.3 Bargaining Power of Buyers
- 3.5.4 Threat of Substitutes
- 3.5.5 Competitive Rivalry – Intensity Assessment
- 3.6 Biosimilars Treatment Value Chain Analysis
- 3.6.1 Upstream – Raw Material/Input Suppliers
- 3.6.1.1 Raw Material/Input 1
- 3.6.1.2 Raw Material/Input 2
- 3.6.1.3 Raw Material/Input 3
- 3.6.2 Midstream – Production/Manufacturing/Service Delivery
- 3.6.2.1 Production/Process Overview
- 3.6.2.2 Key Facility Locations & Capacity by Manufacturer
- 3.6.3 Downstream – Distribution & End Consumer
- 3.6.3.1 Primary Channel – B2B/OEM
- 3.6.3.2 Secondary Channels – Dealer, Retail, Online, Direct
- 3.6.4 Value Chain Profitability Analysis
- 3.6.1 Upstream – Raw Material/Input Suppliers
- 3.7 PESTEL Analysis
- 3.7.1 Political Factors
- 3.7.2 Economic Factors
- 3.7.3 Social Factors
- 3.7.4 Technological Factors
- 3.7.5 Environmental Factors
- 3.7.6 Legal Factors
- 3.8 Biosimilars Treatment Supply Chain Analysis
- 3.8.1 Raw Material/Input Supply Risk Assessment
- 3.8.2 Manufacturing Concentration Risk (Geographic Exposure)
- 3.8.3 Trade Disruption Impact Analysis
- 3.9 Regulatory & Policy Landscape
Note: The regulatory and policy landscape section covers regulations based on their applicability to the market, Biosimilars Treatment category, geography, and scope of the study. Only regulatory frameworks with a material impact on operations, compliance, trade, sustainability, or market access are analyzed in detail.
Chapter 4. Key Investment Pockets & Opportunity Analysis
- 4.1 Biosimilars Treatment Market Attractiveness Analysis
- 4.1.1 By Region – Investment Attractiveness Matrix (Volume × CAGR)
- 4.2 Absolute Revenue Growth Opportunity
- 4.2.1 By Region – Absolute USD Growth Through 2032
- 4.3 Incremental Volume Opportunity
- 4.3.1 By Region – Incremental Volume Through 2032
- 4.3.2 Segment – Incremental Volume
- 4.4 Emerging Submarket Opportunity Deep Dive (Subject to Applicability)
- 4.5 Emerging Market Opportunity Scorecards
- 4.5.1 United States
- 4.5.2 Europe
- 4.5.3 Asia
- 4.5.4 Middle East & Africa
Note: Emerging Market Opportunity Scorecards will be included based on relevance and strategic importance. Regions listed are indicative and may vary depending on data availability and market dynamics.
Chapter 5. Biosimilars Treatment Import-Export Analysis & Trade Flows
- 5.1 Global Trade Overview
- 5.1.1 Global Export Value by Country (2024)
- 5.1.2 Global Export Volume by Country (2024)
- 5.1.3 Global Import Value by Country (2024)
- 5.1.4 Global Import Volume by Country (2024)
- 5.1.5 Net Trade Balance by Country (2024)
- 5.2 Export Analysis – Segment
- 5.2.1 Type 1 (HS Code)
- 5.2.2 Type 2 (HS Code)
- 5.2.3 Type 3 (HS Code)
- 5.2.4 Type 4 (HS Code)
- 5.2.5 Type 5 (HS Code)
- 5.3 Import Analysis – Segment
- 5.3.1 Type 1 (HS Code)
- 5.3.2 Type 2 (HS Code)
- 5.3.3 Type 3 (HS Code)
- 5.3.4 Type 4 (HS Code)
- 5.3.5 Type 5 (HS Code)
- 5.4 Average Unit Trade Prices
- 5.4.1 Average Export Price – Segment & Country
- 5.4.2 Average Import Price – Segment & Source Country
- 5.4.3 Price Trends (2024)
- 5.5 Key Trade Route Analysis
- 5.5.1 Trade Route 1
- 5.5.2 Trade Route 2
- 5.5.3 Trade Route 3
- 5.5.4 Trade Route 4
- 5.5.5 Trade Route 5
- 5.6 Trade Policy Impact Assessment
- 5.6.1 US Anti-Dumping & Section 301 Tariffs
- 5.6.2 EU Customs Union Impact
- 5.6.3 Major Free Trade Agreements
- 5.6.4 USMCA Rules of Origin
Note: Trade policy analysis will be included only where relevant to the Biosimilars Treatment market.
Chapter 6. Competitive Landscape & Company Benchmarking
- 6.1 Biosimilars Treatment Market Concentration & Structure
- 6.1.1 Herfindahl-Hirschman Index (HHI) – vs. 2024
- 6.1.2 Tier 1, Tier 2 & Tier 3 Market Structure
- 6.1.3 Global, Regional & Local Player Dynamics
- 6.2 Biosimilars Treatment Market Share Analysis – 2024
- 6.2.1 Global Revenue Share by Company
- 6.2.2 Global Volume Share by Company
- 6.2.3 Regional Revenue Share
- 6.2.4 Market Share Evolution ( vs. 2024)
- 6.2.5 OEM Segment Share by Company
- 6.2.6 Replacement Segment Share by Company
- 6.3 Production/Delivery Capacity & Facility Analysis
- 6.3.1 Global Installed Capacity
- 6.3.2 Capacity Utilization Rates
- 6.3.3 Production/Output Volume
- 6.3.4 Facility Locations & Capacity Map
- 6.3.5 Planned Capacity Additions
- 6.4 Biosimilars Treatment Competitive Benchmarking Matrix
- 6.4.1 Revenue, Volume, CAGR & Profitability Comparison
- 6.4.2 Channel Revenue Mix
- 6.4.3 Geographic Revenue Exposure
- 6.4.4 R&D Intensity
- 6.4.5 Sustainability Maturity
- 6.5 Strategic Developments in Biosimilars Treatment (Last 24 Months)
- 6.5.1 Mergers, Acquisitions & Divestments
- 6.5.2 New Biosimilars Treatment Launches
- 6.5.3 Facility Expansions
- 6.5.4 Strategic Alliances, Joint Ventures & Partnerships
- 6.5.5 Distribution Expansion & Market Entry
- 6.5.6 Sustainability & ESG Initiatives
- 6.6 Competitive Strategy Mapping
- 6.6.1 Leader, Challenger, Follower & Niche Classification
- 6.6.2 Pricing Strategy Comparison
- 6.6.3 Channel Strategy Matrix
Note: Strategic developments are included based on their materiality and the availability of reliable information.
Chapter 7. Global Biosimilars Treatment Market – By Distribution Channel
- 7.1 Segment Overview
- 7.1.1 Volume & Revenue Split by Channel (2024 & 2032)
- 7.1.2 Channel Mix Evolution (2024-2032)
Chapter 8. Regional Market Analysis – Global Overview
- 8.1 Global Regional Overview
- 8.1.1 Regional Volume Share
- 8.1.2 Regional Revenue Share
- 8.1.3 Regional Volume by Region
- 8.1.4 Regional Revenue by Region
- 8.1.5 Regional Forecast Through 2032
- 8.2 Cross-Regional Segment Analysis
- 8.2.1 By Distribution Channel
- 8.2.2 By Brand/Price Tier
Chapter 9. North America Biosimilars Treatment Market
- 9.1 United States
- 9.2 Canada
- 9.3 Mexico
Chapter 10. Europe Biosimilars Treatment Market
- 10.1 Germany
- 10.2 France
- 10.3 Italy
- 10.4 United Kingdom
- 10.5 Spain
- 10.6 Poland
- 10.7 Russia
- 10.8 Netherlands
- 10.9 Belgium
- 10.10 Sweden
- 10.11 Denmark
- 10.12 Norway
- 10.13 Rest of Europe
Chapter 11. Asia Pacific Biosimilars Treatment Market
- 11.1 China
- 11.2 India
- 11.3 Japan
- 11.4 South Korea
- 11.5 Thailand
- 11.6 Indonesia
- 11.7 Vietnam
- 11.8 Malaysia
- 11.9 Australia
- 11.10 Rest of Asia Pacific
Chapter 12. Latin America Biosimilars Treatment Market
- 12.1 Brazil
- 12.2 Argentina
- 12.3 Colombia
- 12.4 Chile
- 12.5 Rest of Latin America
Chapter 13. Middle East Biosimilars Treatment Market
- 13.1 Saudi Arabia
- 13.2 United Arab Emirates
- 13.3 Turkey
- 13.4 Israel
- 13.5 Iran
- 13.6 Rest of the Middle East
Chapter 14. Africa Biosimilars Treatment Market
- 14.1 South Africa
- 14.2 Egypt
- 14.3 Nigeria
- 14.4 Morocco
- 14.5 Rest of Africa
Chapter 15. Biosimilars Treatment Company Profiles
- 15.1 [Company 01]
- 15.1.1 Company Overview
- 15.1.2 Key Management Personnel
- 15.1.3 Products & Services Portfolio
- 15.1.4 Financial Performance
- 15.1.5 Key Market Focus & Geographic Presence
- 15.1.6 Recent Developments & Strategic Initiatives
Note: The company profile list is preliminary and may change based on research findings, market developments, data availability, and client requirements.
Chapter 16. Appendices
- Appendix A – List of Abbreviations & Acronyms
- Appendix B – Industry Classification Code Reference – Full Series
- Appendix C – Production & Capacity Data Tables
- Appendix D – End-Use & Demand Base Tables
- Appendix E – Consumption & Replacement Rate Assumptions
- Appendix F – ASP Reference Tables
- Appendix G – Manufacturing & Facility Database
- Appendix H – Import-Export Data Tables
- Appendix I – Regulatory Summary Tables
- Appendix J – Primary Research Participant List (Anonymized)
- Appendix K – Primary Research Questionnaire Framework
- Appendix L – Data Sources & Bibliography
- Appendix M – Market Size Divergence & Source Comparison
Chapter 17. Research Methodology
- 17.1 Research Framework & Philosophy
- 17.2 Secondary Research – Sources, Hierarchy & Data Extraction
- 17.3 Data Modeling – Bottom-Up & Top-Down Market Sizing
- 17.4 Primary Research – Stakeholder Framework, LOI & Sample Sizes
- 17.5 Forecast Methodology – Regression, Scenario & Sensitivity Analysis
- 17.6 Quality Control – Four-Layer Validation Framework
- 17.7 Limitations & Standard Assumptions
- 17.8 Disclaimer
