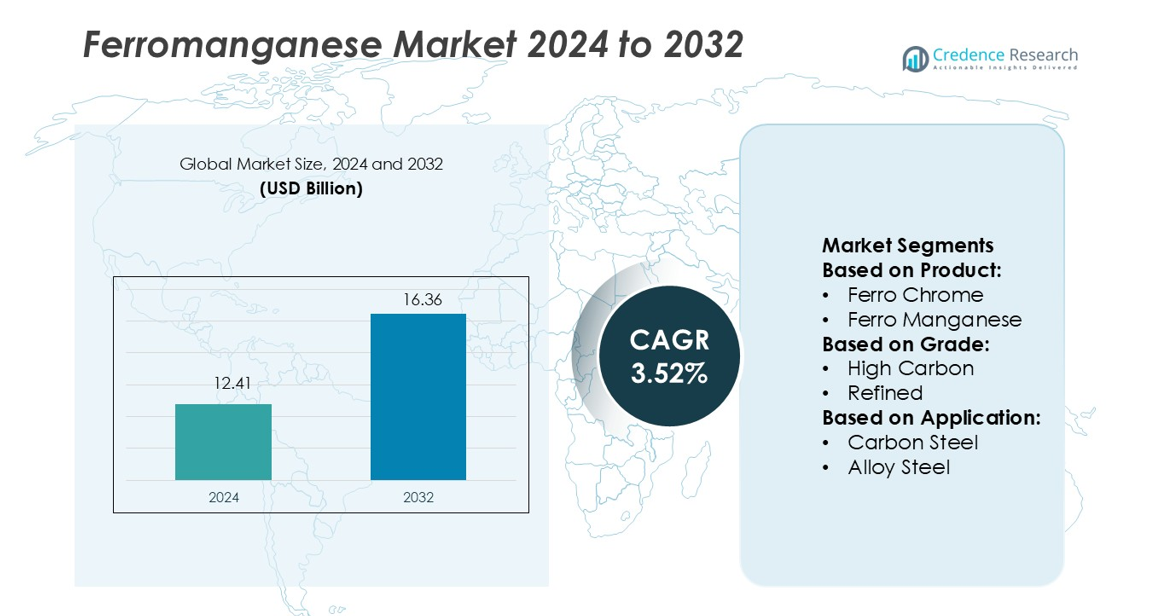
Home » Mining, Minerals and Metals » Ferromanganese Market

Ferromanganese Market By Type (High Carbon, Medium Carbon, Low Carbon); By Application (Steel Production, Foundry, Welding Fluxes, Chemical Industry, Others); By End-Use Industry (Steel, Non-ferrous Metals, Chemicals, Others); By Method of Production (Blast Furnace, Electric Arc Furnace); By Distribution Channel (Direct Sales, Indirect Sales); By Region – Growth, Share, Opportunities & Competitive Analysis, 2024 – 2032

Price: $4999

Published: | Report ID: 6262 | Report Format : PDF
REPORT ATTRIBUTE DETAILS
Historical Period  2019-2022
Base Year  2023
Forecast Period  2024-2032
Ferromanganese Market Size 2023  USD 72154.2  Million
Ferromanganese Market, CAGR  5.20%
Ferromanganese Market Size 2032  USD 113868.41 Million

Market Insights

  • The global market for ferromanganese is expected to grow from its estimated USD 72154.2 million in 2023 to USD 113868.41 million in 2032 at a compound annual growth rate (CAGR) of 5.20% between 2024 and 2032.
  • The largest category is high-carbon ferromanganese. On the other hand, medium-carbon ferromanganese is expected to grow at a strong CAGR.
  • The leading application segment is steel production.
  • The CAGR for steel is expected to be the highest during the projection period.
  • The electric arc furnace will probably have the highest CAGR throughout the prediction period.
  • The direct sales channel is estimated to have the greatest CAGR during the forecast period.
  • North America dominated the ferromanganese market.
  • Regarding the market share of ferromanganese, Europe is expected to come second.
  • In the ferromanganese market, Asia Pacific is anticipated to grow fastest.
  • Ferromanganese consumption is directly correlated with the expansion of the steel sector, and the primary drivers of market development are infrastructure growth and construction projects, which raise steel demand.
  • The ferromanganese industry is showing potential due to advancements in manufacturing techniques that can improve productivity and product quality and the expansion of renewable energy sources.

Ferromanganese Market

Design Element 2

Access crucial information at unmatched prices!

Request your free sample report today & start making informed decisions powered by Credence Research!

Download Free Sample
CTA Design Element 3

Executive Summary

Market Definition

The manufacture, distribution, and utilization of ferromanganese alloys globally are all part of the global business activity and commerce known as the ferromanganese market. Integrating iron and manganese with different amounts of carbon and other components, ferromanganese is a necessary alloy. In order to provide the finished steel product desirable qualities, it is mainly utilised as a deoxidizer and alloying agent.

Market Overview

The ferromanganese sector is estimated to develop at a 5.20% compound annual growth rate (CAGR) between 2024 and 2032, maintaining its current upward trend. The market will keep developing, rising from its estimated value of USD 72154.2 million in 2023 to USD 113868.41 million in 2032.

Manganese ores are carbothermically smelted and reduced in blast and submerged arc furnaces to produce FeMn for commercial use. The primary solid carbon reductant utilized in SAF technology is metallurgical coke. But compared to metallurgical coke, natural gas—abundant in methane—is a more environmentally friendly substitute reductant for manufacturing metals and ferromanganese.

The concept of sustainable growth is advancing with the use of natural gas in place of solid carbon. The technique is an integrated duplex one in which magnesium oxide (MnO) from a coexisting molten slag that is formed from the smelting of Mn ore is reduced by the injection of natural gas into molten FeMn, generating hydrogen and carbon. Due to its approximately 40% fewer CO2 emissions and 50% lower electric energy utilisation when compared to SAF, the duplex process is therefore thought to be the most green method. The ferromanganese market will expand more rapidly as a result of this development.

Segmentation by Type

  • High-carbon ferromanganese is the market leader by type. In producing steel, high-carbon ferromanganese works well as a deoxidizing agent. By assisting in removing oxygen from molten steel, it helps avoid the creation of unwanted oxides that could lower the quality of the finished product.
  • The medium carbon ferromanganese category will exhibit a sizable CAGR during the projected period. In foundries and casting applications where regulated concentrations of carbon and other alloying components are necessary, medium carbon ferromanganese is used. In castings and forgings, it aids in achieving the appropriate metallurgical qualities.
  • The need for ferromanganese is additionally supported by other ferromanganese, including low-carbon ferromanganese.

Segmentation by Application

  • The main application is steel production. Steel is an essential piece of ships because of its strength and capabilities to withstand corrosion. The demand from these industries is influenced by the usage of steel in the aerospace industry’s aircraft production.
  • The chemical industry category will likely register a significant CAGR during forecasting. In chemical research and development, manganese compounds may be utilized. Demand may be indirectly impacted by possible uses for manganese that result from the chemical industry’s research and development of new materials and compounds.
  • Other applications, such as foundry and welding fluxes, also contribute to the demand for ferromanganese.

Segmentation by End-Use Industry

  • It is projected that over the projection period, the category of steel will grow at the fastest rate. Because steel is durable and heat-resistant, it is utilized to make appliances for homes, such as stoves, refrigerators, and washing machines.
  • The need for ferromanganese is also influenced by other end-use industries, including non-ferrous metals, chemicals, and others.

Segmentation by Method of Production

  • The electric arc furnace category will likely have the highest CAGR during the projection period. Ferromanganese is frequently produced in electric arc furnaces or EAFs. Iron (Fe) and manganese (Mn) merge to form ferromanganese, an alloy normally produced by smelting the metal in an electric arc furnace.
  • Other production methods, such as blast furnaces, also contribute to the demand for ferromanganese.

Segmentation by Distribution Channel

  • Direct sales channels will be expected to have the foremost CAGR during the prediction period. In the steel business, end users frequently have particular requirements for alloy and quality. The capacity of ferromanganese producers to achieve these specifications, which include exact alloy compositions and other quality factors, may have an impact on direct sales demand.
  • Other distribution channels, such as indirect sales (distributors, traders), also contribute to the demand for ferromanganese.

Segmentation by Region

  • North America leads the ferromanganese industry. The manufacture and usage of ferromanganese may be impacted by strict environmental restrictions in North America, which could increase demand for more environmentally friendly options.
  • Europe is estimated to rank second in market size for ferromanganese.
  • Asia Pacific will witness the most rapid growth of the ferromanganese market.
  • The remaining requirement for ferromanganese is covered by regions of the world such as Africa, the Middle East, and Latin America.

The sector sees a consolidation trend as larger businesses buy out smaller rivals to expand their market share and boost output. Numerous steel producers are investing in ferromanganese manufacturing plants in the hope to integrate backward and guarantee a consistent supply of this vital commodity.

Regarding forecasting, North America is likely to dominate the ferromanganese market. This is a result of how North America’s steel and stainless steel industries use their products. Because of rising purchasing power and quick industrialization, steel is utilized in both residential and commercial buildings. Additionally, this market is projected to expand as a result of the growing demand for stainless steel in a variety of applications, such as consumer goods, food and beverage apparatus, and ornamental and structural automobile components.

Throughout the forecast, the ferromanganese market in Asia-Pacific is anticipated to expand fastest. The biggest countries that produce manganese alloys, including China, Japan, and India, are responsible for the area’s development as the steel sector requires more and more manganese alloys in the region. The region’s expanding infrastructure and quick urbanisation require the heavy usage of certain alloying materials, including steel, in building.

Market expansion in Europe is anticipated to be triggered by the use of steel in the auto industry. The COVID-19 epidemic was restricting imports from China, which was making manufacturing of steel in the area difficult. Because forging and pressing are widely utilized in the automotive industry, the steel produced is appropriate for these procedures. Similar to the steel industry, which has been experiencing a spike in demand as a result of the rising popularity of electric automobiles, the market for FeMn is expected to rise dramatically.

Key Highlights of the Report

The global ferromanganese market is segmented by type, application, end-use industry, method of production, distribution channel, and region. As far as the type of ferromanganese is concerned, high-carbon ferromanganese is the market spearhead. Steel production is the top application segment. The steel industry category is anticipated to increase at the highest CAGR throughout the projection period. The electric arc furnace method will experience the highest CAGR during the forecast period. Ferromanganese is expanding mostly in North America.

Recycling of metals has become more of a priority due to the focus on sustainable practices and resource conservation. Because recovered alloys reduce the requirement for primary raw materials in the steel manufacturing procedure, ferromanganese, being a recyclable material, benefits from such campaigns. A few significant participants in the ferromanganese market are implementing a vertical integration approach by acquiring mining companies that produce manganese. As a result, there is less reliance on outside sources and a more steady supply of raw materials.

North America is expected to account for the largest portion of the ferromanganese market globally. The area’s ferromanganese sector continues to grow steadily, mostly due to the availability of well-established steel production facilities and ongoing infrastructure-building initiatives. The Asia Pacific region is also assumed to have the market’s sharpest growth. The rapid growth of infrastructure, urbanization, and industry in nations such as China and India adds to the growing requirement for ferromanganese. The region’s booming automobile sector contributes to market expansion as well.

Which Key Factors Are Driving The Global Ferromanganese Market?

The ferromanganese market is accelerated by the requirement for specialized applications by foundries, as well as the financial stability of steel-using sectors. These factors all contribute to the market’s continuous growth.

What are The Main Challenges Confronting The Ferromanganese Market Globally?

The ferromanganese industry has several obstacles to growth, including difficulties with quality control, a delayed adoption rate of sustainable practices, speculative trading activity, and price instability.

What Market Opportunities Exist For Ferromanganese Globally?

The steel demand is triggered by government spending on infrastructure projects, and the expansion of steel recycling influences the need for new steel production, contributing to ferromanganese’s growing popularity.

Market Drivers

Multiple factors propel the ferromanganese industry across the globe. The primary factors propelling the global ferromanganese market are as follows:

Expanding Need in the Construction Sector for Stainless Steel

Ferromanganese-containing stainless steel is renowned for having superior corrosion resistance. Stainless steel becomes essential in building applications where exposure to corrosive environments or harsh weather is frequent. Due to this, ferromanganese is in tremendous demand as an alloying element. Because of its lifespan and resilience, stainless steel is prized in the construction industry. Stainless steel structures, such as facades, bridges, and architectural elements, need durable materials. Stainless steel gains strength and resilience from ferromanganese, which makes it appropriate for long-term building projects. Stainless steel’s appealing look makes it an increasingly prevalent material for architecture. Ferromanganese supports the alloy take on a variety of shapes and forms, which enables designers and architects to produce visually appealing and revolutionary buildings.

Market Restraints

There are several obstacles that the global ferromanganese market must overcome to continue growing. Among them are the following:

Supply Fluctuations for Manganese Ore

The most important component in the manufacturing of ferromanganese, an alloy made of iron and manganese, is manganese ore. The capacity of producers of ferromanganese to meet demand is immediately impacted by any interruptions in the manganese ore supply. If a supplier only gets its manganese ore from one or a small number of resources, there may be a greater chance of supply chain disruption. In numerous nations, there are distinct rules and procedures governing the mining of manganese ore. Regulations that change permits that take longer to get or environmental standards that are more stringent can all cause disturbances to mining operations and make it more challenging for ferromanganese manufacturers to consistently provide manganese ore.

Opportunities

There are plenty of potential prospects in the global ferromanganese industry. Among these are the following:

Technological Developments in the Manufacturing of Ferromanganese

Cost-cutting and increased process efficiency are two common goals of technological manufacturing advancements. This may mean developing more sophisticated smelting techniques, devising more successful extraction plans, or making better use of energy. Innovations may seek to create greener and more sustainable production techniques when sustainability and environmental issues gain greater attention. Developing technologies that lower energy, waste, or pollution levels may increase the appeal of producing ferromanganese. Bettering the quality and purity of ferromanganese goods could be the main goal of technological advancements. This could entail optimizing procedures to attain improved grades, adhering to certain industry norms, and satisfying a range of end-user needs. These factors create opportunities for the global ferromanganese market.

Competitive Landscape

Shape Your Report to Specific Countries or Regions & Enjoy 30% Off!

Key Players

There are several major competitors in the fiercely competitive global ferromanganese market. The followings are a few of the leading market participants and their market shares:

  • Monnet Group (New Delhi, India)
  • Maithan Alloys Limited (Kolkata, India)
  • Tata Steel (Mumbai, India)
  • Gulf Manganese Corporation Limited (Perth, Western Australia)
  • Vale (Rio de Janeiro, Brazil)
  • Ferroglobe (London, UK)
  • OM Holdings Ltd. (Singapore)
  • South32 (Perth, Western Australia)
  • Nippon Denko (Tokyo, Japan)
  • Others

To remain competitive, these companies prioritize product innovation, distribution channel expansion, mergers, and acquisitions.

The largest suppliers in the global ferromanganese market continuously work to keep one step beyond the competition by developing innovative concepts and products.

In September 2022, The Indian company SAL Steel, known for fabricating stainless steel (SS) products, stepped into a non-exclusive agreement with AIA Engineering (AIA). AIA is an Indian company that manufactures, designs, develops, installs, and provides services for high chromium wear, corrosion, and abrasion-resistant castings. By strengthening their respective positions in the markets for high chromium castings and stainless steel, the two businesses hope to provide their clients with superior goods and services.

In June 2022, Rohit Ferro-Tech Ltd. was purchased by India’s Tata Steel Mining Ltd. for an unknown amount. Tata’s portfolio is expanded, diversified, and enhanced by this acquisition, which doubles its ferrochrome manufacturing capacity to 900,000 metric tonnes annually. Ferroalloy manufacturer Rohit Ferro-Tech Ltd. is situated in India and serves the ferro manganese market.

Summary of Key Findings

  • Continuous research and development might result in the creation of novel ferromanganese uses, which supports market expansion.
  • The market is segmented by type, application, end-use industry, method of production, distribution channel, and region.
  • The most popular type of ferromanganese in the market is a high-carbon ferromanganese.
  • Steel production is the foremost application category.
  • Regarding CAGR, electric arc furnaces are expected to grow the fastest during the forecast period.
  • The category for direct sales will likely see the highest CAGR during the anticipated time frame.
  • North America is leading market development; the market is highly competitive with key players including Monnet Group (New Delhi, India), Maithan Alloys Limited (Kolkata, India), Tata Steel (Mumbai, India), Gulf Manganese Corporation Limited (Perth, Western Australia), Vale (Rio de Janeiro, Brazil), Ferroglobe (London, UK), OM Holdings Ltd. (Singapore), South32 (Perth, Western Australia), Nippon Denko (Tokyo, Japan), and Others.

Future Outlook

  • The ferromanganese industry is expected to increase significantly in North America and has a positive outlook worldwide.
  • With the investment in steel capacity, ferromanganese is getting increasingly popular.
  • The limited acceptance of new technologies is one of the key factors predicted to constrain the growth of the ferromanganese market during the forecast timeframe.
  • To stay ahead of the competition, key enterprises must develop new products, expand their market reach, and keep their prices competitive.

How CXOs Can Benefit from the Credence Research Ferromanganese Market Report

CXOs may get a detailed picture of the market in the Credence Research Ferromanganese Market Report, which includes:

  • Market size and growth forecast: The report provides detailed estimates of the global ferromanganese market size, segmented by type, application, end-use industry, method of production, distribution channel, and region. It also includes forecasts for the market through 2032 based on key trends and drivers.
  • Market segmentation: The research report breaks down the market for ferromanganese into segments based on the type, application, end-use industry, method of production, distribution channel, and region. This segmentation provides CXOs with a granular understanding of the market and the opportunities in each segment.
  • Competitive landscape: The research report offers a detailed analysis of the major companies in the ferromanganese industry, including information on their business plans, line of products, and earnings. CXOs can use this information to evaluate and identify their competitors.
  • Key trends and drivers: The research report identifies and evaluates the main trends and factors influencing the market for ferromanganese. CXOs can use this information to make well-informed choices regarding their plans and investments.

CXOs can use the insights from the Credence Research Ferromanganese Market Report to:

  • Identify growth opportunities: With the help of this analysis, CXOs may identify new growth opportunities in the ferromanganese sector. For example, the report identifies the growing demand for ferromanganese from the chemical industry as a key opportunity.
  • Make informed investment decisions: With the help of the report, CXOs can choose ferromanganese wisely. For example, the research study provides information on the critical factors to consider while selecting ferromanganese solutions and evaluating ferromanganese suppliers.
  • Develop competitive strategies: The research report can be used by CXOs to develop competitive strategies for their ferromanganese businesses. For example, the research paper outlines the main strategies suppliers of ferromanganese utilize to differentiate themselves from competitors.
  • Track market developments: CXOs may stay ahead of the curve by tracking market developments with the aid of this research report. For instance, the research report offers insights into the most recent developments and trends in the market for ferromanganese.

In general, CXOs seeking to expand their industry knowledge and spot growth prospects will find the Credence Research Ferromanganese Market Report a useful tool.

Segmentation

  • By Type
    • High Carbon Ferromanganese
    • Medium Carbon Ferromanganese
    • Low Carbon Ferromanganese
  • By Application
    • Steel Production
    • Foundry
    • Welding Fluxes
    • Chemical Industry
    • Others
  • By End-Use Industry
    • Steel
    • Non-ferrous Metals
    • Chemicals
    • Others
  • By Method of Production
    • Blast Furnace
    • Electric Arc Furnace
  • By Distribution Channel
    • Direct Sales
    • Indirect Sales (Distributors, Traders)
  • By Region
    • North America
      • The U.S.
      • Canada
      • Mexico
    • Europe
      • Germany
      • France
      • The U.K.
      • Italy
      • Spain
      • Rest of Europe
    • Asia Pacific
      • China
      • Japan
      • India
      • South Korea
      • South-east Asia
      • Rest of Asia Pacific
    • Latin America
      • Brazil
      • Argentina
      • Rest of Latin America
    • Middle East & Africa
      • GCC Countries
      • South Africa
      • Rest of Middle East and Africa

Table of Content
1. Preface
1.1. Report Description
1.1.1. Purpose of the Report
1.1.2. Target Audience
1.1.3. USP and Key Offerings
1.2. Research Scope
1.3. Market Introduction
2. Executive Summary
2.1. Market Snapshot: Global Ferromanganese Market
2.1.1. Global Ferromanganese Market, By Type
2.1.2. Global Ferromanganese Market, By Application
2.1.3. Global Ferromanganese Market, By End-Use Industry
2.1.4. Global Ferromanganese Market, By Method of Production
2.1.5. Global Ferromanganese Market, By Distribution Channel
2.1.6. Global Ferromanganese Market, By Region
2.2. Insights from Primary Respondents
3. Market Dynamics & Factors Analysis
3.1. Introduction
3.1.1. Global Ferromanganese Market Value, 2019-2032, (US$ Mn)
3.1.2. Y-o-Y Growth Trend Analysis
3.2. Market Dynamics
3.2.1. Ferromanganese Market Drivers
3.2.2. Ferromanganese Market Restraints
3.2.3. Ferromanganese Market Opportunities
3.2.4. Major Ferromanganese Industry Challenges
3.3. Growth and Development Patterns
3.4. Investment Feasibility Analysis
3.5. Market Opportunity Analysis
3.5.1. Type
3.5.2. Application
3.5.3. End-Use Industry
3.5.4. Method of Production
3.5.5. Distribution Channel
3.5.6. Geography
4. Market Competitive Landscape Analysis
4.1. Company Market Share Analysis, 2023
4.1.1. Global Ferromanganese Market: Company Market Share, Value 2023
4.1.2. Global Ferromanganese Market: Top 6 Company Market Share, Value 2023
4.1.3. Global Ferromanganese Market: Top 3 Company Market Share, Value 2023
4.2. Global Ferromanganese Market: Company Revenue Share Analysis, 2023
4.3. Company Assessment Metrics, 2023
4.3.1. Stars
4.3.2. Emerging Leaders
4.3.3. Pervasive Players
4.3.4. Participants
4.4. Startups/ SMEs Assessment Metrics, 2023
4.4.1. Progressive Companies
4.4.2. Responsive Companies
4.4.3. Dynamic Companies
4.4.4. Starting Blocks
4.5. Strategic Development
4.5.1. Acquisition and Mergers
4.5.2. New Product Launch
4.5.3. Regional Expansion
4.5.4. Partnerships
4.6. Key Player Product Matrix
4.7. Potential for New Players in the Global Ferromanganese Market
5. Premium Insights
5.1. STAR (Situation, Task, Action, Results) Analysis
5.2. Porter’s Five Forces Analysis
5.2.1. Threat of New Entrants
5.2.2. Bargaining Power of Buyers/Consumers
5.2.3. Bargaining Power of Suppliers
5.2.4. Threat of Substitute Types
5.2.5. Intensity of Competitive Rivalry
5.3. PESTEL Analysis
5.3.1. Political Factors
5.3.2. Economic Factors
5.3.3. Social Factors
5.3.4. Technological Factors
5.3.5. Environmental Factors
5.3.6. Legal Factors
5.4. Key Distribution Channel
5.4.1. Demand Side Trends
5.4.2. Supply Side Trends
5.5. Value Chain Analysis
5.6. Technology Analysis
5.6.1. Research and development in the global market
5.6.2. Patent Analysis
5.6.3. Emerging technologies and their potential disruption to the market
5.7. Consumer Behaviour Analysis
5.7.1. Consumer Preferences and Expectations
5.7.2. Factors Influencing Consumer Buying Decisions
5.7.2.1. North America
5.7.2.2. Europe
5.7.2.3. Asia Pacific
5.7.2.4. Latin America
5.7.2.5. Middle East and Africa
5.7.3. Consumer Pain Points
5.8. Analysis and Recommendations
5.9. Adjacent Market Analysis
6. Market Positioning of Key Players, 2023
6.1. Company market share of key players, 2023
6.2. Competitive Benchmarking
6.3. Market Positioning of Key Vendors
6.4. Geographical Presence Analysis
6.5. Major Strategies Adopted by Key Players
6.5.1. Key Strategies Analysis
6.5.2. Mergers and Acquisitions
6.5.3. Partnerships
6.5.4. Product Launch
6.5.5. Geographical Expansion
6.5.6. Others
7. Impact Analysis of COVID 19 and Russia – Ukraine War on Ferromanganese Market
7.1. Ukraine-Russia War Impact
7.1.1. Uncertainty and Economic Instability
7.1.2. Supply chain disruptions
7.1.3. Regional market shifts
7.1.4. Shift in government priorities
7.2. COVID-19 Impact Analysis
7.2.1. Supply Chain Disruptions
7.2.2. Demand Fluctuations
7.2.3. Shift in Product Mix
7.2.4. Reduced Industrial Activity
7.2.5. Regional Impact Analysis
7.2.5.1. North America
7.2.5.2. Europe
7.2.5.3. Asia Pacific
7.2.5.4. Latin America
7.2.5.5. Middle East and Africa
8. Global Ferromanganese Market, By Type
8.1. Global Ferromanganese Market Overview, by Type
8.1.1. Global Ferromanganese Market Revenue Share, By Type, 2023 Vs 2032 (in %)
8.2. High Carbon Ferromanganese
8.2.1. Global Ferromanganese Market, By High Carbon Ferromanganese, By Region, 2019-2032 (US$ Mn)
8.2.2. Market Dynamics for High Carbon Ferromanganese
8.2.2.1. Drivers
8.2.2.2. Restraints
8.2.2.3. Opportunities
8.2.2.4. Trends
8.3. Medium Carbon Ferromanganese
8.3.1. Global Ferromanganese Market, By Medium Carbon Ferromanganese, By Region, 2019-2032 (US$ Mn)
8.3.2. Market Dynamics for Medium Carbon Ferromanganese
8.3.2.1. Drivers
8.3.2.2. Restraints
8.3.2.3. Opportunities
8.3.2.4. Trends
8.4. Low Carbon Ferromanganese
8.4.1. Global Ferromanganese Market, By Low Carbon Ferromanganese, By Region, 2019-2032 (US$ Mn)
8.4.2. Market Dynamics for Low Carbon Ferromanganese
8.4.2.1. Drivers
8.4.2.2. Restraints
8.4.2.3. Opportunities
8.4.2.4. Trends
9. Global Ferromanganese Market, By Application
9.1. Global Ferromanganese Market Overview, by Application
9.1.1. Global Ferromanganese Market Revenue Share, By Application, 2023 Vs 2032 (in %)
9.2. Steel Production
9.2.1. Global Ferromanganese Market, By Steel Production, By Region, 2019-2032 (US$ Mn)
9.2.2. Market Dynamics for Steel Production
9.2.2.1. Drivers
9.2.2.2. Restraints
9.2.2.3. Opportunities
9.2.2.4. Trends
9.3. Foundry
9.3.1. Global Ferromanganese Market, By Foundry, By Region, 2019-2032 (US$ Mn)
9.3.2. Market Dynamics for Foundry
9.3.2.1. Drivers
9.3.2.2. Restraints
9.3.2.3. Opportunities
9.3.2.4. Trends
9.4. Welding Fluxes
9.4.1. Global Ferromanganese Market, By Welding Fluxes, By Region, 2019-2032 (US$ Mn)
9.4.2. Market Dynamics for Welding Fluxes
9.4.2.1. Drivers
9.4.2.2. Restraints
9.4.2.3. Opportunities
9.4.2.4. Trends
9.5. Chemical Industry
9.5.1. Global Ferromanganese Market, By Chemical Industry, By Region, 2019-2032 (US$ Mn)
9.5.2. Market Dynamics for Chemical Industry
9.5.2.1. Drivers
9.5.2.2. Restraints
9.5.2.3. Opportunities
9.5.2.4. Trends
9.6. Others
9.6.1. Global Ferromanganese Market, By Others, By Region, 2019-2032 (US$ Mn)
9.6.2. Market Dynamics for Others
9.6.2.1. Drivers
9.6.2.2. Restraints
9.6.2.3. Opportunities
9.6.2.4. Trends
10. Global Ferromanganese Market, By End-Use Industry
10.1. Global Ferromanganese Market Overview, by End-Use Industry
10.1.1. Global Ferromanganese Market Revenue Share, By End-Use Industry, 2023 Vs 2032 (in %)
10.2. Steel
10.2.1. Global Ferromanganese Market, By Steel, By Region, 2019-2032 (US$ Mn)
10.2.2. Market Dynamics for Steel
10.2.2.1. Drivers
10.2.2.2. Restraints
10.2.2.3. Opportunities
10.2.2.4. Trends
10.3. Non-ferrous Metals
10.3.1. Global Ferromanganese Market, By Non-ferrous Metals, By Region, 2019-2032 (US$ Mn)
10.3.2. Market Dynamics for Non-ferrous Metals
10.3.2.1. Drivers
10.3.2.2. Restraints
10.3.2.3. Opportunities
10.3.2.4. Trends
10.4. Chemicals
10.4.1. Global Ferromanganese Market, By Chemicals, By Region, 2019-2032 (US$ Mn)
10.4.2. Market Dynamics for Chemicals
10.4.2.1. Drivers
10.4.2.2. Restraints
10.4.2.3. Opportunities
10.4.2.4. Trends
10.5. Others
10.5.1. Global Ferromanganese Market, By Others, By Region, 2019-2032 (US$ Mn)
10.5.2. Market Dynamics for Others
10.5.2.1. Drivers
10.5.2.2. Restraints
10.5.2.3. Opportunities
10.5.2.4. Trends
11. Global Ferromanganese Market, By Method of Production
11.1. Global Ferromanganese Market Overview, by Method of Production
11.1.1. Global Ferromanganese Market Revenue Share, By Method of Production, 2023 Vs 2032 (in %)
11.2. Blast Furnace
11.2.1. Global Ferromanganese Market, By Blast Furnace, By Region, 2019-2032 (US$ Mn)
11.2.2. Market Dynamics for Blast Furnace
11.2.2.1. Drivers
11.2.2.2. Restraints
11.2.2.3. Opportunities
11.2.2.4. Trends
11.3. Electric Arc Furnace
11.3.1. Global Ferromanganese Market, By Electric Arc Furnace, By Region, 2019-2032 (US$ Mn)
11.3.2. Market Dynamics for Electric Arc Furnace
11.3.2.1. Drivers
11.3.2.2. Restraints
11.3.2.3. Opportunities
11.3.2.4. Trends
12. Global Ferromanganese Market, By Distribution Channel
12.1. Global Ferromanganese Market Overview, by Distribution Channel
12.1.1. Global Ferromanganese Market Revenue Share, By Distribution Channel, 2023 Vs 2032 (in %)
12.2. Direct Sales
12.2.1. Global Ferromanganese Market, By Direct Sales, By Region, 2019-2032 (US$ Mn)
12.2.2. Market Dynamics for Direct Sales
12.2.2.1. Drivers
12.2.2.2. Restraints
12.2.2.3. Opportunities
12.2.2.4. Trends
12.3. Indirect Sales (Distributors, Traders)
12.3.1. Global Ferromanganese Market, By Indirect Sales (Distributors, Traders), By Region, 2019-2032 (US$ Mn)
12.3.2. Market Dynamics for Indirect Sales (Distributors, Traders)
12.3.2.1. Drivers
12.3.2.2. Restraints
12.3.2.3. Opportunities
12.3.2.4. Trends
13. Global Ferromanganese Market, By Region
13.1. Global Ferromanganese Market Overview, by Region
13.1.1. Global Ferromanganese Market, By Region, 2023 Vs 2032 (in%)
13.2. Type
13.2.1. Global Ferromanganese Market, By Type, 2019-2032 (US$ Mn)
13.3. Application
13.3.1. Global Ferromanganese Market, By Application, 2019-2032 (US$ Mn)
13.4. End-Use Industry
13.4.1. Global Ferromanganese Market, By End-Use Industry, 2019-2032 (US$ Mn)
13.5. Method of Production
13.5.1. Global Ferromanganese Market, By Method of Production, 2019-2032 (US$ Mn)
13.6. Distribution Channel
13.6.1. Global Ferromanganese Market, By Distribution Channel, 2019-2032 (US$ Mn)
14. North America Ferromanganese Market Analysis
14.1. Overview
14.1.1. Market Dynamics for North America
14.1.1.1. Drivers
14.1.1.2. Restraints
14.1.1.3. Opportunities
14.1.1.4. Trends
14.2. North America Ferromanganese Market, by Type, 2019-2032 (US$ Mn)
14.2.1. Overview
14.2.2. SRC Analysis
14.3. North America Ferromanganese Market, by Application, 2019-2032 (US$ Mn)
14.3.1. Overview
14.3.2. SRC Analysis
14.4. North America Ferromanganese Market, by End-Use Industry, 2019-2032 (US$ Mn)
14.4.1. Overview
14.4.2. SRC Analysis
14.5. North America Ferromanganese Market, by Method of Production, 2019-2032(US$ Mn)
14.5.1. Overview
14.5.2. SRC Analysis
14.6. North America Ferromanganese Market, by Distribution Channel, 2019-2032(US$ Mn)
14.6.1. Overview
14.6.2. SRC Analysis
14.7. North America Ferromanganese Market, by Country, 2019-2032 (US$ Mn)
14.7.1. North America Ferromanganese Market, by Country, 2023 Vs 2032 (in%)
14.7.2. U.S.
14.7.3. Canada
14.7.4. Mexico
15. Europe Ferromanganese Market Analysis
15.1. Overview
15.1.1. Market Dynamics for Europe
15.1.1.1. Drivers
15.1.1.2. Restraints
15.1.1.3. Opportunities
15.1.1.4. Trends
15.2. Europe Ferromanganese Market, by Type, 2019-2032(US$ Mn)
15.2.1. Overview
15.2.2. SRC Analysis
15.3. Europe Ferromanganese Market, by Application, 2019-2032(US$ Mn)
15.3.1. Overview
15.3.2. SRC Analysis
15.4. Europe Ferromanganese Market, by End-Use Industry, 2019-2032(US$ Mn)
15.4.1. Overview
15.4.2. SRC Analysis
15.5. Europe Ferromanganese Market, by Method of Production, 2019-2032(US$ Mn)
15.5.1. Overview
15.5.2. SRC Analysis
15.6. Europe Ferromanganese Market, by Distribution Channel, 2019-2032(US$ Mn)
15.6.1. Overview
15.6.2. SRC Analysis
15.7. Europe Ferromanganese Market, by Country, 2019-2032 (US$ Mn)
15.7.1. Europe Ferromanganese Market, by Country, 2023 Vs 2032 (in%)
15.7.2. UK
15.7.3. France
15.7.4. Germany
15.7.5. Italy
15.7.6. Spain
15.7.7. Benelux
15.7.8. Russia
15.7.9. Rest of Europe
16. Asia Pacific Ferromanganese Market Analysis
16.1. Overview
16.1.1. Market Dynamics for Asia Pacific
16.1.1.1. Drivers
16.1.1.2. Restraints
16.1.1.3. Opportunities
16.1.1.4. Trends
16.2. Asia Pacific Ferromanganese Market, by Type, 2019-2032(US$ Mn)
16.2.1. Overview
16.2.2. SRC Analysis
16.3. Asia Pacific Ferromanganese Market, by Application, 2019-2032(US$ Mn)
16.3.1. Overview
16.3.2. SRC Analysis
16.4. Asia Pacific Ferromanganese Market, by End-Use Industry, 2019-2032(US$ Mn)
16.4.1. Overview
16.4.2. SRC Analysis
16.5. Asia Pacific Ferromanganese Market, by Method of Production, 2019-2032(US$ Mn)
16.5.1. Overview
16.5.2. SRC Analysis
16.6. Asia Pacific Ferromanganese Market, by Distribution Channel, 2019-2032(US$ Mn)
16.6.1. Overview
16.6.2. SRC Analysis
16.7. Asia Pacific Ferromanganese Market, by Country, 2019-2032 (US$ Mn)
16.7.1. Asia Pacific Ferromanganese Market, by Country, 2023 Vs 2032 (in%)
16.7.2. China
16.7.3. Japan
16.7.4. India
16.7.5. South Korea
16.7.6. South East Asia
16.7.7. Rest of Asia Pacific
17. Latin America Ferromanganese Market Analysis
17.1. Overview
17.1.1. Market Dynamics for Latin America
17.1.1.1. Drivers
17.1.1.2. Restraints
17.1.1.3. Opportunities
17.1.1.4. Trends
17.2. Latin America Ferromanganese Market, by Type, 2019-2032(US$ Mn)
17.2.1. Overview
17.2.2. SRC Analysis
17.3. Latin America Ferromanganese Market, by Application, 2019-2032(US$ Mn)
17.3.1. Overview
17.3.2. SRC Analysis
17.4. Latin America Ferromanganese Market, by End-Use Industry, 2019-2032(US$ Mn)
17.4.1. Overview
17.4.2. SRC Analysis
17.5. Latin America Ferromanganese Market, by Method of Production, 2019-2032(US$ Mn)
17.5.1. Overview
17.5.2. SRC Analysis
17.6. Latin America Ferromanganese Market, by Distribution Channel, 2019-2032(US$ Mn)
17.6.1. Overview
17.6.2. SRC Analysis
17.7. Latin America Ferromanganese Market, by Country, 2019-2032 (US$ Mn)
17.7.1. Latin America Ferromanganese Market, by Country, 2023 Vs 2032 (in%)
17.7.2. Brazil
17.7.3. Argentina
17.7.4. Rest of Latin America
18. Middle East Ferromanganese Market Analysis
18.1. Overview
18.1.1. Market Dynamics for Middle East
18.1.1.1. Drivers
18.1.1.2. Restraints
18.1.1.3. Opportunities
18.1.1.4. Trends
18.2. Middle East Ferromanganese Market, by Type, 2019-2032(US$ Mn)
18.2.1. Overview
18.2.2. SRC Analysis
18.3. Middle East Ferromanganese Market, by Application, 2019-2032(US$ Mn)
18.3.1. Overview
18.3.2. SRC Analysis
18.4. Middle East Ferromanganese Market, by End-Use Industry, 2019-2032(US$ Mn)
18.4.1. Overview
18.4.2. SRC Analysis
18.5. Middle East Ferromanganese Market, by Method of Production, 2019-2032(US$ Mn)
18.5.1. Overview
18.5.2. SRC Analysis
18.6. Middle East Ferromanganese Market, by Distribution Channel, 2019-2032(US$ Mn)
18.6.1. Overview
18.6.2. SRC Analysis
18.7. Middle East Ferromanganese Market, by Country, 2019-2032 (US$ Mn)
18.7.1. Middle East Ferromanganese Market, by Country, 2023 Vs 2032 (in%)
18.7.2. UAE
18.7.3. Saudi Arabia
18.7.4. Rest of Middle East
19. Africa Ferromanganese Market Analysis
19.1. Overview
19.1.1. Market Dynamics for Africa
19.1.1.1. Drivers
19.1.1.2. Restraints
19.1.1.3. Opportunities
19.1.1.4. Trends
19.2. Africa Ferromanganese Market, by Type, 2019-2032(US$ Mn)
19.2.1. Overview
19.2.2. SRC Analysis
19.3. Africa Ferromanganese Market, by Application, 2019-2032(US$ Mn)
19.3.1. Overview
19.3.2. SRC Analysis
19.4. Africa Ferromanganese Market, by End-Use Industry, 2019-2032(US$ Mn)
19.4.1. Overview
19.4.2. SRC Analysis
19.5. Africa Ferromanganese Market, by Method of Production, 2019-2032(US$ Mn)
19.5.1. Overview
19.5.2. SRC Analysis
19.6. Africa Ferromanganese Market, by Distribution Channel, 2019-2032(US$ Mn)
19.6.1. Overview
19.6.2. SRC Analysis
19.7. Africa Ferromanganese Market, by Country, 2019-2032 (US$ Mn)
19.7.1. Africa Ferromanganese Market, by Country, 2023 Vs 2032 (in%)
19.7.2. South Africa
19.7.3. Egypt
19.7.4. Rest of Africa
20. Company profiles
20.1. Monnet Group (New Delhi, India)
20.1.1. Company Overview
20.1.2. Products/Services Portfolio
20.1.3. Geographical Presence
20.1.4. SWOT Analysis
20.1.5. Financial Summary
20.1.5.1. Market Revenue and Net Profit (2019-2023)
20.1.5.2. Business Segment Revenue Analysis
20.1.5.3. Geographical Revenue Analysis
20.2. Maithan Alloys Limited (Kolkata, India)
20.3. Tata Steel (Mumbai, India)
20.4. Gulf Manganese Corporation Limited (Perth, Western Australia)
20.5. Vale (Rio de Janeiro, Brazil)
20.6. Ferroglobe (London, UK)
20.7. OM Holdings Ltd. (Singapore)
20.8. South32 (Perth, Western Australia)
20.9. Nippon Denko (Tokyo, Japan)
20.10. Others
21. Research Methodology
21.1. Research Methodology
21.2. Phase I – Secondary Research
21.3. Phase II – Data Modelling
21.3.1. Company Share Analysis Model
21.3.2. Revenue Based Modelling
21.4. Phase III – Primary Research
21.5. Research Limitations
21.5.1. Assumptions

List of Figures
FIG. 1 Global Ferromanganese Market: Research Methodology
FIG. 2 Market Size Estimation – Top Down & Bottom up Approach
FIG. 3 Global Ferromanganese Market Segmentation
FIG. 4 Global Ferromanganese Market, by Type, 2023 (US$ Mn)
FIG. 5 Global Ferromanganese Market, by Application, 2023 (US$ Mn)
FIG. 6 Global Ferromanganese Market, by End-Use Industry, 2023 (US$ Mn)
FIG. 7 Global Ferromanganese Market, by Method of Production, 2023 (US$ Mn)
FIG. 8 Global Ferromanganese Market, by Distribution Channel, 2023 (US$ Mn)
FIG. 9 Global Ferromanganese Market, by Geography, 2023 (US$ Mn)
FIG. 10 Attractive Investment Proposition, by Type, 2023
FIG. 11 Attractive Investment Proposition, by Application, 2023
FIG. 12 Attractive Investment Proposition, by End-Use Industry, 2023
FIG. 13 Attractive Investment Proposition, by Method of Production, 2023
FIG. 14 Attractive Investment Proposition, by Distribution Channel, 2023
FIG. 15 Attractive Investment Proposition, by Geography, 2023
FIG. 16 Global Market Share Analysis of Key Ferromanganese Market Manufacturers, 2023
FIG. 17 Global Market Positioning of Key Ferromanganese Market Manufacturers, 2023
FIG. 18 Global Ferromanganese Market Value Contribution, By Type, 2023 & 2032 (Value %)
FIG. 19 Global Ferromanganese Market, by High Carbon Ferromanganese, Value, 2019-2032 (US$ Mn)
FIG. 20 Global Ferromanganese Market, by Medium Carbon Ferromanganese, Value, 2019-2032 (US$ Mn)
FIG. 21 Global Ferromanganese Market, by Low Carbon Ferromanganese, Value, 2019-2032 (US$ Mn)
FIG. 22 Global Ferromanganese Market Value Contribution, By Application, 2023 & 2032 (Value %)
FIG. 23 Global Ferromanganese Market, by Steel Production, Value, 2019-2032 (US$ Mn)
FIG. 24 Global Ferromanganese Market, by Foundry, Value, 2019-2032 (US$ Mn)
FIG. 25 Global Ferromanganese Market, by Welding Fluxes, Value, 2019-2032 (US$ Mn)
FIG. 26 Global Ferromanganese Market, by Chemical Industry, Value, 2019-2032 (US$ Mn)
FIG. 27 Global Ferromanganese Market, by Others, Value, 2019-2032 (US$ Mn)
FIG. 28 Global Ferromanganese Market Value Contribution, By End-Use Industry, 2023 & 2032 (Value %)
FIG. 29 Global Ferromanganese Market, by Steel, Value, 2019-2032 (US$ Mn)
FIG. 30 Global Ferromanganese Market, by Non-ferrous Metals, Value, 2019-2032 (US$ Mn)
FIG. 31 Global Ferromanganese Market, by Chemicals, Value, 2019-2032 (US$ Mn)
FIG. 32 Global Ferromanganese Market, by Others, Value, 2019-2032 (US$ Mn)
FIG. 33 Global Ferromanganese Market Value Contribution, By Method of Production, 2023 & 2032 (Value %)
FIG. 34 Global Ferromanganese Market, by Blast Furnace, Value, 2019-2032 (US$ Mn)
FIG. 35 Global Ferromanganese Market, by Electric Arc Furnace, Value, 2019-2032 (US$ Mn)
FIG. 36 Global Ferromanganese Market Value Contribution, By Distribution Channel, 2023 & 2032 (Value %)
FIG. 37 Global Ferromanganese Market, by Direct Sales, Value, 2019-2032 (US$ Mn)
FIG. 38 Global Ferromanganese Market, by Indirect Sales (Distributors, Traders), Value, 2019-2032 (US$ Mn)
FIG. 39 North America Ferromanganese Market, 2019-2032 (US$ Mn)
FIG. 40 U.S. Ferromanganese Market, 2019-2032 (US$ Mn)
FIG. 41 Canada Ferromanganese Market, 2019-2032 (US$ Mn)
FIG. 42 Mexico Ferromanganese Market, 2019-2032 (US$ Mn)
FIG. 43 Europe Ferromanganese Market, 2019-2032 (US$ Mn)
FIG. 44 Germany Ferromanganese Market, 2019-2032 (US$ Mn)
FIG. 45 France Ferromanganese Market, 2019-2032 (US$ Mn)
FIG. 46 U.K. Ferromanganese Market, 2019-2032 (US$ Mn)
FIG. 47 Italy Ferromanganese Market, 2019-2032 (US$ Mn)
FIG. 48 Spain Ferromanganese Market, 2019-2032 (US$ Mn)
FIG. 49 Benelux Ferromanganese Market, 2019-2032 (US$ Mn)
FIG. 50 Russia Ferromanganese Market, 2019-2032 (US$ Mn)
FIG. 51 Rest of Europe Ferromanganese Market, 2019-2032 (US$ Mn)
FIG. 52 Asia Pacific Ferromanganese Market, 2019-2032 (US$ Mn)
FIG. 53 China Ferromanganese Market, 2019-2032 (US$ Mn)
FIG. 54 Japan Ferromanganese Market, 2019-2032 (US$ Mn)
FIG. 55 India Ferromanganese Market, 2019-2032 (US$ Mn)
FIG. 56 South Korea Ferromanganese Market, 2019-2032 (US$ Mn)
FIG. 57 South-East Asia Ferromanganese Market, 2019-2032 (US$ Mn)
FIG. 58 Rest of Asia Pacific Ferromanganese Market, 2019-2032 (US$ Mn)
FIG. 59 Latin America Ferromanganese Market, 2019-2032 (US$ Mn)
FIG. 60 Brazil Ferromanganese Market, 2019-2032 (US$ Mn)
FIG. 61 Argentina Ferromanganese Market, 2019-2032 (US$ Mn)
FIG. 62 Rest of Latin America Ferromanganese Market, 2019-2032 (US$ Mn)
FIG. 63 Middle East Ferromanganese Market, 2019-2032 (US$ Mn)
FIG. 64 UAE Ferromanganese Market, 2019-2032 (US$ Mn)
FIG. 65 Saudi Arabia Ferromanganese Market, 2019-2032 (US$ Mn)
FIG. 66 Rest of Middle East Ferromanganese Market, 2019-2032 (US$ Mn)
FIG. 67 Africa Ferromanganese Market, 2019-2032 (US$ Mn)
FIG. 68 South Africa Ferromanganese Market, 2019-2032 (US$ Mn)
FIG. 69 Egypt Ferromanganese Market, 2019-2032 (US$ Mn)
FIG. 70 Rest of Africa Ferromanganese Market, 2019-2032 (US$ Mn)

List of Tables
TABLE 1 Market Snapshot: Global Ferromanganese Market
TABLE 2 Global Ferromanganese Market: Market Drivers Impact Analysis
TABLE 3 Global Ferromanganese Market: Market Restraints Impact Analysis
TABLE 4 Global Ferromanganese Market, by Competitive Benchmarking, 2023
TABLE 5 Global Ferromanganese Market, by Geographical Presence Analysis, 2023
TABLE 6 Global Ferromanganese Market, by Key Strategies Analysis, 2023
TABLE 7 Global Ferromanganese Market, by High Carbon Ferromanganese, By Region, 2019-2023 (US$ Mn)
TABLE 8 Global Ferromanganese Market, by High Carbon Ferromanganese, By Region, 2024-2032 (US$ Mn)
TABLE 9 Global Ferromanganese Market, by Medium Carbon Ferromanganese, By Region, 2019-2023 (US$ Mn)
TABLE 10 Global Ferromanganese Market, by Medium Carbon Ferromanganese, By Region, 2024-2032 (US$ Mn)
TABLE 11 Global Ferromanganese Market, by Low Carbon Ferromanganese, By Region, 2019-2023 (US$ Mn)
TABLE 12 Global Ferromanganese Market, by Low Carbon Ferromanganese, By Region, 2024-2032 (US$ Mn)
TABLE 13 Global Ferromanganese Market, by Steel Production, By Region, 2019-2023 (US$ Mn)
TABLE 14 Global Ferromanganese Market, by Steel Production, By Region, 2024-2032 (US$ Mn)
TABLE 15 Global Ferromanganese Market, by Foundry, By Region, 2019-2023 (US$ Mn)
TABLE 16 Global Ferromanganese Market, by Foundry, By Region, 2024-2032 (US$ Mn)
TABLE 17 Global Ferromanganese Market, by Welding Fluxes, By Region, 2019-2023 (US$ Mn)
TABLE 18 Global Ferromanganese Market, by Welding Fluxes, By Region, 2024-2032 (US$ Mn)
TABLE 19 Global Ferromanganese Market, by Chemical Industry, By Region, 2019-2023 (US$ Mn)
TABLE 20 Global Ferromanganese Market, by Chemical Industry, By Region, 2024-2032 (US$ Mn)
TABLE 21 Global Ferromanganese Market, by Others, By Region, 2019-2023 (US$ Mn)
TABLE 22 Global Ferromanganese Market, by Others, By Region, 2024-2032 (US$ Mn)
TABLE 23 Global Ferromanganese Market, by Steel, By Region, 2019-2023 (US$ Mn)
TABLE 24 Global Ferromanganese Market, by Steel, By Region, 2024-2032 (US$ Mn)
TABLE 25 Global Ferromanganese Market, by Non-ferrous Metals, By Region, 2019-2023 (US$ Mn)
TABLE 26 Global Ferromanganese Market, by Non-ferrous Metals, By Region, 2024-2032 (US$ Mn)
TABLE 27 Global Ferromanganese Market, by Chemicals, By Region, 2019-2023 (US$ Mn)
TABLE 28 Global Ferromanganese Market, by Chemicals, By Region, 2024-2032 (US$ Mn)
TABLE 29 Global Ferromanganese Market, by Others, By Region, 2019-2023 (US$ Mn)
TABLE 30 Global Ferromanganese Market, by Others, By Region, 2024-2032 (US$ Mn)
TABLE 31 Global Ferromanganese Market, by Blast Furnace, By Region, 2019-2023 (US$ Mn)
TABLE 32 Global Ferromanganese Market, by Blast Furnace, By Region, 2024-2032 (US$ Mn)
TABLE 33 Global Ferromanganese Market, by Electric Arc Furnace, By Region, 2019-2023 (US$ Mn)
TABLE 34 Global Ferromanganese Market, by Electric Arc Furnace, By Region, 2024-2032 (US$ Mn)
TABLE 35 Global Ferromanganese Market, by Direct Sales, By Region, 2019-2023 (US$ Mn)
TABLE 36 Global Ferromanganese Market, by Direct Sales, By Region, 2024-2032 (US$ Mn)
TABLE 37 Global Ferromanganese Market, by Indirect Sales (Distributors, Traders), By Region, 2019-2023 (US$ Mn)
TABLE 38 Global Ferromanganese Market, by Indirect Sales (Distributors, Traders), By Region, 2024-2032 (US$ Mn)
TABLE 39 Global Ferromanganese Market, by Type, 2019-2023 (US$ Mn)
TABLE 40 Global Ferromanganese Market, by Type, 2024-2032 (US$ Mn)
TABLE 41 Global Ferromanganese Market, by Application, 2019-2023 (US$ Mn)
TABLE 42 Global Ferromanganese Market, by Application, 2024-2032 (US$ Mn)
TABLE 43 Global Ferromanganese Market, by End-Use Industry, 2019-2023 (US$ Mn)
TABLE 44 Global Ferromanganese Market, by End-Use Industry, 2024-2032 (US$ Mn)
TABLE 45 Global Ferromanganese Market, by Method of Production, 2019-2023 (US$ Mn)
TABLE 46 Global Ferromanganese Market, by Method of Production, 2024-2032 (US$ Mn)
TABLE 47 Global Ferromanganese Market, by Distribution Channel, 2019-2023 (US$ Mn)
TABLE 48 Global Ferromanganese Market, by Distribution Channel, 2024-2032 (US$ Mn)
TABLE 49 Global Ferromanganese Market, by Region, 2019-2023 (US$ Mn)
TABLE 50 Global Ferromanganese Market, by Region, 2024-2032 (US$ Mn)
TABLE 51 North America Ferromanganese Market, by Type, 2019-2023 (US$ Mn)
TABLE 52 North America Ferromanganese Market, by Type, 2024-2032 (US$ Mn)
TABLE 53 North America Ferromanganese Market, by Application, 2019-2023 (US$ Mn)
TABLE 54 North America Ferromanganese Market, by Application, 2024-2032 (US$ Mn)
TABLE 55 North America Ferromanganese Market, by End-Use Industry, 2019-2023 (US$ Mn)
TABLE 56 North America Ferromanganese Market, by End-Use Industry, 2024-2032 (US$ Mn)
TABLE 57 North America Ferromanganese Market, by Method of Production, 2019-2023 (US$ Mn)
TABLE 58 North America Ferromanganese Market, by Method of Production, 2024-2032 (US$ Mn)
TABLE 59 North America Ferromanganese Market, by Distribution Channel, 2019-2023 (US$ Mn)
TABLE 60 North America Ferromanganese Market, by Distribution Channel, 2024-2032 (US$ Mn)
TABLE 61 North America Ferromanganese Market, by Country, 2019-2023 (US$ Mn)
TABLE 62 North America Ferromanganese Market, by Country, 2024-2032 (US$ Mn)
TABLE 63 United States Ferromanganese Market, by Type, 2019-2023 (US$ Mn)
TABLE 64 United States Ferromanganese Market, by Type, 2024-2032 (US$ Mn)
TABLE 65 United States Ferromanganese Market, by Application, 2019-2023 (US$ Mn)
TABLE 66 United States Ferromanganese Market, by Application, 2024-2032 (US$ Mn)
TABLE 67 United States Ferromanganese Market, by End-Use Industry, 2019-2023 (US$ Mn)
TABLE 68 United States Ferromanganese Market, by End-Use Industry, 2024-2032 (US$ Mn)
TABLE 69 United States Ferromanganese Market, by Method of Production, 2019-2023 (US$ Mn)
TABLE 70 United States Ferromanganese Market, by Method of Production, 2024-2032 (US$ Mn)
TABLE 71 United States Ferromanganese Market, by Distribution Channel, 2019-2023 (US$ Mn)
TABLE 72 United States Ferromanganese Market, by Distribution Channel, 2024-2032 (US$ Mn)
TABLE 73 Canada Ferromanganese Market, by Type, 2019-2023 (US$ Mn)
TABLE 74 Canada Ferromanganese Market, by Type, 2024-2032 (US$ Mn)
TABLE 75 Canada Ferromanganese Market, by Application, 2019-2023 (US$ Mn)
TABLE 76 Canada Ferromanganese Market, by Application, 2024-2032 (US$ Mn)
TABLE 77 Canada Ferromanganese Market, by End-Use Industry, 2019-2023 (US$ Mn)
TABLE 78 Canada Ferromanganese Market, by End-Use Industry, 2024-2032 (US$ Mn)
TABLE 79 Canada Ferromanganese Market, by Method of Production, 2019-2023 (US$ Mn)
TABLE 80 Canada Ferromanganese Market, by Method of Production, 2024-2032 (US$ Mn)
TABLE 81 Canada Ferromanganese Market, by Distribution Channel, 2019-2023 (US$ Mn)
TABLE 82 Canada Ferromanganese Market, by Distribution Channel, 2024-2032 (US$ Mn)
TABLE 83 Mexico Ferromanganese Market, by Type, 2019-2023 (US$ Mn)
TABLE 84 Mexico Ferromanganese Market, by Type, 2024-2032 (US$ Mn)
TABLE 85 Mexico Ferromanganese Market, by Application, 2019-2023 (US$ Mn)
TABLE 86 Mexico Ferromanganese Market, by Application, 2024-2032 (US$ Mn)
TABLE 87 Mexico Ferromanganese Market, by End-Use Industry, 2019-2023 (US$ Mn)
TABLE 88 Mexico Ferromanganese Market, by End-Use Industry, 2024-2032 (US$ Mn)
TABLE 89 Mexico Ferromanganese Market, by Method of Production, 2019-2023 (US$ Mn)
TABLE 90 Mexico Ferromanganese Market, by Method of Production, 2024-2032 (US$ Mn)
TABLE 91 Mexico Ferromanganese Market, by Distribution Channel, 2019-2023 (US$ Mn)
TABLE 92 Mexico Ferromanganese Market, by Distribution Channel, 2024-2032 (US$ Mn)
TABLE 93 Europe Ferromanganese Market, by Type, 2019-2023 (US$ Mn)
TABLE 94 Europe Ferromanganese Market, by Type, 2024-2032 (US$ Mn)
TABLE 95 Europe Ferromanganese Market, by Application, 2019-2023 (US$ Mn)
TABLE 96 Europe Ferromanganese Market, by Application, 2024-2032 (US$ Mn)
TABLE 97 Europe Ferromanganese Market, by End-Use Industry, 2019-2023 (US$ Mn)
TABLE 98 Europe Ferromanganese Market, by End-Use Industry, 2024-2032 (US$ Mn)
TABLE 99 Europe Ferromanganese Market, by Method of Production, 2019-2023 (US$ Mn)
TABLE 100 Europe Ferromanganese Market, by Method of Production, 2024-2032 (US$ Mn)
TABLE 101 Europe Ferromanganese Market, by Distribution Channel, 2019-2023 (US$ Mn)
TABLE 102 Europe Ferromanganese Market, by Distribution Channel, 2024-2032 (US$ Mn)
TABLE 103 Europe Ferromanganese Market, by Country, 2019-2023 (US$ Mn)
TABLE 104 Europe Ferromanganese Market, by Country, 2024-2032 (US$ Mn)
TABLE 105 Germany Ferromanganese Market, by Type, 2019-2023 (US$ Mn)
TABLE 106 Germany Ferromanganese Market, by Type, 2024-2032 (US$ Mn)
TABLE 107 Germany Ferromanganese Market, by Application, 2019-2023 (US$ Mn)
TABLE 108 Germany Ferromanganese Market, by Application, 2024-2032 (US$ Mn)
TABLE 109 Germany Ferromanganese Market, by End-Use Industry, 2019-2023 (US$ Mn)
TABLE 110 Germany Ferromanganese Market, by End-Use Industry, 2024-2032 (US$ Mn)
TABLE 111 Germany Ferromanganese Market, by Method of Production, 2019-2023 (US$ Mn)
TABLE 112 Germany Ferromanganese Market, by Method of Production, 2024-2032 (US$ Mn)
TABLE 113 Germany Ferromanganese Market, by Distribution Channel, 2019-2023 (US$ Mn)
TABLE 114 Germany Ferromanganese Market, by Distribution Channel, 2024-2032 (US$ Mn)
TABLE 115 France Ferromanganese Market, by Type, 2019-2023 (US$ Mn)
TABLE 116 France Ferromanganese Market, by Type, 2024-2032 (US$ Mn)
TABLE 117 France Ferromanganese Market, by Application, 2019-2023 (US$ Mn)
TABLE 118 France Ferromanganese Market, by Application, 2024-2032 (US$ Mn)
TABLE 119 France Ferromanganese Market, by End-Use Industry, 2019-2023 (US$ Mn)
TABLE 120 France Ferromanganese Market, by End-Use Industry, 2024-2032 (US$ Mn)
TABLE 121 France Ferromanganese Market, by Method of Production, 2019-2023 (US$ Mn)
TABLE 122 France Ferromanganese Market, by Method of Production, 2024-2032 (US$ Mn)
TABLE 123 France Ferromanganese Market, by Distribution Channel, 2019-2023 (US$ Mn)
TABLE 124 France Ferromanganese Market, by Distribution Channel, 2024-2032 (US$ Mn)
TABLE 125 United Kingdom Ferromanganese Market, by Type, 2019-2023 (US$ Mn)
TABLE 126 United Kingdom Ferromanganese Market, by Type, 2024-2032 (US$ Mn)
TABLE 127 United Kingdom Ferromanganese Market, by Application, 2019-2023 (US$ Mn)
TABLE 128 United Kingdom Ferromanganese Market, by Application, 2024-2032 (US$ Mn)
TABLE 129 United Kingdom Ferromanganese Market, by End-Use Industry, 2019-2023 (US$ Mn)
TABLE 130 United Kingdom Ferromanganese Market, by End-Use Industry, 2024-2032 (US$ Mn)
TABLE 131 United Kingdom Ferromanganese Market, by Method of Production, 2019-2023 (US$ Mn)
TABLE 132 United Kingdom Ferromanganese Market, by Method of Production, 2024-2032 (US$ Mn)
TABLE 133 United Kingdom Ferromanganese Market, by Distribution Channel, 2019-2023 (US$ Mn)
TABLE 134 United Kingdom Ferromanganese Market, by Distribution Channel, 2024-2032 (US$ Mn)
TABLE 135 Italy Ferromanganese Market, by Type, 2019-2023 (US$ Mn)
TABLE 136 Italy Ferromanganese Market, by Type, 2024-2032 (US$ Mn)
TABLE 137 Italy Ferromanganese Market, by Application, 2019-2023 (US$ Mn)
TABLE 138 Italy Ferromanganese Market, by Application, 2024-2032 (US$ Mn)
TABLE 139 Italy Ferromanganese Market, by End-Use Industry, 2019-2023 (US$ Mn)
TABLE 140 Italy Ferromanganese Market, by End-Use Industry, 2024-2032 (US$ Mn)
TABLE 141 Italy Ferromanganese Market, by Method of Production, 2019-2023 (US$ Mn)
TABLE 142 Italy Ferromanganese Market, by Method of Production, 2024-2032 (US$ Mn)
TABLE 143 Italy Ferromanganese Market, by Distribution Channel, 2019-2023 (US$ Mn)
TABLE 144 Italy Ferromanganese Market, by Distribution Channel, 2024-2032 (US$ Mn)
TABLE 145 Spain Ferromanganese Market, by Type, 2019-2023 (US$ Mn)
TABLE 146 Spain Ferromanganese Market, by Type, 2024-2032 (US$ Mn)
TABLE 147 Spain Ferromanganese Market, by Application, 2019-2023 (US$ Mn)
TABLE 148 Spain Ferromanganese Market, by Application, 2024-2032 (US$ Mn)
TABLE 149 Spain Ferromanganese Market, by End-Use Industry, 2019-2023 (US$ Mn)
TABLE 150 Spain Ferromanganese Market, by End-Use Industry, 2024-2032 (US$ Mn)
TABLE 151 Spain Ferromanganese Market, by Method of Production, 2019-2023 (US$ Mn)
TABLE 152 Spain Ferromanganese Market, by Method of Production, 2024-2032 (US$ Mn)
TABLE 153 Spain Ferromanganese Market, by Distribution Channel, 2019-2023 (US$ Mn)
TABLE 154 Spain Ferromanganese Market, by Distribution Channel, 2024-2032 (US$ Mn)
TABLE 155 Benelux Ferromanganese Market, by Type, 2019-2023 (US$ Mn)
TABLE 156 Benelux Ferromanganese Market, by Type, 2024-2032 (US$ Mn)
TABLE 157 Benelux Ferromanganese Market, by Application, 2019-2023 (US$ Mn)
TABLE 158 Benelux Ferromanganese Market, by Application, 2024-2032 (US$ Mn)
TABLE 159 Benelux Ferromanganese Market, by End-Use Industry, 2019-2023 (US$ Mn)
TABLE 160 Benelux Ferromanganese Market, by End-Use Industry, 2024-2032 (US$ Mn)
TABLE 161 Benelux Ferromanganese Market, by Method of Production, 2019-2023 (US$ Mn)
TABLE 162 Benelux Ferromanganese Market, by Method of Production, 2024-2032 (US$ Mn)
TABLE 163 Benelux Ferromanganese Market, by Distribution Channel, 2019-2023 (US$ Mn)
TABLE 164 Benelux Ferromanganese Market, by Distribution Channel, 2024-2032 (US$ Mn)
TABLE 165 Russia Ferromanganese Market, by Type, 2019-2023 (US$ Mn)
TABLE 166 Russia Ferromanganese Market, by Type, 2024-2032 (US$ Mn)
TABLE 167 Russia Ferromanganese Market, by Application, 2019-2023 (US$ Mn)
TABLE 168 Russia Ferromanganese Market, by Application, 2024-2032 (US$ Mn)
TABLE 169 Russia Ferromanganese Market, by End-Use Industry, 2019-2023 (US$ Mn)
TABLE 170 Russia Ferromanganese Market, by End-Use Industry, 2024-2032 (US$ Mn)
TABLE 171 Russia Ferromanganese Market, by Method of Production, 2019-2023 (US$ Mn)
TABLE 172 Russia Ferromanganese Market, by Method of Production, 2024-2032 (US$ Mn)
TABLE 173 Russia Ferromanganese Market, by Distribution Channel, 2019-2023 (US$ Mn)
TABLE 174 Russia Ferromanganese Market, by Distribution Channel, 2024-2032 (US$ Mn)
TABLE 175 Rest of Europe Ferromanganese Market, by Type, 2019-2023 (US$ Mn)
TABLE 176 Rest of Europe Ferromanganese Market, by Type, 2024-2032 (US$ Mn)
TABLE 177 Rest of Europe Ferromanganese Market, by Application, 2019-2023 (US$ Mn)
TABLE 178 Rest of Europe Ferromanganese Market, by Application, 2024-2032 (US$ Mn)
TABLE 179 Rest of Europe Ferromanganese Market, by End-Use Industry, 2019-2023 (US$ Mn)
TABLE 180 Rest of Europe Ferromanganese Market, by End-Use Industry, 2024-2032 (US$ Mn)
TABLE 181 Rest of Europe Ferromanganese Market, by Method of Production, 2019-2023 (US$ Mn)
TABLE 182 Rest of Europe Ferromanganese Market, by Method of Production, 2024-2032 (US$ Mn)
TABLE 183 Rest of Europe Ferromanganese Market, by Distribution Channel, 2019-2023 (US$ Mn)
TABLE 184 Rest of Europe Ferromanganese Market, by Distribution Channel, 2024-2032 (US$ Mn)
TABLE 185 Asia Pacific Ferromanganese Market, by Type, 2019-2023 (US$ Mn)
TABLE 186 Asia Pacific Ferromanganese Market, by Type, 2024-2032 (US$ Mn)
TABLE 187 Asia Pacific Ferromanganese Market, by Application, 2019-2023 (US$ Mn)
TABLE 188 Asia Pacific Ferromanganese Market, by Application, 2024-2032 (US$ Mn)
TABLE 189 Asia Pacific Ferromanganese Market, by End-Use Industry, 2019-2023 (US$ Mn)
TABLE 190 Asia Pacific Ferromanganese Market, by End-Use Industry, 2024-2032 (US$ Mn)
TABLE 191 Asia Pacific Ferromanganese Market, by Method of Production, 2019-2023 (US$ Mn)
TABLE 192 Asia Pacific Ferromanganese Market, by Method of Production, 2024-2032 (US$ Mn)
TABLE 193 Asia Pacific Ferromanganese Market, by Distribution Channel, 2019-2023 (US$ Mn)
TABLE 194 Asia Pacific Ferromanganese Market, by Distribution Channel, 2024-2032 (US$ Mn)
TABLE 195 China Ferromanganese Market, by Type, 2019-2023 (US$ Mn)
TABLE 196 China Ferromanganese Market, by Type, 2024-2032 (US$ Mn)
TABLE 197 China Ferromanganese Market, by Application, 2019-2023 (US$ Mn)
TABLE 198 China Ferromanganese Market, by Application, 2024-2032 (US$ Mn)
TABLE 199 China Ferromanganese Market, by End-Use Industry, 2019-2023 (US$ Mn)
TABLE 200 China Ferromanganese Market, by End-Use Industry, 2024-2032 (US$ Mn)
TABLE 201 China Ferromanganese Market, by Method of Production, 2019-2023 (US$ Mn)
TABLE 202 China Ferromanganese Market, by Method of Production, 2024-2032 (US$ Mn)
TABLE 203 China Ferromanganese Market, by Distribution Channel, 2019-2023 (US$ Mn)
TABLE 204 China Ferromanganese Market, by Distribution Channel, 2024-2032 (US$ Mn)
TABLE 205 Japan Ferromanganese Market, by Type, 2019-2023 (US$ Mn)
TABLE 206 Japan Ferromanganese Market, by Type, 2024-2032 (US$ Mn)
TABLE 207 Japan Ferromanganese Market, by Application, 2019-2023 (US$ Mn)
TABLE 208 Japan Ferromanganese Market, by Application, 2024-2032 (US$ Mn)
TABLE 209 Japan Ferromanganese Market, by End-Use Industry, 2019-2023 (US$ Mn)
TABLE 210 Japan Ferromanganese Market, by End-Use Industry, 2024-2032 (US$ Mn)
TABLE 211 Japan Ferromanganese Market, by Method of Production, 2019-2023 (US$ Mn)
TABLE 212 Japan Ferromanganese Market, by Method of Production, 2024-2032 (US$ Mn)
TABLE 213 Japan Ferromanganese Market, by Distribution Channel, 2019-2023 (US$ Mn)
TABLE 214 Japan Ferromanganese Market, by Distribution Channel, 2024-2032 (US$ Mn)
TABLE 215 India Ferromanganese Market, by Type, 2019-2023 (US$ Mn)
TABLE 216 India Ferromanganese Market, by Type, 2024-2032 (US$ Mn)
TABLE 217 India Ferromanganese Market, by Application, 2019-2023 (US$ Mn)
TABLE 218 India Ferromanganese Market, by Application, 2024-2032 (US$ Mn)
TABLE 219 India Ferromanganese Market, by End-Use Industry, 2019-2023 (US$ Mn)
TABLE 220 India Ferromanganese Market, by End-Use Industry, 2024-2032 (US$ Mn)
TABLE 221 India Ferromanganese Market, by Method of Production, 2019-2023 (US$ Mn)
TABLE 222 India Ferromanganese Market, by Method of Production, 2024-2032 (US$ Mn)
TABLE 223 India Ferromanganese Market, by Distribution Channel, 2019-2023 (US$ Mn)
TABLE 224 India Ferromanganese Market, by Distribution Channel, 2024-2032 (US$ Mn)
TABLE 225 South Korea Ferromanganese Market, by Type, 2019-2023 (US$ Mn)
TABLE 226 South Korea Ferromanganese Market, by Type, 2024-2032 (US$ Mn)
TABLE 227 South Korea Ferromanganese Market, by Application, 2019-2023 (US$ Mn)
TABLE 228 South Korea Ferromanganese Market, by Application, 2024-2032 (US$ Mn)
TABLE 229 South Korea Ferromanganese Market, by End-Use Industry, 2019-2023 (US$ Mn)
TABLE 230 South Korea Ferromanganese Market, by End-Use Industry, 2024-2032 (US$ Mn)
TABLE 231 South Korea Ferromanganese Market, by Method of Production, 2019-2023 (US$ Mn)
TABLE 232 South Korea Ferromanganese Market, by Method of Production, 2024-2032 (US$ Mn)
TABLE 233 South Korea Ferromanganese Market, by Distribution Channel, 2019-2023 (US$ Mn)
TABLE 234 South Korea Ferromanganese Market, by Distribution Channel, 2024-2032 (US$ Mn)
TABLE 235 South-East Asia Ferromanganese Market, by Type, 2019-2023 (US$ Mn)
TABLE 236 South-East Asia Ferromanganese Market, by Type, 2024-2032 (US$ Mn)
TABLE 237 South-East Asia Ferromanganese Market, by Application, 2019-2023 (US$ Mn)
TABLE 238 South-East Asia Ferromanganese Market, by Application, 2024-2032 (US$ Mn)
TABLE 239 South-East Asia Ferromanganese Market, by End-Use Industry, 2019-2023 (US$ Mn)
TABLE 240 South-East Asia Ferromanganese Market, by End-Use Industry, 2024-2032 (US$ Mn)
TABLE 241 South-East Asia Ferromanganese Market, by Method of Production, 2019-2023 (US$ Mn)
TABLE 242 South-East Asia Ferromanganese Market, by Method of Production, 2024-2032 (US$ Mn)
TABLE 243 South-East Asia Ferromanganese Market, by Distribution Channel, 2019-2023 (US$ Mn)
TABLE 244 South-East Asia Ferromanganese Market, by Distribution Channel, 2024-2032 (US$ Mn)
TABLE 245 Rest of Asia Pacific Ferromanganese Market, by Type, 2019-2023 (US$ Mn)
TABLE 246 Rest of Asia Pacific Ferromanganese Market, by Type, 2024-2032 (US$ Mn)
TABLE 247 Rest of Asia Pacific Ferromanganese Market, by Application, 2019-2023 (US$ Mn)
TABLE 248 Rest of Asia Pacific Ferromanganese Market, by Application, 2024-2032 (US$ Mn)
TABLE 249 Rest of Asia Pacific Ferromanganese Market, by End-Use Industry, 2019-2023 (US$ Mn)
TABLE 250 Rest of Asia Pacific Ferromanganese Market, by End-Use Industry, 2024-2032 (US$ Mn)
TABLE 251 Rest of Asia Pacific Ferromanganese Market, by Method of Production, 2019-2023 (US$ Mn)
TABLE 252 Rest of Asia Pacific Ferromanganese Market, by Method of Production, 2024-2032 (US$ Mn)
TABLE 253 Rest of Asia Pacific Ferromanganese Market, by Distribution Channel, 2019-2023 (US$ Mn)
TABLE 254 Rest of Asia Pacific Ferromanganese Market, by Distribution Channel, 2024-2032 (US$ Mn)
TABLE 255 Latin America Ferromanganese Market, by Type, 2019-2023 (US$ Mn)
TABLE 256 Latin America Ferromanganese Market, by Type, 2024-2032 (US$ Mn)
TABLE 257 Latin America Ferromanganese Market, by Application, 2019-2023 (US$ Mn)
TABLE 258 Latin America Ferromanganese Market, by Application, 2024-2032 (US$ Mn)
TABLE 259 Latin America Ferromanganese Market, by End-Use Industry, 2019-2023 (US$ Mn)
TABLE 260 Latin America Ferromanganese Market, by End-Use Industry, 2024-2032 (US$ Mn)
TABLE 261 Latin America Ferromanganese Market, by Method of Production, 2019-2023 (US$ Mn)
TABLE 262 Latin America Ferromanganese Market, by Method of Production, 2024-2032 (US$ Mn)
TABLE 263 Latin America Ferromanganese Market, by Distribution Channel, 2019-2023 (US$ Mn)
TABLE 264 Latin America Ferromanganese Market, by Distribution Channel, 2024-2032 (US$ Mn)
TABLE 265 Brazil Ferromanganese Market, by Type, 2019-2023 (US$ Mn)
TABLE 266 Brazil Ferromanganese Market, by Type, 2024-2032 (US$ Mn)
TABLE 267 Brazil Ferromanganese Market, by Application, 2019-2023 (US$ Mn)
TABLE 268 Brazil Ferromanganese Market, by Application, 2024-2032 (US$ Mn)
TABLE 269 Brazil Ferromanganese Market, by End-Use Industry, 2019-2023 (US$ Mn)
TABLE 270 Brazil Ferromanganese Market, by End-Use Industry, 2024-2032 (US$ Mn)
TABLE 271 Brazil Ferromanganese Market, by Method of Production, 2019-2023 (US$ Mn)
TABLE 272 Brazil Ferromanganese Market, by Method of Production, 2024-2032 (US$ Mn)
TABLE 273 Brazil Ferromanganese Market, by Distribution Channel, 2019-2023 (US$ Mn)
TABLE 274 Brazil Ferromanganese Market, by Distribution Channel, 2024-2032 (US$ Mn)
TABLE 275 Argentina Ferromanganese Market, by Type, 2019-2023 (US$ Mn)
TABLE 276 Argentina Ferromanganese Market, by Type, 2024-2032 (US$ Mn)
TABLE 277 Argentina Ferromanganese Market, by Application, 2019-2023 (US$ Mn)
TABLE 278 Argentina Ferromanganese Market, by Application, 2024-2032 (US$ Mn)
TABLE 279 Argentina Ferromanganese Market, by End-Use Industry, 2019-2023 (US$ Mn)
TABLE 280 Argentina Ferromanganese Market, by End-Use Industry, 2024-2032 (US$ Mn)
TABLE 281 Argentina Ferromanganese Market, by Method of Production, 2019-2023 (US$ Mn)
TABLE 282 Argentina Ferromanganese Market, by Method of Production, 2024-2032 (US$ Mn)
TABLE 283 Argentina Ferromanganese Market, by Distribution Channel, 2019-2023 (US$ Mn)
TABLE 284 Argentina Ferromanganese Market, by Distribution Channel, 2024-2032 (US$ Mn)
TABLE 285 Rest of Latin America Ferromanganese Market, by Type, 2019-2023 (US$ Mn)
TABLE 286 Rest of Latin America Ferromanganese Market, by Type, 2024-2032 (US$ Mn)
TABLE 287 Rest of Latin America Ferromanganese Market, by Application, 2019-2023 (US$ Mn)
TABLE 288 Rest of Latin America Ferromanganese Market, by Application, 2024-2032 (US$ Mn)
TABLE 289 Rest of Latin America Ferromanganese Market, by End-Use Industry, 2019-2023 (US$ Mn)
TABLE 290 Rest of Latin America Ferromanganese Market, by End-Use Industry, 2024-2032 (US$ Mn)
TABLE 291 Rest of Latin America Ferromanganese Market, by Method of Production, 2019-2023 (US$ Mn)
TABLE 292 Rest of Latin America Ferromanganese Market, by Method of Production, 2024-2032 (US$ Mn)
TABLE 293 Rest of Latin America Ferromanganese Market, by Distribution Channel, 2019-2023 (US$ Mn)
TABLE 294 Rest of Latin America Ferromanganese Market, by Distribution Channel, 2024-2032 (US$ Mn)
TABLE 295 Middle East Ferromanganese Market, by Type, 2019-2023 (US$ Mn)
TABLE 296 Middle East Ferromanganese Market, by Type, 2024-2032 (US$ Mn)
TABLE 297 Middle East Ferromanganese Market, by Application, 2019-2023 (US$ Mn)
TABLE 298 Middle East Ferromanganese Market, by Application, 2024-2032 (US$ Mn)
TABLE 299 Middle East Ferromanganese Market, by End-Use Industry, 2019-2023 (US$ Mn)
TABLE 300 Middle East Ferromanganese Market, by End-Use Industry, 2024-2032 (US$ Mn)
TABLE 301 Middle East Ferromanganese Market, by Method of Production, 2019-2023 (US$ Mn)
TABLE 302 Middle East Ferromanganese Market, by Method of Production, 2024-2032 (US$ Mn)
TABLE 303 Middle East Ferromanganese Market, by Distribution Channel, 2019-2023 (US$ Mn)
TABLE 304 Middle East Ferromanganese Market, by Distribution Channel, 2024-2032 (US$ Mn)
TABLE 305 UAE Ferromanganese Market, by Type, 2019-2023 (US$ Mn)
TABLE 306 UAE Ferromanganese Market, by Type, 2024-2032 (US$ Mn)
TABLE 307 UAE Ferromanganese Market, by Application, 2019-2023 (US$ Mn)
TABLE 308 UAE Ferromanganese Market, by Application, 2024-2032 (US$ Mn)
TABLE 309 UAE Ferromanganese Market, by End-Use Industry, 2019-2023 (US$ Mn)
TABLE 310 UAE Ferromanganese Market, by End-Use Industry, 2024-2032 (US$ Mn)
TABLE 311 UAE Ferromanganese Market, by Method of Production, 2019-2023 (US$ Mn)
TABLE 312 UAE Ferromanganese Market, by Method of Production, 2024-2032 (US$ Mn)
TABLE 313 UAE Ferromanganese Market, by Distribution Channel, 2019-2023 (US$ Mn)
TABLE 314 UAE Ferromanganese Market, by Distribution Channel, 2024-2032 (US$ Mn)
TABLE 315 Saudi Arabia Ferromanganese Market, by Type, 2019-2023 (US$ Mn)
TABLE 316 Saudi Arabia Ferromanganese Market, by Type, 2024-2032 (US$ Mn)
TABLE 317 Saudi Arabia Ferromanganese Market, by Application, 2019-2023 (US$ Mn)
TABLE 318 Saudi Arabia Ferromanganese Market, by Application, 2024-2032 (US$ Mn)
TABLE 319 Saudi Arabia Ferromanganese Market, by End-Use Industry, 2019-2023 (US$ Mn)
TABLE 320 Saudi Arabia Ferromanganese Market, by End-Use Industry, 2024-2032 (US$ Mn)
TABLE 321 Saudi Arabia Ferromanganese Market, by Method of Production, 2019-2023 (US$ Mn)
TABLE 322 Saudi Arabia Ferromanganese Market, by Method of Production, 2024-2032 (US$ Mn)
TABLE 323 Saudi Arabia Ferromanganese Market, by Distribution Channel, 2019-2023 (US$ Mn)
TABLE 324 Saudi Arabia Ferromanganese Market, by Distribution Channel, 2024-2032 (US$ Mn)
TABLE 325 Rest of Middle East Ferromanganese Market, by Type, 2019-2023 (US$ Mn)
TABLE 326 Rest of Middle East Ferromanganese Market, by Type, 2024-2032 (US$ Mn)
TABLE 327 Rest of Middle East Ferromanganese Market, by Application, 2019-2023 (US$ Mn)
TABLE 328 Rest of Middle East Ferromanganese Market, by Application, 2024-2032 (US$ Mn)
TABLE 329 Rest of Middle East Ferromanganese Market, by End-Use Industry, 2019-2023 (US$ Mn)
TABLE 330 Rest of Middle East Ferromanganese Market, by End-Use Industry, 2024-2032 (US$ Mn)
TABLE 331 Rest of Middle East Ferromanganese Market, by Method of Production, 2019-2023 (US$ Mn)
TABLE 332 Rest of Middle East Ferromanganese Market, by Method of Production, 2024-2032 (US$ Mn)
TABLE 333 Rest of Middle East Ferromanganese Market, by Distribution Channel, 2019-2023 (US$ Mn)
TABLE 334 Rest of Middle East Ferromanganese Market, by Distribution Channel, 2024-2032 (US$ Mn)
TABLE 335 Africa Ferromanganese Market, by Type, 2019-2023 (US$ Mn)
TABLE 336 Africa Ferromanganese Market, by Type, 2024-2032 (US$ Mn)
TABLE 337 Africa Ferromanganese Market, by Application, 2019-2023 (US$ Mn)
TABLE 338 Africa Ferromanganese Market, by Application, 2024-2032 (US$ Mn)
TABLE 339 Africa Ferromanganese Market, by End-Use Industry, 2019-2023 (US$ Mn)
TABLE 340 Africa Ferromanganese Market, by End-Use Industry, 2024-2032 (US$ Mn)
TABLE 341 Africa Ferromanganese Market, by Method of Production, 2019-2023 (US$ Mn)
TABLE 342 Africa Ferromanganese Market, by Method of Production, 2024-2032 (US$ Mn)
TABLE 343 Africa Ferromanganese Market, by Distribution Channel, 2019-2023 (US$ Mn)
TABLE 344 Africa Ferromanganese Market, by Distribution Channel, 2024-2032 (US$ Mn)
TABLE 345 South Africa Ferromanganese Market, by Type, 2019-2023 (US$ Mn)
TABLE 346 South Africa Ferromanganese Market, by Type, 2024-2032 (US$ Mn)
TABLE 347 South Africa Ferromanganese Market, by Application, 2019-2023 (US$ Mn)
TABLE 348 South Africa Ferromanganese Market, by Application, 2024-2032 (US$ Mn)
TABLE 349 South Africa Ferromanganese Market, by End-Use Industry, 2019-2023 (US$ Mn)
TABLE 350 South Africa Ferromanganese Market, by End-Use Industry, 2024-2032 (US$ Mn)
TABLE 351 South Africa Ferromanganese Market, by Method of Production, 2019-2023 (US$ Mn)
TABLE 352 South Africa Ferromanganese Market, by Method of Production, 2024-2032 (US$ Mn)
TABLE 353 South Africa Ferromanganese Market, by Distribution Channel, 2019-2023 (US$ Mn)
TABLE 354 South Africa Ferromanganese Market, by Distribution Channel, 2024-2032 (US$ Mn)
TABLE 355 Egypt Ferromanganese Market, by Type, 2019-2023 (US$ Mn)
TABLE 356 Egypt Ferromanganese Market, by Type, 2024-2032 (US$ Mn)
TABLE 357 Egypt Ferromanganese Market, by Application, 2019-2023 (US$ Mn)
TABLE 358 Egypt Ferromanganese Market, by Application, 2024-2032 (US$ Mn)
TABLE 359 Egypt Ferromanganese Market, by End-Use Industry, 2019-2023 (US$ Mn)
TABLE 360 Egypt Ferromanganese Market, by End-Use Industry, 2024-2032 (US$ Mn)
TABLE 361 Egypt Ferromanganese Market, by Method of Production, 2019-2023 (US$ Mn)
TABLE 362 Egypt Ferromanganese Market, by Method of Production, 2024-2032 (US$ Mn)
TABLE 363 Egypt Ferromanganese Market, by Distribution Channel, 2019-2023 (US$ Mn)
TABLE 364 Egypt Ferromanganese Market, by Distribution Channel, 2024-2032 (US$ Mn)
TABLE 365 Rest of Africa Ferromanganese Market, by Type, 2019-2023 (US$ Mn)
TABLE 366 Rest of Africa Ferromanganese Market, by Type, 2024-2032 (US$ Mn)
TABLE 367 Rest of Africa Ferromanganese Market, by Application, 2019-2023 (US$ Mn)
TABLE 368 Rest of Africa Ferromanganese Market, by Application, 2024-2032 (US$ Mn)
TABLE 369 Rest of Africa Ferromanganese Market, by End-Use Industry, 2019-2023 (US$ Mn)
TABLE 370 Rest of Africa Ferromanganese Market, by End-Use Industry, 2024-2032 (US$ Mn)
TABLE 371 Rest of Africa Ferromanganese Market, by Method of Production, 2019-2023 (US$ Mn)
TABLE 372 Rest of Africa Ferromanganese Market, by Method of Production, 2024-2032 (US$ Mn)
TABLE 373 Rest of Africa Ferromanganese Market, by Distribution Channel, 2019-2023 (US$ Mn)
TABLE 374 Rest of Africa Ferromanganese Market, by Distribution Channel, 2024-2032 (US$ Mn)


Frequently Asked Question:

How much does the global market currently hold for ferromanganese?

In 2023, the ferromanganese market was estimated to be worth USD 72154.2 million.

What is the projected growth rate of the ferromanganese market between 2024 and 2032?

The ferromanganese market is anticipated to increase at a CAGR of 5.20% from 2024 to 2032, reaching USD 113868.41 million in 2032.

In terms of ferromanganese type, which market category is leading?

High carbon ferromanganese is the most popular type of ferromanganese category.

Which distribution channel segment is estimated to have the highest CAGR throughout the forecast period?

The category with the highest predicted CAGR is expected to be the direct sales channel during the projected period.

Who are the main players in the ferromanganese industry globally?

The top players include Monnet Group (New Delhi, India), Maithan Alloys Limited (Kolkata, India), Tata Steel (Mumbai, India), Gulf Manganese Corporation Limited (Perth, Western Australia), Vale (Rio de Janeiro, Brazil), Ferroglobe (London, UK), OM Holdings Ltd. (Singapore), South32 (Perth, Western Australia), Nippon Denko (Tokyo, Japan), and others.

Mining Pipe Market

Published:
Report ID: 33548

Biomining Market

Published:
Report ID: 1435

Sealless Magnetic Drive Pump Market

Published:
Report ID: 18087

Mining Equipment Market

Published:
Report ID: 8658

Underground Mining Equipment Market

Published:
Report ID: 10970

Mining Drill Bits Market

Published:
Report ID: 16733

Automotive Wire Harnessing Tape Market

Published:
Report ID: 1863

Aluminium Window System Market

Published:
Report ID: 12278

Metallurgical Coke Market

Published:
Report ID: 9586

Electric Mining Equipment Market

Published:
Report ID: 5123

Bioleaching Market

Published:
Report ID: 1583

Activated Charcoal Market

Published:
Report ID: 1275

Purchase Options

$2999
Delivery Format: Excel.
$4999
Designed for the individual purchaser.
$6999
Users located at a single corporate site or regional office.
$7999
Allowed for unlimited sharing globally within one company.
Smallform of Sample request

Have a question?

User Profile

Don’t settle for less – trust Mitul to help you find the best solution.

Report delivery within 24 to 48 hours

– Other Info –

What people say?-

User Review

I am very impressed with the information in this report. The author clearly did their research when they came up with this product and it has already given me a lot of ideas.

Jana Schmidt
CEDAR CX Technologies

– Connect with us –

Phone

+91 6232 49 3207


support

24/7 Research Support


sales@credenceresearch.com

– Research Methodology –

Going beyond the basics: advanced techniques in research methodology

– Trusted By –

Pepshi, LG, Nestle
Motorola, Honeywell, Johnson and johnson
LG Chem, SIEMENS, Pfizer
Unilever, Samsonite, QIAGEN