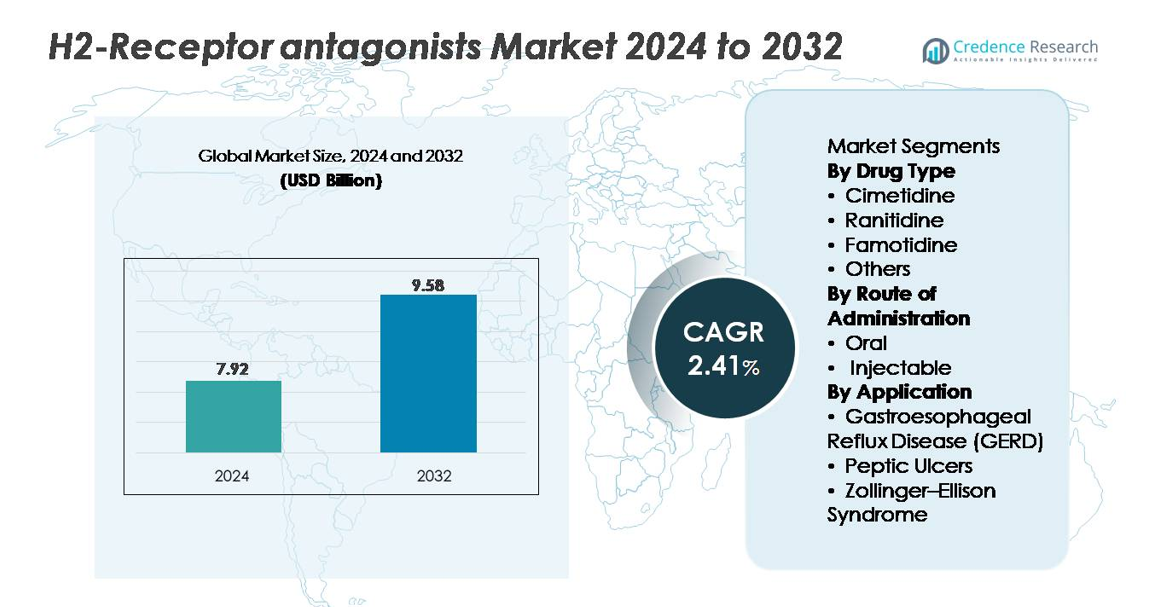
Home » Healthcare » Pharmaceuticals » H2-Receptor Antagonists Market

Global H2-Receptor Antagonists Market By Types (Famotidine, Cimetidine ,Ranitidine , Nizatidine) By Dosage Form (Tablet, Powder/Suspension, Syrup, Injectable, Others) Growth, Future Prospects & Competitive Analysis, 2016 – 2030

Price: $4999

Published: | Report ID: 6844 | Report Format : PDF

Key Highlights of the report

How are the major segments performing in the H2-Receptor Antagonists Market?

  • The ranitidine-type segment led the global market in 2021 and is anticipated to continue over the projected period. Ranitidine/Zantac is an H2-receptor antagonist widely used to treat stomach ulcers, diarrhea, and acid indigestion.
  • In 2021, the tablets dosage form segment accounted for the largest global H2-receptor antagonists market revenue share. H2-receptor antagonists are most commonly found in tablet (chewable) and liquid forms across the globe.
  • The peptic ulcer application segment dominated the global H2-receptor antagonists market in 2021. The rising prevalence of peptic ulcer complications such as perforation and bleeding drives demand H2 receptor antagonists.
  • In 2021, the retail pharmacies distribution channel segment led the global H2-receptor antagonists market. The easy availability of pharmaceutical drugs and some integrin H2-receptor antagonists at retail pharmacies are expected to drive segment expansion throughout the projection period.

What is the Market Size of H2-Receptor Antagonists regarding value?

The global H2-receptor antagonists market is anticipated to grow at a substantial CAGR of XX% in the upcoming years. The global H2-Receptor Antagonists industry was estimated to be worth USD XX million in 2021 and was expected to be worth USD XX million by 2028.

Design Element 2

Access crucial information at unmatched prices!

Request your free sample report today & start making informed decisions powered by Credence Research!

Download Free Sample
CTA Design Element 3

Which region dominated the H2-receptor antagonists market?

North America dominated the global market for H2-receptor antagonists. It is due to the large number of patients suffering from heartburn and the accessibility of OTC generics. Besides, the United States is likely to be the largest market owing to improved healthcare infrastructure and the increased prevalence of GERD. The most commonly used H2-receptor antagonists in the United States are tablets (chewable) and liquids. Furthermore, advances in R&D activities in the pharmaceutical and medical industries, as well as increased technology and the availability of advanced therapies, treatment options, and medications, will drive the regional market in the coming years.

How is US Market Performing in the H2-receptor antagonists market?

The United States controls most of the North American H2-receptor antagonist’s market share. Increased awareness of the acid-peptic disease and gastroesophageal reflux disease, as well as treatment options and disease management, have increased demand for H2-receptor antagonists in the country. The US government and other non-profit organizations actively use public awareness campaigns, educational and clinical workshops, and clinical trials to educate the public about gastric acid management, thereby promoting the growth of the H2-receptor antagonists market.

What is the competitive environment of the H2-receptor antagonists market?

The market for H2-receptor antagonists is fairly consolidated, with a few small and medium-sized manufacturers accounting for a large global share. The market’s manufacturers are segregated across the value chain. The leading market players are well-equipped with substantial production facilities and involved in various R&D activities. Moreover, strategic collaborations and acquisitions also contribute to the market’s expansion. For instance, in April 2018, AstraZeneca, in partnership with Daiichi Sankyo, launched Nexium 10 mg and 20 mg Granules for Suspension, an H2-receptor antagonist for peptic ulcer treatment.

Executive Summary

What are the key trends or recent developments in the H2-Receptor Antagonists Market?

  • In July 2019, ANI Pharmaceuticals announced the introduction of generic ranitidine caplets for treating duodenal ulcers in collaboration with Appco Pharma.

What are all the technical developments in the H2-receptor antagonists market?

Manufacturers in the global H2-receptor antagonists market are investing more in R&D to develop new and improved dosage foam techniques. The leading players are also concerned with providing efficient and patient-friendly products. AstraZeneca, Zydus Cadila, and Pfizer Inc currently dominate the global market and will do so in the coming years. Their dominance can be attributed to their strong and diverse product portfolios and a strong global distribution network. These main players are heavily involved in R&D, which results in robust regulatory approvals. For instance, in July 2019, Zydus Cadila received US FDA approval for Misoprostol tablets to treat stomach ulcers.

Which are the key investments by the H2-receptor antagonists market players?

Many pharmaceutical companies are investing in developing over-the-counter versions of peptic ulcer medications, expected to drive H2-receptor antagonists market growth in the coming years. For example, Strides Shasun, a major player in the Ranitidine type market in the United States, introduced the OTC version of the gastric ulcer drug Ranitidine in February 2018. Likewise, Famotidine, a popular stomach ulcer treatment, is under investigation as a potential cure for the coronavirus at Northwell Health in New York City in May 2020.

Some major players in the H2-receptor antagonists market are Mylan N.V., Teva Pharmaceutical, Fresenius SE & Co. KGaA, GlaxoSmithKline plc, Apotex Inc, Merck & Company Inc, Hospira Inc, Perrigo Company plc, F. Hoffmann-La Roche AG, AbbVie, Celgene, and EA Pharma Co. Ltd.

What are the Major Driving Factors for the H2-Receptor Antagonists Market?

The growing prevalence of peptic ulcer complications such as perforation and bleeding drives demand H2 receptor antagonists. Moreover, the increasing prevalence of oesophageal and duodenal ulcers represents a market expansion opportunity. Major healthcare organizations and government bodies are expected to launch growth initiatives in the coming years, boosting market growth. Furthermore, the ease of availability and affordability of H2 Receptor Antagonist products in low and middle-income countries is expected to accelerate market growth.

What are the Major Risks for the H2-Receptor Antagonists Market?

Adverse effects caused by H2 receptor antagonists, such as difficulty urinating, constipation, headache, dry skin, dry mouth, and diarrhea, may limit the market growth. H2-receptor antagonists, on the other hand, are occasionally linked to serious side effects like wheezing, agitation, hallucinations, and changes in vision, which could restrain the market’s expansion. Furthermore, stringent drug approval regulations may further impede the development of the global H2 receptor antagonist market.

Which are the key types in the H2-receptor antagonists market?

The ranitidine-type segment will hold a major revenue share of the global H2-receptor antagonists market over the projected period. Ranitidine is an H2-receptor antagonist commonly used to treat stomach ulcers, diarrhea, and acid reflux. Ranitidine/Zantac is a medication prescribed to treat gastroesophageal reflux disease (GERD) symptoms such as heartburn. It works by decreasing the amount of stomach acid produced. Ranitidine/Zantac is available without a prescription and over the counter. Ranitidine/Zantac can help with occasional heartburn, acid reflux, and a sour stomach. It may also help to keep these symptoms from returning. Ranitidine reduces stomach acid production for up to 12 hours. Ranitidine/Zantac can also treat ulcers and other conditions caused by excess stomach acid.

How is the H2-receptor antagonists market performing in regions?

Asia Pacific is expected to be one of the fastest-growing regions over the forecast years due to rapid regional economic development, improved healthcare infrastructure, and increased patient awareness of available treatment options. The growing prevalence of gastrointestinal disorders, including GERD, rising numbers of GERD-related diagnostic and surgical procedures, rising demand for over-the-counter and generic medications, and rapidly increasing preference for minimally invasive surgeries are the key drivers of revenue growth in the Asia Pacific market.

What is the regulatory landscape for the H2-receptor antagonists market?

Clinical trials for new drugs to overcome complications with currently available drugs are expected to drive market growth over the coming years. For instance, clinicaltrails.gov states that Takeda Pharmaceuticals’ Vonoprazan fumarate, a potassium-competitive H2-receptor drug for treating peptic ulcer disease, is currently undergoing Phase 3 trials.

Shape Your Report to Specific Countries or Regions & Enjoy 30% Off!

What are the major players planning for the future of the H2-receptor antagonists market?

The growing prevalence of peptic ulcer disease drives key H2-receptor antagonists industry players to invest in R&D. As a result, new drugs for treating peptic ulcer disease are introduced, positively impacting the global market growth. Increased drug approvals and generic product availability will further likely contribute to market development over the forecast period. For instance, the US FDA approved RHB-105 (Talicia) by RedHill Biopharma Ltd in November 2019 to treat adults with Helicobacter pylori.

REPORT ATTRIBUTE DETAILS
H2-Receptor Antagonists Market by Volume Yes
H2-Receptor Antagonists Market by Value Yes
H2-Receptor Antagonists Market, Tornado Analysis Yes
H2-Receptor Antagonists Market, STAR Analysis Yes
H2-Receptor Antagonists Market, SRC Analysis Yes
H2-Receptor Antagonists Market, Import-Export Data Yes (On Demand)
H2-Receptor Antagonists Market Pricing Analysis Yes (On Demand)
H2-Receptor Antagonists Market Segment Analysis By Types (Famotidine, Cimetidine, Ranitidine, and Nizatidine)

By Dosage Form (Tablet, Powder/Suspension, Syrup, Injectable, and Others)

By Application (Gastritis, Peptic Ulcers, Zollinger-Ellison Syndrome, Allergies, and Others)

By Distribution Channel (Hospital Pharmacies, Retail Pharmacies, Online Pharmacies, and Others)

H2-Receptor Antagonists Market, Regional Analysis North America (US and Canada)

Europe (Germany, UK, France, Italy, Spain, and the Rest of Europe)

Asia Pacific (China, India, Japan, South Korea, South East Asia, and the Rest of Asia Pacific)

Latin America (Brazil, Mexico, and the Rest of Latin America)

Middle East and Africa (GCC Countries, South Africa, and the Rest of the Middle East and Africa)

H2-Receptor Antagonists Market Key Companies Mylan N.V., Teva Pharmaceutical, Fresenius SE & Co. KGaA, GlaxoSmithKline plc, Apotex Inc, Merck & Company Inc, Hospira Inc, Perrigo Company plc, F. Hoffmann-La Roche AG, AbbVie, Celgene, and EA Pharma Co. Ltd
H2-Receptor Antagonists Market Competitive Landscape Market Share Analysis

Competitive Benchmarking

Key Players Market Positioning

Geographical Presence Analysis

Major Strategies Adopted

Segmentation of Global H2-Receptor Antagonists Market-

Global H2-Receptor Antagonists Market – By Types

  • Famotidine
  • Cimetidine
  • Ranitidine
  • Nizatidine

Global H2-Receptor Antagonists Market – By Dosage Form

  • Tablet
  • Powder/Suspension
  • Syrup
  • Injectable
  • Others

Global H2-Receptor Antagonists Market – By Application

  • Gastritis
  • Peptic Ulcers
  • Zollinger-Ellison Syndrome
  • Allergies
  • Others

Global H2-Receptor Antagonists Market – By Distribution Channel

  • Hospital Pharmacies
  • Retail Pharmacies
  • Online Pharmacies
  • Others

Global H2-Receptor Antagonists Market – By Region

  • North America
    • U.S.
    • Canada
  • Europe
    • Germany
    • France
    • U.K.
    • Italy
    • Spain
    • Rest of Europe
  • Asia Pacific
    • China
    • Japan
    • India
    • South Korea
    • South-east Asia
    • Rest of Asia Pacific
  • Latin America
    • Brazil
    • Mexico
    • Rest of Latin America
  • Middle East & Africa
    • GCC Countries
    • South Africa
    • Rest of the Middle East and Africa

1. Preface
1.1. Report Description
1.1.1. Purpose of the Report
1.1.2. Target Audience
1.1.3. USP and Key Offerings
1.2. Research Scope
1.3. Research Methodology
1.3.1. Phase I – Secondary Research
1.3.2. Phase II – Primary Research
1.3.3. Phase III – Expert Panel Review
1.3.4. Approach Adopted
1.3.4.1. Top-Down Approach
1.3.4.2. Bottom-Up Approach
1.3.5. Assumptions
1.4. Market Introduction
1.5. Market Research Scope

2. Executive Summary
2.1. Market Snapshot: Global H2-Receptor Antagonists Market
2.2. Global H2-Receptor Antagonists Market, By Types
2.3. Global H2-Receptor Antagonists Market, By Application
2.4. Global H2-Receptor Antagonists Market, By Dosage Form
2.5. Global H2-Receptor Antagonists Market, By Distribution Channel
2.6. Global H2-Receptor Antagonists Market, By Region

3. Market Dynamics & Factors Analysis
3.1. Introduction
3.1.1. Global H2-Receptor Antagonists Market Value, 2016-2028, (US$ Bn)
3.1.2. Y-o-Y Growth Trend Analysis
3.2. Market Dynamics
3.2.1. Market Drivers
3.2.2. Market Restraints
3.2.3. Market Opportunities
3.2.4. Major Industry Challenges
3.3. Growth and Development Patterns
3.4. Investment Feasibility Analysis
3.5. Market Opportunity Analysis
3.5.1. Types
3.5.2. Application
3.5.3. Dosage Form
3.5.4. Distribution Channel
3.5.5. Geography

4. Premium Insights
4.1. STAR (Situation, Task, Action, Results) Analysis
4.2. Porter’s Five Forces Analysis
4.2.1. Threat of New Entrants
4.2.2. Bargaining Power of Buyers/Consumers
4.2.3. Bargaining Power of Suppliers
4.2.4. Threat of Substitute Types
4.2.5. Intensity of Competitive Rivalry
4.3. Key Market Trends
4.3.1. Demand Side Trends
4.3.2. Supply Side Trends
4.4. Value Chain Analysis
4.5. Technology Analysis
4.6. Analysis and Recommendations
4.7. Marketing Strategy Analysis
4.7.1. Direct Marketing
4.7.2. Indirect Marketing
4.7.3. Marketing Channel Development Trend

5. Market Positioning of Key Players, 2021
5.1. Company Market Share of Key Players, 2021
5.2. Competitive Benchmarking
5.3. Market Positioning of Key Vendors
5.4. Geographical Presence Analysis
5.5. Major Strategies Adopted by Key Players
5.5.1. Key Strategies Analysis
5.5.2. Mergers and Acquisitions
5.5.3. Partnerships
5.5.4. Product Launch
5.5.5. Geographical Expansion
5.5.6. Others

6. COVID-19 Impact Analysis
6.1. Global H2-Receptor Antagonists Market Pre Vs Post COVID-19, 2019 – 2028
6.2. Impact on Import & Export
6.3. Impact on Demand & Supply

7. Global H2-Receptor Antagonists Market
7.1. Global H2-Receptor Antagonists Market, by Types, 2016-2028(US$ Bn)
7.1.1. Overview
7.1.2. Global H2-Receptor Antagonists Market, By Types, 2021 vs 2028 (in%)
7.1.3. Global H2-Receptor Antagonists Market, By Famotidine, 2016-2028 (US$ Bn)
7.1.4. Global H2-Receptor Antagonists Market, By Cimetidine, 2016-2028 (US$ Bn)
7.1.5. Global H2-Receptor Antagonists Market, By Ranitidine, 2016-2028 (US$ Bn)
7.1.6. Global H2-Receptor Antagonists Market, By Nizatidine, 2016-2028 (US$ Bn)
7.2. Global H2-Receptor Antagonists Market, by Application, 2016-2028(US$ Bn)
7.2.1. Overview
7.2.2. Global H2-Receptor Antagonists Market, By Application, 2021 vs 2028 (in%)
7.2.3. Global H2-Receptor Antagonists Market, By Gastritis, 2016-2028 (US$ Bn)
7.2.4. Global H2-Receptor Antagonists Market, By Peptic Ulcers, 2016-2028 (US$ Bn)
7.2.5. Global H2-Receptor Antagonists Market, By Zollinger-Ellison Syndrome, 2016-2028 (US$ Bn)
7.2.6. Global H2-Receptor Antagonists Market, By Allergies, 2016-2028 (US$ Bn)
7.2.7. Global H2-Receptor Antagonists Market, By Others, 2016-2028 (US$ Bn)
7.3. Global H2-Receptor Antagonists Market, by Dosage Form, 2016-2028(US$ Bn)
7.3.1. Overview
7.3.2. Global H2-Receptor Antagonists Market, By Dosage Form, 2021 vs 2028 (in%)
7.3.3. Global H2-Receptor Antagonists Market, By Tablet, 2016-2028 (US$ Bn)
7.3.4. Global H2-Receptor Antagonists Market, By S-Band, 2016-2028 (US$ Bn)
7.3.5. Global H2-Receptor Antagonists Market, By Powder/Suspension, 2016-2028 (US$ Bn)
7.3.6. Global H2-Receptor Antagonists Market, By Syrup, 2016-2028 (US$ Bn)
7.3.7. Global H2-Receptor Antagonists Market, By Injectable, 2016-2028 (US$ Bn)
7.3.8. Global H2-Receptor Antagonists Market, By Others, 2016-2028 (US$ Bn)
7.4. Global H2-Receptor Antagonists Market, by Distribution Channel, 2016-2028(US$ Bn)
7.4.1. Overview
7.4.2. Global H2-Receptor Antagonists Market, By Distribution Channel, 2021 vs 2028 (in%)
7.4.3. Global H2-Receptor Antagonists Market, By Hospital Pharmacies, 2016-2028 (US$ Bn)
7.4.4. Global H2-Receptor Antagonists Market, By Retail Pharmacies, 2016-2028 (US$ Bn)
7.4.5. Global H2-Receptor Antagonists Market, By Online Pharmacies, 2016-2028 (US$ Bn)
7.4.6. Global H2-Receptor Antagonists Market, By Others, 2016-2028 (US$ Bn)

8. North America H2-Receptor Antagonists Market Analysis
8.1. North America H2-Receptor Antagonists Market, by Types, 2016-2028(US$ Bn)
8.1.1. Overview
8.1.2. SRC Analysis
8.2. North America H2-Receptor Antagonists Market, by Application, 2016-2028(US$ Bn)
8.2.1. Overview
8.2.2. SRC Analysis
8.3. North America H2-Receptor Antagonists Market, by Dosage Form, 2016-2028(US$ Bn)
8.3.1. Overview
8.3.2. SRC Analysis
8.4. North America H2-Receptor Antagonists Market, by Distribution Channel, 2016-2028(US$ Bn)
8.4.1. Overview
8.4.2. SRC Analysis
8.5. North America H2-Receptor Antagonists Market, by Country, 2016-2028 (US$ Bn)
8.5.1. U.S.
8.5.1.1. U.S. H2-Receptor Antagonists Market Estimates and Forecast, 2016-2028 (US$ Bn)
8.5.1.2. U.S. H2-Receptor Antagonists, By Types, 2016-2028 (US$ Bn)
8.5.1.3. U.S. H2-Receptor Antagonists, By Application, 2016-2028 (US$ Bn)
8.5.1.4. U.S. H2-Receptor Antagonists, By Dosage Form, 2016-2028 (US$ Bn)
8.5.1.5. U.S. H2-Receptor Antagonists, By Distribution Channel, 2016-2028 (US$ Bn)
8.5.2. Canada
8.5.2.1. Canada H2-Receptor Antagonists Market Estimates and Forecast, 2016-2028 (US$ Bn)
8.5.2.2. Canada H2-Receptor Antagonists, By Types, 2016-2028 (US$ Bn)
8.5.2.3. Canada H2-Receptor Antagonists, By Application, 2016-2028 (US$ Bn)
8.5.2.4. Canada H2-Receptor Antagonists, By Dosage Form, 2016-2028 (US$ Bn)
8.5.2.5. Canada H2-Receptor Antagonists, By Distribution Channel, 2016-2028 (US$ Bn)

9. Europe H2-Receptor Antagonists Market Analysis
9.1. Europe H2-Receptor Antagonists Market, by Types, 2016-2028(US$ Bn)
9.1.1. Overview
9.1.2. SRC Analysis
9.2. Europe H2-Receptor Antagonists Market, by Application, 2016-2028(US$ Bn)
9.2.1. Overview
9.2.2. SRC Analysis
9.3. Europe H2-Receptor Antagonists Market, by Dosage Form, 2016-2028(US$ Bn)
9.3.1. Overview
9.3.2. SRC Analysis
9.4. Europe H2-Receptor Antagonists Market, by Distribution Channel, 2016-2028(US$ Bn)
9.4.1. Overview
9.4.2. SRC Analysis
9.5. Europe H2-Receptor Antagonists Market, by Country, 2016-2028 (US$ Bn)
9.5.1. Germany
9.5.1.1. Germany H2-Receptor Antagonists Market Estimates and Forecast, 2016-2028 (US$ Bn)
9.5.1.2. Germany H2-Receptor Antagonists, By Types, 2016-2028 (US$ Bn)
9.5.1.3. Germany H2-Receptor Antagonists, By Application, 2016-2028 (US$ Bn)
9.5.1.4. Germany H2-Receptor Antagonists, By Dosage Form, 2016-2028 (US$ Bn)
9.5.1.5. Germany H2-Receptor Antagonists, By Distribution Channel, 2016-2028 (US$ Bn)
9.5.2. France
9.5.2.1. France H2-Receptor Antagonists Market Estimates and Forecast, 2016-2028 (US$ Bn)
9.5.2.2. France H2-Receptor Antagonists, By Types, 2016-2028 (US$ Bn)
9.5.2.3. France H2-Receptor Antagonists, By Application, 2016-2028 (US$ Bn)
9.5.2.4. France H2-Receptor Antagonists, By Dosage Form, 2016-2028 (US$ Bn)
9.5.2.5. France H2-Receptor Antagonists, By Distribution Channel, 2016-2028 (US$ Bn)
9.5.3. UK
9.5.3.1. UK H2-Receptor Antagonists Market Estimates and Forecast, 2016-2028 (US$ Bn)
9.5.3.2. UK H2-Receptor Antagonists, By Types, 2016-2028 (US$ Bn)
9.5.3.3. UK H2-Receptor Antagonists, By Application, 2016-2028 (US$ Bn)
9.5.3.4. UK H2-Receptor Antagonists, By Dosage Form, 2016-2028 (US$ Bn)
9.5.3.5. UK H2-Receptor Antagonists, By Distribution Channel, 2016-2028 (US$ Bn)
9.5.4. Italy
9.5.4.1. Italy H2-Receptor Antagonists Market Estimates and Forecast, 2016-2028 (US$ Bn)
9.5.4.2. Italy H2-Receptor Antagonists, By Types, 2016-2028 (US$ Bn)
9.5.4.3. Italy H2-Receptor Antagonists, By Application, 2016-2028 (US$ Bn)
9.5.4.4. Italy H2-Receptor Antagonists, By Dosage Form, 2016-2028 (US$ Bn)
9.5.4.5. Italy H2-Receptor Antagonists, By Distribution Channel, 2016-2028 (US$ Bn)
9.5.5. Spain
9.5.5.1. Spain H2-Receptor Antagonists Market Estimates and Forecast, 2016-2028 (US$ Bn)
9.5.5.2. Spain H2-Receptor Antagonists, By Types, 2016-2028 (US$ Bn)
9.5.5.3. Spain H2-Receptor Antagonists, By Application, 2016-2028 (US$ Bn)
9.5.5.4. Spain H2-Receptor Antagonists, By Dosage Form, 2016-2028 (US$ Bn)
9.5.5.5. Spain H2-Receptor Antagonists, By Distribution Channel, 2016-2028 (US$ Bn)
9.5.6. Rest of Europe
9.5.6.1. Rest of Europe H2-Receptor Antagonists Market Estimates and Forecast, 2016-2028 (US$ Bn)
9.5.6.2. Rest of Europe H2-Receptor Antagonists, By Types, 2016-2028 (US$ Bn)
9.5.6.3. Rest of Europe H2-Receptor Antagonists, By Application, 2016-2028 (US$ Bn)
9.5.6.4. Rest of Europe H2-Receptor Antagonists, By Dosage Form, 2016-2028 (US$ Bn)
9.5.6.5. Rest of Europe H2-Receptor Antagonists, By Distribution Channel, 2016-2028 (US$ Bn)

10. Asia Pacific H2-Receptor Antagonists Market Analysis
10.1. Asia Pacific H2-Receptor Antagonists Market, by Types, 2016-2028(US$ Bn)
10.1.1. Overview
10.1.2. SRC Analysis
10.2. Asia Pacific H2-Receptor Antagonists Market, by Application, 2016-2028(US$ Bn)
10.2.1. Overview
10.2.2. SRC Analysis
10.3. Asia Pacific H2-Receptor Antagonists Market, by Dosage Form, 2016-2028(US$ Bn)
10.3.1. Overview
10.3.2. SRC Analysis
10.4. Asia Pacific H2-Receptor Antagonists Market, by Distribution Channel, 2016-2028(US$ Bn)
10.4.1. Overview
10.4.2. SRC Analysis
10.5. Asia Pacific H2-Receptor Antagonists Market, by Country, 2016-2028 (US$ Bn)
10.5.1. China
10.5.1.1. China H2-Receptor Antagonists Market Estimates and Forecast, 2016-2028 (US$ Bn)
10.5.1.2. China H2-Receptor Antagonists, By Types, 2016-2028 (US$ Bn)
10.5.1.3. China H2-Receptor Antagonists, By Application, 2016-2028 (US$ Bn)
10.5.1.4. China H2-Receptor Antagonists, By Dosage Form, 2016-2028 (US$ Bn)
10.5.1.5. China H2-Receptor Antagonists, By Distribution Channel, 2016-2028 (US$ Bn)
10.5.2. Japan
10.5.2.1. Japan H2-Receptor Antagonists Market Estimates and Forecast, 2016-2028 (US$ Bn)
10.5.2.2. Japan H2-Receptor Antagonists, By Types, 2016-2028 (US$ Bn)
10.5.2.3. Japan H2-Receptor Antagonists, By Application, 2016-2028 (US$ Bn)
10.5.2.4. Japan H2-Receptor Antagonists, By Dosage Form, 2016-2028 (US$ Bn)
10.5.2.5. Japan H2-Receptor Antagonists, By Distribution Channel, 2016-2028 (US$ Bn)
10.5.3. India
10.5.3.1. India H2-Receptor Antagonists Market Estimates and Forecast, 2016-2028 (US$ Bn)
10.5.3.2. India H2-Receptor Antagonists, By Types, 2016-2028 (US$ Bn)
10.5.3.3. India H2-Receptor Antagonists, By Application, 2016-2028 (US$ Bn)
10.5.3.4. India H2-Receptor Antagonists, By Dosage Form, 2016-2028 (US$ Bn)
10.5.3.5. India H2-Receptor Antagonists, By Distribution Channel, 2016-2028 (US$ Bn)
10.5.4. South Korea
10.5.4.1. South Korea H2-Receptor Antagonists Market Estimates and Forecast, 2016-2028 (US$ Bn)
10.5.4.2. South Korea H2-Receptor Antagonists, By Types, 2016-2028 (US$ Bn)
10.5.4.3. South Korea H2-Receptor Antagonists, By Application, 2016-2028 (US$ Bn)
10.5.4.4. South Korea H2-Receptor Antagonists, By Dosage Form, 2016-2028 (US$ Bn)
10.5.4.5. South Korea H2-Receptor Antagonists, By Distribution Channel, 2016-2028 (US$ Bn)
10.5.5. South-East Asia
10.5.5.1. South-East Asia H2-Receptor Antagonists Market Estimates and Forecast, 2016-2028 (US$ Bn)
10.5.5.2. South-East Asia H2-Receptor Antagonists, By Types, 2016-2028 (US$ Bn)
10.5.5.3. South-East Asia H2-Receptor Antagonists, By Application, 2016-2028 (US$ Bn)
10.5.5.4. South-East Asia H2-Receptor Antagonists, By Dosage Form, 2016-2028 (US$ Bn)
10.5.5.5. South-East Asia H2-Receptor Antagonists, By Distribution Channel, 2016-2028 (US$ Bn)
10.5.6. Rest of Asia Pacific
10.5.6.1. Rest of Asia Pacific H2-Receptor Antagonists Market Estimates and Forecast, 2016-2028 (US$ Bn)
10.5.6.2. Rest of Asia Pacific H2-Receptor Antagonists, By Types, 2016-2028 (US$ Bn)
10.5.6.3. Rest of Asia Pacific H2-Receptor Antagonists, By Application, 2016-2028 (US$ Bn)
10.5.6.4. Rest of Asia Pacific H2-Receptor Antagonists, By Dosage Form, 2016-2028 (US$ Bn)
10.5.6.5. Rest of Asia Pacific H2-Receptor Antagonists, By Distribution Channel, 2016-2028 (US$ Bn)

11. Latin America H2-Receptor Antagonists Market Analysis
11.1. Latin America H2-Receptor Antagonists Market, by Types, 2016-2028(US$ Bn)
11.1.1. Overview
11.1.2. SRC Analysis
11.2. Latin America H2-Receptor Antagonists Market, by Application, 2016-2028(US$ Bn)
11.2.1. Overview
11.2.2. SRC Analysis
11.3. Latin America H2-Receptor Antagonists Market, by Dosage Form, 2016-2028(US$ Bn)
11.3.1. Overview
11.3.2. SRC Analysis
11.4. Latin America H2-Receptor Antagonists Market, by Distribution Channel, 2016-2028(US$ Bn)
11.4.1. Overview
11.4.2. SRC Analysis
11.5. Latin America H2-Receptor Antagonists Market, by Country, 2016-2028 (US$ Bn)
11.5.1. Brazil
11.5.1.1. Brazil H2-Receptor Antagonists Market Estimates and Forecast, 2016-2028 (US$ Bn)
11.5.1.2. Brazil H2-Receptor Antagonists, By Types, 2016-2028 (US$ Bn)
11.5.1.3. Brazil H2-Receptor Antagonists, By Application, 2016-2028 (US$ Bn)
11.5.1.4. Brazil H2-Receptor Antagonists, By Dosage Form, 2016-2028 (US$ Bn)
11.5.1.5. Brazil H2-Receptor Antagonists, By Distribution Channel, 2016-2028 (US$ Bn)
11.5.2. Mexico
11.5.2.1. Mexico H2-Receptor Antagonists Market Estimates and Forecast, 2016-2028 (US$ Bn)
11.5.2.2. Mexico H2-Receptor Antagonists, By Types, 2016-2028 (US$ Bn)
11.5.2.3. Mexico H2-Receptor Antagonists, By Application, 2016-2028 (US$ Bn)
11.5.2.4. Mexico H2-Receptor Antagonists, By Dosage Form, 2016-2028 (US$ Bn)
11.5.2.5. Mexico H2-Receptor Antagonists, By Distribution Channel, 2016-2028 (US$ Bn)
11.5.3. Rest of Latin America
11.5.3.1. Rest of Latin America H2-Receptor Antagonists Market Estimates and Forecast, 2016-2028 (US$ Bn)
11.5.3.2. Rest of Latin America H2-Receptor Antagonists, By Types, 2016-2028 (US$ Bn)
11.5.3.3. Rest of Latin America H2-Receptor Antagonists, By Application, 2016-2028 (US$ Bn)
11.5.3.4. Rest of Latin America H2-Receptor Antagonists, By Dosage Form, 2016-2028 (US$ Bn)
11.5.3.5. Rest of Latin America H2-Receptor Antagonists, By Distribution Channel, 2016-2028 (US$ Bn)

12. Middle East and Africa H2-Receptor Antagonists Market Analysis
12.1. Middle East and Africa H2-Receptor Antagonists Market, by Types, 2016-2028(US$ Bn)
12.1.1. Overview
12.1.2. SRC Analysis
12.2. Middle East and Africa H2-Receptor Antagonists Market, by Application, 2016-2028(US$ Bn)
12.2.1. Overview
12.2.2. SRC Analysis
12.3. Middle East and Africa H2-Receptor Antagonists Market, by Dosage Form, 2016-2028(US$ Bn)
12.3.1. Overview
12.3.2. SRC Analysis
12.4. Middle East and Africa H2-Receptor Antagonists Market, by Distribution Channel, 2016-2028(US$ Bn)
12.4.1. Overview
12.4.2. SRC Analysis
12.5. Middle East and Africa H2-Receptor Antagonists Market, by Country, 2016-2028 (US$ Bn)
12.5.1. GCC Countries
12.5.1.1. GCC Countries H2-Receptor Antagonists Market Estimates and Forecast, 2016-2028 (US$ Bn)
12.5.1.2. GCC Countries H2-Receptor Antagonists, By Types, 2016-2028 (US$ Bn)
12.5.1.3. GCC Countries H2-Receptor Antagonists, By Application, 2016-2028 (US$ Bn)
12.5.1.4. GCC Countries H2-Receptor Antagonists, By Dosage Form, 2016-2028 (US$ Bn)
12.5.1.5. GCC Countries H2-Receptor Antagonists, By Distribution Channel, 2016-2028 (US$ Bn)
12.5.2. South Africa
12.5.2.1. South Africa H2-Receptor Antagonists Market Estimates and Forecast, 2016-2028 (US$ Bn)
12.5.2.2. South Africa H2-Receptor Antagonists, By Types, 2016-2028 (US$ Bn)
12.5.2.3. South Africa H2-Receptor Antagonists, By Application, 2016-2028 (US$ Bn)
12.5.2.4. South Africa H2-Receptor Antagonists, By Dosage Form, 2016-2028 (US$ Bn)
12.5.2.5. South Africa H2-Receptor Antagonists, By Distribution Channel, 2016-2028 (US$ Bn)
12.5.3. Rest of Middle East and Africa
12.5.3.1. Rest of Middle East and Africa H2-Receptor Antagonists Market Estimates and Forecast, 2016-2028 (US$ Bn)
12.5.3.2. Rest of Middle East and Africa H2-Receptor Antagonists, By Types, 2016-2028 (US$ Bn)
12.5.3.3. Rest of Middle East and Africa H2-Receptor Antagonists, By Application, 2016-2028 (US$ Bn)
12.5.3.4. Rest of Middle East and Africa H2-Receptor Antagonists, By Dosage Form, 2016-2028 (US$ Bn)
12.5.3.5. Rest of Middle East and Africa H2-Receptor Antagonists, By Distribution Channel, 2016-2028 (US$ Bn)

13. Company Profiles
13.1. Fresenius SE & Co. KgaA
13.1.1. Company Overview
13.1.2. Products/Services Portfolio
13.1.3. Geographical Presence
13.1.4. Financial Summary
13.1.4.1. Market Revenue and Net Profit (2019-2021)
13.1.4.2. Business Segment Revenue Analysis
13.1.4.3. Geographical Revenue Analysis
13.2. Mylan N.V.
13.3. Teva Pharmaceutical
13.4. GlaxoSmithKline plc
13.5. Hospira Inc
13.6. Apotex Inc
13.7. Merck & Company Inc
13.8. Perrigo Company plc
13.9. AbbVie
13.10. F. Hoffmann-La Roche AG
13.11. Celgene
13.12. EA Pharma Co. Ltd.
13.13. Others

List of Figures
FIG. 1 Global H2-Receptor Antagonists Market: Research Methodology
FIG. 2 Market Size Estimation – Top Down & Bottom up Approach
FIG. 3 Global H2-Receptor Antagonists Market Segmentation
FIG. 4 Global H2-Receptor Antagonists Market, by Types, 2021 (US$ Bn)
FIG. 5 Global H2-Receptor Antagonists Market, by Application, 2021 (US$ Bn)
FIG. 6 Global H2-Receptor Antagonists Market, by Dosage Form, 2021 (US$ Bn)
FIG. 7 Global H2-Receptor Antagonists Market, by Distribution Channel, 2021 (US$ Bn)
FIG. 8 Global H2-Receptor Antagonists Market, by Geography, 2021 (US$ Bn)
FIG. 9 Attractive Investment Proposition, by Types, 2021
FIG. 10 Attractive Investment Proposition, by Application, 2021
FIG. 11 Attractive Investment Proposition, by Dosage Form, 2021
FIG. 12 Attractive Investment Proposition, by Distribution Channel, 2021
FIG. 13 Attractive Investment Proposition, by Geography, 2021
FIG. 14 Global Market Share Analysis of Key H2-Receptor Antagonists Market Manufacturers, 2021
FIG. 15 Global Market Positioning of Key H2-Receptor Antagonists Market Manufacturers, 2021
FIG. 16 Global H2-Receptor Antagonists Market Value Contribution, By Types, 2021 & 2028 (Value %)
FIG. 17 Global H2-Receptor Antagonists Market, by Famotidine, Value, 2016-2028 (US$ Bn)
FIG. 18 Global H2-Receptor Antagonists Market, by Cimetidine, Value, 2016-2028 (US$ Bn)
FIG. 19 Global H2-Receptor Antagonists Market, by Ranitidine, Value, 2016-2028 (US$ Bn)
FIG. 20 Global H2-Receptor Antagonists Market, by Nizatidine, Value, 2016-2028 (US$ Bn)
FIG. 21 Global H2-Receptor Antagonists Market Value Contribution, By Application, 2021 & 2028 (Value %)
FIG. 22 Global H2-Receptor Antagonists Market, by Gastritis, Value, 2016-2028 (US$ Bn)
FIG. 23 Global H2-Receptor Antagonists Market, by Peptic Ulcers, Value, 2016-2028 (US$ Bn)
FIG. 24 Global H2-Receptor Antagonists Market, by Zollinger-Ellison Syndrome, Value, 2016-2028 (US$ Bn)
FIG. 25 Global H2-Receptor Antagonists Market, by Allergies, Value, 2016-2028 (US$ Bn)
FIG. 26 Global H2-Receptor Antagonists Market, by Others, Value, 2016-2028 (US$ Bn)
FIG. 27 Global H2-Receptor Antagonists Market Value Contribution, By Dosage Form, 2021 & 2028 (Value %)
FIG. 28 Global H2-Receptor Antagonists Market, by Tablet, Value, 2016-2028 (US$ Bn)
FIG. 29 Global H2-Receptor Antagonists Market, by S-Band, Value, 2016-2028 (US$ Bn)
FIG. 30 Global H2-Receptor Antagonists Market, by Powder/Suspension, Value, 2016-2028 (US$ Bn)
FIG. 31 Global H2-Receptor Antagonists Market, by Syrup, Value, 2016-2028 (US$ Bn)
FIG. 32 Global H2-Receptor Antagonists Market, by Injectable, Value, 2016-2028 (US$ Bn)
FIG. 33 Global H2-Receptor Antagonists Market, by Others, Value, 2016-2028 (US$ Bn)
FIG. 34 Global H2-Receptor Antagonists Market Value Contribution, By Distribution Channel, 2021 & 2028 (Value %)
FIG. 35 Global H2-Receptor Antagonists Market, by Hospital Pharmacies, Value, 2016-2028 (US$ Bn)
FIG. 36 Global H2-Receptor Antagonists Market, by Retail Pharmacies, Value, 2016-2028 (US$ Bn)
FIG. 37 Global H2-Receptor Antagonists Market, by Online Pharmacies, Value, 2016-2028 (US$ Bn)
FIG. 38 Global H2-Receptor Antagonists Market, by Others, Value, 2016-2028 (US$ Bn)
FIG. 39 U.S. H2-Receptor Antagonists Market, 2016-2028 (US$ Bn)
FIG. 40 Canada H2-Receptor Antagonists Market, 2016-2028 (US$ Bn)
FIG. 41 Germany H2-Receptor Antagonists Market, 2016-2028 (US$ Bn)
FIG. 42 France H2-Receptor Antagonists Market, 2016-2028 (US$ Bn)
FIG. 43 U.K. H2-Receptor Antagonists Market, 2016-2028 (US$ Bn)
FIG. 44 Italy H2-Receptor Antagonists Market, 2016-2028 (US$ Bn)
FIG. 45 Spain H2-Receptor Antagonists Market, 2016-2028 (US$ Bn)
FIG. 46 Rest of Europe H2-Receptor Antagonists Market, 2016-2028 (US$ Bn)
FIG. 47 China H2-Receptor Antagonists Market, 2016-2028 (US$ Bn)
FIG. 48 Japan H2-Receptor Antagonists Market, 2016-2028 (US$ Bn)
FIG. 49 India H2-Receptor Antagonists Market, 2016-2028 (US$ Bn)
FIG. 50 South Korea H2-Receptor Antagonists Market, 2016-2028 (US$ Bn)
FIG. 51 Southeast Asia H2-Receptor Antagonists Market, 2016-2028 (US$ Bn)
FIG. 52 Rest of Asia Pacific H2-Receptor Antagonists Market, 2016-2028 (US$ Bn)
FIG. 53 Latin America H2-Receptor Antagonists Market, 2016-2028 (US$ Bn)
FIG. 54 Brazil H2-Receptor Antagonists Market, 2016-2028 (US$ Bn)
FIG. 55 Mexico H2-Receptor Antagonists Market, 2016-2028 (US$ Bn)
FIG. 56 Rest of Latin America H2-Receptor Antagonists Market, 2016-2028 (US$ Bn)
FIG. 57 Middle East & Africa H2-Receptor Antagonists Market, 2016-2028 (US$ Bn)
FIG. 58 GCC Countries H2-Receptor Antagonists Market, 2016-2028 (US$ Bn)
FIG. 59 South Africa H2-Receptor Antagonists Market, 2016-2028 (US$ Bn)
FIG. 60 Rest of Middle East and Africa H2-Receptor Antagonists Market, 2016-2028 (US$ Bn)

List of Tables
TABLE 1 Market Snapshot: Global H2-Receptor Antagonists Market
TABLE 2 Global H2-Receptor Antagonists Market, by Competitive Benchmarking, 2021
TABLE 3 Global H2-Receptor Antagonists Market, by Geographical Presence Analysis, 2021
TABLE 4 Global H2-Receptor Antagonists Market, by Key Strategies Analysis, 2021
TABLE 5 Global H2-Receptor Antagonists Market, by Types, 2016-2028 (US$ Bn)
TABLE 6 Global H2-Receptor Antagonists Market, by Application, 2016-2028 (US$ Bn)
TABLE 7 Global H2-Receptor Antagonists Market, by Dosage Form, 2016-2028 (US$ Bn)
TABLE 8 Global H2-Receptor Antagonists Market, by Distribution Channel, 2016-2028 (US$ Bn)
TABLE 9 Global H2-Receptor Antagonists Market, by Geography, 2016-2028 (US$ Bn)
TABLE 10 North America H2-Receptor Antagonists Market, by Types, 2016-2028 (US$ Bn)
TABLE 11 North America H2-Receptor Antagonists Market, by Application, 2016-2028 (US$ Bn)
TABLE 12 North America H2-Receptor Antagonists Market, by Dosage Form, 2016-2028 (US$ Bn)
TABLE 13 North America H2-Receptor Antagonists Market, by Distribution Channel, 2016-2028 (US$ Bn)
TABLE 14 North America H2-Receptor Antagonists Market, by Country, 2016-2028 (US$ Bn)
TABLE 15 US H2-Receptor Antagonists Market, by Types, 2016-2028 (US$ Bn)
TABLE 16 US H2-Receptor Antagonists Market, by Application, 2016-2028 (US$ Bn)
TABLE 17 US H2-Receptor Antagonists Market, by Dosage Form, 2016-2028 (US$ Bn)
TABLE 18 US H2-Receptor Antagonists Market, by Distribution Channel, 2016-2028 (US$ Bn)
TABLE 19 Canada H2-Receptor Antagonists Market, by Types, 2016-2028 (US$ Bn)
TABLE 20 Canada H2-Receptor Antagonists Market, by Application, 2016-2028 (US$ Bn)
TABLE 21 Canada H2-Receptor Antagonists Market, by Dosage Form, 2016-2028 (US$ Bn)
TABLE 22 Canada H2-Receptor Antagonists Market, by Distribution Channel, 2016-2028 (US$ Bn)
TABLE 23 Europe H2-Receptor Antagonists Market, by Types, 2016-2028 (US$ Bn)
TABLE 24 Europe H2-Receptor Antagonists Market, by Application, 2016-2028 (US$ Bn)
TABLE 25 Europe H2-Receptor Antagonists Market, by Dosage Form, 2016-2028 (US$ Bn)
TABLE 26 Europe H2-Receptor Antagonists Market, by Distribution Channel, 2016-2028 (US$ Bn)
TABLE 27 Europe H2-Receptor Antagonists Market, by Country, 2016-2028 (US$ Bn)
TABLE 28 Germany H2-Receptor Antagonists Market, by Types, 2016-2028 (US$ Bn)
TABLE 29 Germany H2-Receptor Antagonists Market, by Application, 2016-2028 (US$ Bn)
TABLE 30 Germany H2-Receptor Antagonists Market, by Dosage Form, 2016-2028 (US$ Bn)
TABLE 31 Germany H2-Receptor Antagonists Market, by Distribution Channel, 2016-2028 (US$ Bn)
TABLE 32 France H2-Receptor Antagonists Market, by Types, 2016-2028 (US$ Bn)
TABLE 33 France H2-Receptor Antagonists Market, by Application, 2016-2028 (US$ Bn)
TABLE 34 France H2-Receptor Antagonists Market, by Dosage Form, 2016-2028 (US$ Bn)
TABLE 35 France H2-Receptor Antagonists Market, by Distribution Channel, 2016-2028 (US$ Bn)
TABLE 36 UK H2-Receptor Antagonists Market, by Types, 2016-2028 (US$ Bn)
TABLE 37 UK H2-Receptor Antagonists Market, by Application, 2016-2028 (US$ Bn)
TABLE 38 UK H2-Receptor Antagonists Market, by Dosage Form, 2016-2028 (US$ Bn)
TABLE 39 UK H2-Receptor Antagonists Market, by Distribution Channel, 2016-2028 (US$ Bn)
TABLE 40 Italy H2-Receptor Antagonists Market, by Types, 2016-2028 (US$ Bn)
TABLE 41 Italy H2-Receptor Antagonists Market, by Application, 2016-2028 (US$ Bn)
TABLE 42 Italy H2-Receptor Antagonists Market, by Dosage Form, 2016-2028 (US$ Bn)
TABLE 43 Italy H2-Receptor Antagonists Market, by Distribution Channel, 2016-2028 (US$ Bn)
TABLE 44 Spain H2-Receptor Antagonists Market, by Types, 2016-2028 (US$ Bn)
TABLE 45 Spain H2-Receptor Antagonists Market, by Application, 2016-2028 (US$ Bn)
TABLE 46 Spain H2-Receptor Antagonists Market, by Dosage Form, 2016-2028 (US$ Bn)
TABLE 47 Spain H2-Receptor Antagonists Market, by Distribution Channel, 2016-2028 (US$ Bn)
TABLE 48 Rest of Europe H2-Receptor Antagonists Market, by Types, 2016-2028 (US$ Bn)
TABLE 49 Rest of Europe H2-Receptor Antagonists Market, by Application, 2016-2028 (US$ Bn)
TABLE 50 Rest of Europe H2-Receptor Antagonists Market, by Dosage Form, 2016-2028 (US$ Bn)
TABLE 51 Rest of Europe H2-Receptor Antagonists Market, by Distribution Channel, 2016-2028 (US$ Bn)
TABLE 52 Asia Pacific H2-Receptor Antagonists Market, by Types, 2016-2028 (US$ Bn)
TABLE 53 Asia Pacific H2-Receptor Antagonists Market, by Application, 2016-2028 (US$ Bn)
TABLE 54 Asia Pacific H2-Receptor Antagonists Market, by Dosage Form, 2016-2028 (US$ Bn)
TABLE 55 Asia Pacific H2-Receptor Antagonists Market, by Distribution Channel, 2016-2028 (US$ Bn)
TABLE 56 Asia Pacific H2-Receptor Antagonists Market, by Country, 2016-2028 (US$ Bn)
TABLE 57 China H2-Receptor Antagonists Market, by Types, 2016-2028 (US$ Bn)
TABLE 58 China H2-Receptor Antagonists Market, by Application, 2016-2028 (US$ Bn)
TABLE 59 China H2-Receptor Antagonists Market, by Dosage Form, 2016-2028 (US$ Bn)
TABLE 60 China H2-Receptor Antagonists Market, by Distribution Channel, 2016-2028 (US$ Bn)
TABLE 61 Japan H2-Receptor Antagonists Market, by Types, 2016-2028 (US$ Bn)
TABLE 62 Japan H2-Receptor Antagonists Market, by Application, 2016-2028 (US$ Bn)
TABLE 63 Japan H2-Receptor Antagonists Market, by Dosage Form, 2016-2028 (US$ Bn)
TABLE 64 Japan H2-Receptor Antagonists Market, by Distribution Channel, 2016-2028 (US$ Bn)
TABLE 65 India H2-Receptor Antagonists Market, by Types, 2016-2028 (US$ Bn)
TABLE 66 India H2-Receptor Antagonists Market, by Application, 2016-2028 (US$ Bn)
TABLE 67 India H2-Receptor Antagonists Market, by Dosage Form, 2016-2028 (US$ Bn)
TABLE 68 India H2-Receptor Antagonists Market, by Distribution Channel, 2016-2028 (US$ Bn)
TABLE 69 South Korea H2-Receptor Antagonists Market, by Types, 2016-2028 (US$ Bn)
TABLE 70 South Korea H2-Receptor Antagonists Market, by Application, 2016-2028 (US$ Bn)
TABLE 71 South Korea H2-Receptor Antagonists Market, by Dosage Form, 2016-2028 (US$ Bn)
TABLE 72 South Korea H2-Receptor Antagonists Market, by Distribution Channel, 2016-2028 (US$ Bn)
TABLE 73 South East Asia H2-Receptor Antagonists Market, by Types, 2016-2028 (US$ Bn)
TABLE 74 South East Asia H2-Receptor Antagonists Market, by Application, 2016-2028 (US$ Bn)
TABLE 75 South East Asia H2-Receptor Antagonists Market, by Dosage Form, 2016-2028 (US$ Bn)
TABLE 76 South East Asia H2-Receptor Antagonists Market, by Distribution Channel, 2016-2028 (US$ Bn)
TABLE 77 Rest of Asia Pacific H2-Receptor Antagonists Market, by Types, 2016-2028 (US$ Bn)
TABLE 78 Rest of Asia Pacific H2-Receptor Antagonists Market, by Application, 2016-2028 (US$ Bn)
TABLE 79 Rest of Asia Pacific H2-Receptor Antagonists Market, by Dosage Form, 2016-2028 (US$ Bn)
TABLE 80 Rest of Asia Pacific H2-Receptor Antagonists Market, by Distribution Channel, 2016-2028 (US$ Bn)
TABLE 81 Latin America H2-Receptor Antagonists Market, by Types, 2016-2028 (US$ Bn)
TABLE 82 Latin America H2-Receptor Antagonists Market, by Application, 2016-2028 (US$ Bn)
TABLE 83 Latin America H2-Receptor Antagonists Market, by Dosage Form, 2016-2028 (US$ Bn)
TABLE 84 Latin America H2-Receptor Antagonists Market, by Distribution Channel, 2016-2028 (US$ Bn)
TABLE 85 Latin America H2-Receptor Antagonists Market, by Country, 2016-2028 (US$ Bn)
TABLE 86 Brazil H2-Receptor Antagonists Market, by Types, 2016-2028 (US$ Bn)
TABLE 87 Brazil H2-Receptor Antagonists Market, by Application, 2016-2028 (US$ Bn)
TABLE 88 Brazil H2-Receptor Antagonists Market, by Dosage Form, 2016-2028 (US$ Bn)
TABLE 89 Brazil H2-Receptor Antagonists Market, by Distribution Channel, 2016-2028 (US$ Bn)
TABLE 90 Mexico H2-Receptor Antagonists Market, by Types, 2016-2028 (US$ Bn)
TABLE 91 Mexico H2-Receptor Antagonists Market, by Application, 2016-2028 (US$ Bn)
TABLE 92 Mexico H2-Receptor Antagonists Market, by Dosage Form, 2016-2028 (US$ Bn)
TABLE 93 Mexico H2-Receptor Antagonists Market, by Distribution Channel, 2016-2028 (US$ Bn)
TABLE 94 Rest of Latin America H2-Receptor Antagonists Market, by Types, 2016-2028 (US$ Bn)
TABLE 95 Rest of Latin America H2-Receptor Antagonists Market, by Application, 2016-2028 (US$ Bn)
TABLE 96 Rest of Latin America H2-Receptor Antagonists Market, by Dosage Form, 2016-2028 (US$ Bn)
TABLE 97 Rest of Latin America H2-Receptor Antagonists Market, by Distribution Channel, 2016-2028 (US$ Bn)
TABLE 98 Middle East and Africa H2-Receptor Antagonists Market, by Types, 2016-2028 (US$ Bn)
TABLE 99 Middle East and Africa H2-Receptor Antagonists Market, by Application, 2016-2028 (US$ Bn)
TABLE 100 Middle East and Africa H2-Receptor Antagonists Market, by Dosage Form, 2016-2028 (US$ Bn)
TABLE 101 Middle East and Africa H2-Receptor Antagonists Market, by Distribution Channel, 2016-2028 (US$ Bn)
TABLE 102 Middle East and Africa H2-Receptor Antagonists Market, by Country, 2016-2028 (US$ Bn)
TABLE 103 GCC Countries H2-Receptor Antagonists Market, by Types, 2016-2028 (US$ Bn)
TABLE 104 GCC Countries H2-Receptor Antagonists Market, by Application, 2016-2028 (US$ Bn)
TABLE 105 GCC Countries H2-Receptor Antagonists Market, by Dosage Form, 2016-2028 (US$ Bn)
TABLE 106 GCC Countries H2-Receptor Antagonists Market, by Distribution Channel, 2016-2028 (US$ Bn)
TABLE 107 South Africa H2-Receptor Antagonists Market, by Types, 2016-2028 (US$ Bn)
TABLE 108 South Africa H2-Receptor Antagonists Market, by Application, 2016-2028 (US$ Bn)
TABLE 109 South Africa H2-Receptor Antagonists Market, by Dosage Form, 2016-2028 (US$ Bn)
TABLE 110 South Africa H2-Receptor Antagonists Market, by Distribution Channel, 2016-2028 (US$ Bn)
TABLE 111 Rest of Middle East and Africa H2-Receptor Antagonists Market, by Types, 2016-2028 (US$ Bn)
TABLE 112 Rest of Middle East and Africa H2-Receptor Antagonists Market, by Application, 2016-2028 (US$ Bn)
TABLE 113 Rest of Middle East and Africa H2-Receptor Antagonists Market, by Dosage Form, 2016-2028 (US$ Bn)
TABLE 114 Rest of Middle East and Africa H2-Receptor Antagonists Market, by Distribution Channel, 2016-2028 (US$ Bn)

Frequently Asked Questions:

How does COVID-19 impact the global H2-receptor antagonists market?

The COVID-19 pandemic also impacted the global H2-receptor antagonists market, resulting in an XX% drop in revenue in 2020.

Which is the leading region of the market for H2-receptor antagonists?

In 2021, North America held the major revenue share of the global H2-receptor antagonists market.

What are the key drivers for the growth of the H2-receptor antagonists market?

The rising prevalence of gastrointestinal disorders, growing awareness about the benefits of using H2-receptor antagonists, and increasing preference for over-the-counter (OTC) drugs are driving global market growth.

Which is the major segment in the H2-receptor antagonists market by type?

The ranitidine segment had a major global market revenue share in 2021.

Which is the major segment in the H2-receptor antagonists market by application?

In 2021, the peptic ulcer segment had a major global market revenue share.

Prostate Cancer Market

Published:
Report ID: 36273

Antineoplastic Agents Market

Published:
Report ID: 36065

US Retail Pharmacy Market

Published:
Report ID: 32801

OTC Vitamins Dietary Supplements Market

Published:
Report ID: 35994

Liposomes Market

Published:
Report ID: 35888

UK Iron Supplement Market

Published:
Report ID: 35709

U.S. Iron Supplement Market

Published:
Report ID: 35688

Malignant Ascites Market

Published:
Report ID: 11184

Middle East and Africa In-Vitro Fertilization (IVF) Market

Published:
Report ID: 35578

Chronic Myeloid Leukemia (CML) Treatment Market

Published:
Report ID: 2939

Combination Therapies In Aesthetics Market

Published:
Report ID: 35434

CAR T-Cell Therapy Market

Published:
Report ID: 2051

Purchase Options

$2999
Delivery Format: Excel.
$4999
Designed for the individual purchaser.
$6999
Users located at a single corporate site or regional office.
$7999
Allowed for unlimited sharing globally within one company.
Smallform of Sample request

Have a question?

User Profile

Don’t settle for less – trust Mitul to help you find the best solution.

Report delivery within 24 to 48 hours

– Other Info –

What people say?-

User Review

I am very impressed with the information in this report. The author clearly did their research when they came up with this product and it has already given me a lot of ideas.

Jana Schmidt
CEDAR CX Technologies

– Connect with us –

Phone

+91 6232 49 3207


support

24/7 Research Support


sales@credenceresearch.com

– Research Methodology –

Going beyond the basics: advanced techniques in research methodology

– Trusted By –

Pepshi, LG, Nestle
Motorola, Honeywell, Johnson and johnson
LG Chem, SIEMENS, Pfizer
Unilever, Samsonite, QIAGEN