
Market Overview
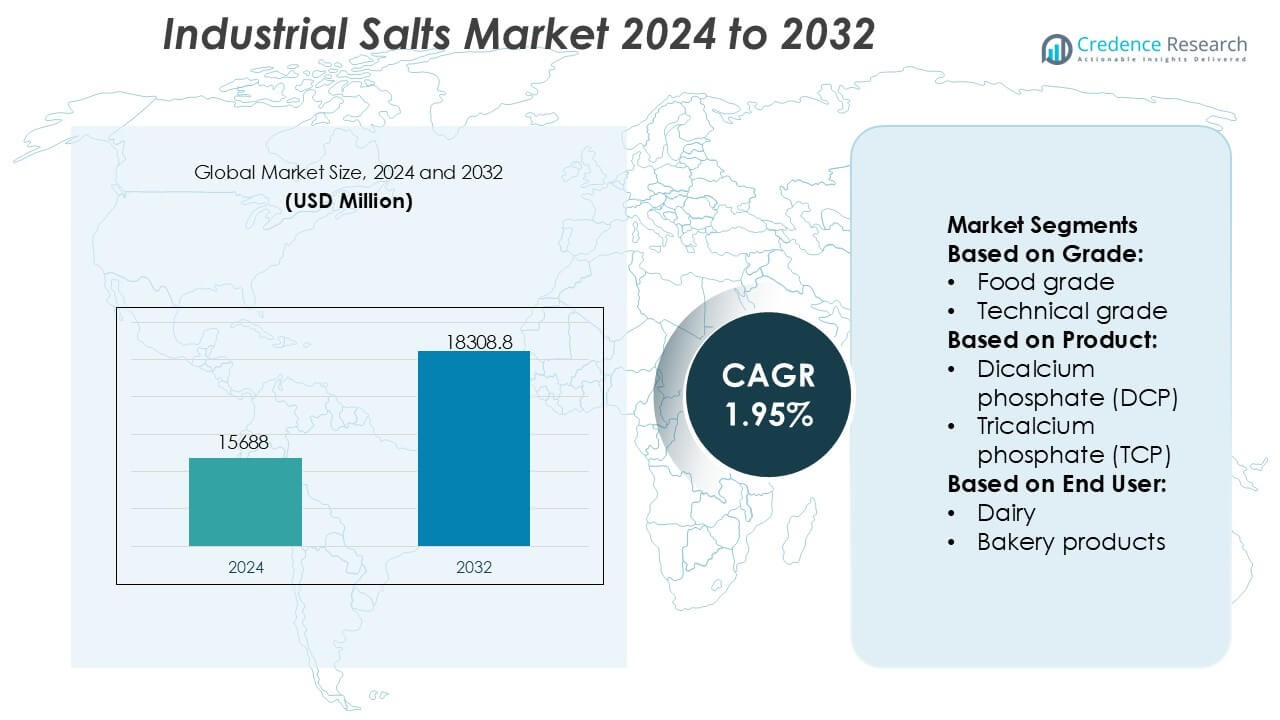
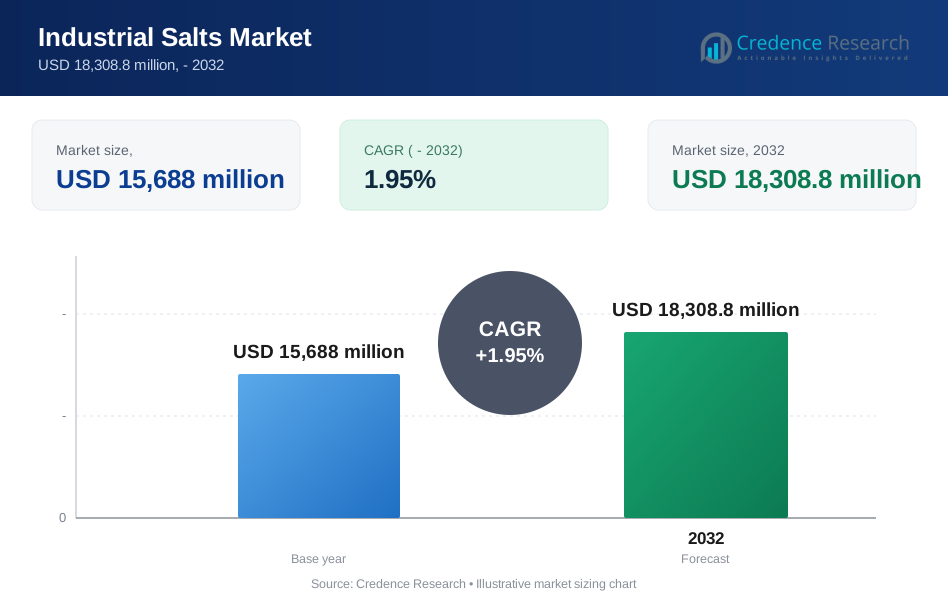
Industrial Salts Market size was valued USD 15688 million in 2024 and is anticipated to reach USD 18308.8 million by 2032, at a CAGR of 1.95% during the forecast period.
| REPORT ATTRIBUTE | DETAILS |
|---|---|
| Historical Period | 2020-2023 |
| Base Year | 2024 |
| Forecast Period | 2025-2032 |
| Industrial Salts Market Size 2024 | USD 15688 Million |
| Industrial Salts Market, CAGR | 1.95% |
| Industrial Salts Market Size 2032 | USD 18308.8 Million |
The Industrial Salts Market is shaped by a mix of globally established producers and regionally integrated suppliers that strengthen their competitiveness through advanced extraction capabilities, large-scale refining operations, and diversified product portfolios serving food processing, chemicals, water treatment, and industrial manufacturing. Companies emphasize high-purity grades, sustainable mining methods, and automated brine processing to meet rising quality and regulatory requirements across end-use sectors. Asia-Pacific leads the global market with an exact 38% share, supported by extensive chemical production, rapid industrial expansion, and strong utilization in water treatment and processed food applications, reinforcing its position as the dominant regional hub.
Market Insights
- Industrial Salts Market size reached USD 15,688 million in 2024 and will attain USD 18,308.8 million by 2032 at a CAGR of 1.95%, reflecting stable long-term demand across major industrial applications.
- Strong drivers include rising consumption in food processing, chemical manufacturing, water treatment, and metallurgical operations, supported by increasing preference for high-purity and specialty salt grades.
- Market trends highlight growing adoption of sustainable extraction technologies, automated brine processing, and refined phosphate-based salts tailored for functional performance across end-use sectors.
- Competitive intensity remains high as global and regional producers expand capacity, enhance product purity, and diversify portfolios despite restraints linked to environmental regulations and raw material variability.
- Asia-Pacific leads with an exact 38% share, while sodium polyphosphates dominate the product segment with a 31% share, supported by widespread usage in food stabilizers, industrial cleaning, and water conditioning applications.
Market Segmentation Analysis:
By Grade
Food grade salt dominates the Industrial Salts Market with an exact 46% share, supported by stringent quality standards and strong consumption across food processing applications. Its high purity level, controlled mineral profile, and compliance with regulatory benchmarks strengthen its adoption in packaged foods, dairy formulations, and beverage formulations. Technical grade salt follows due to rising demand in chemical processing, de-icing, and industrial manufacturing. Pharmaceutical grade salt, though smaller, gains steady traction as drug makers increase reliance on ultra-refined sodium chloride for formulations requiring precise isotonicity and stability.
- For instance, INEOS Enterprises operates one of Europe’s largest vacuum salt operations at its Cheshire facility, producing more than 1,000,000 tonnes of high-purity salt annually, with vacuum-evaporated salt achieving purity levels above 99.9%, meeting strict food and pharmaceutical-grade specifications.
By Product
Among all phosphate-based industrial salts, Sodium polyphosphates lead the market with an exact 31% share, driven by strong usage of SAPP, SHMP, STPP, and TSPP across food preservation, water conditioning, and industrial cleaning. SHMP remains a key contributor owing to its high sequestration capacity and role in improving texture and moisture retention in processed foods. Ammonium and potassium phosphates witness growing adoption in fertilizers and buffering systems, while calcium phosphates gain relevance in bakery leavening and mineral fortification. Demand rises as end-use industries seek multifunctional additives that enhance stability, emulsification, and processing efficiency.
- For instance, Morton Salt operates a large-scale industrial production network that includes facilities capable of manufacturing over 250,000 tonnes of specialty food-grade salts annually, supported by precision granulation and continuous drying lines designed to maintain product moisture below 0.1 g per 100 g.
By End User
The Food & Beverage sector, led by dairy, bakery, and beverage applications, accounts for an exact 38% share, making it the dominant end-user of industrial salts. Dairy processing relies heavily on phosphates for pH control, protein stabilization, and improved melt characteristics in cheese products. Bakery manufacturers utilize leavening salts for dough conditioning and volume enhancement. Meat and seafood processors depend on phosphates to enhance moisture retention and freshness. Beyond food, water treatment and metal mining drive additional demand, benefiting from salts’ scale inhibition, flotation support, and purification properties.
Key Growth Drivers
- Expanding Utilization Across Food Processing Applications
Industrial salts experience rising demand in food processing as manufacturers prioritize consistent texture, preservation, and mineral balance in dairy, bakery, and meat products. Salt-based phosphates enhance moisture retention, stabilize proteins, and improve product shelf life, supporting large-scale commercial formulations. Growth accelerates as processed and convenience food consumption increases globally, boosting requirements for high-purity, food-grade salts. Strengthening regulatory compliance and quality certification frameworks further reinforce their adoption in standardized food manufacturing environments.
- For instance, Rio Tinto PLC operates Dampier Salt Limited, one of the world’s largest solar salt production systems, with an installed capacity exceeding 10,300,000 tonnes per year across its Dampier, Port Hedland, and Lake MacLeod sites.
- Increasing Adoption in Water Treatment and Industrial Purification
Water treatment utilities and industrial facilities rely on industrial salts to support softening, pH regulation, scale prevention, and contaminant removal. Rising investment in municipal water infrastructure and stricter norms for effluent discharge elevate demand for salts used in ion-exchange resins and purification cycles. Rapid urbanization intensifies pressure on water quality systems, prompting utilities to deploy salt-based conditioning solutions. Industrial clusters in mining, chemicals, and textiles also expand their usage as operational efficiency and equipment longevity become higher priorities.
- For instance, Delmon Salt Factory Co. Ltd operates one of the Gulf region’s largest evaporation-based salt production plants, producing more than 800,000 tonnes of high-purity salt annually, with refined grades achieving purity levels above 99.5% NaCl.
- Growing Integration in Chemical Manufacturing and Metallurgical Processes
Chemical processors and metallurgical industries increasingly integrate industrial salts to support catalytic reactions, brine electrolysis, and metal extraction. Sodium and potassium derivatives enable improved reaction control and product consistency, strengthening their relevance in chlor-alkali synthesis, dyes, detergents, and pigment production. Mining operators utilize salts as flotation enhancers and separation agents, enabling higher yield recovery. The expanding global demand for specialty chemicals and refined metals reinforces the role of industrial salts as essential raw materials in high-volume industrial value chains.
Key Trends & Opportunities
- Rising Demand for High-Purity and Specialty Salt Formulations
Manufacturers show growing interest in high-purity salts and advanced phosphate blends tailored for functional performance in food, pharmaceuticals, and precision industrial operations. Specialty grades gain traction as end users prioritize consistency, low impurities, and tight particle-size distribution. Opportunities expand for producers offering customized formulations suited for targeted applications such as controlled leavening, mineral fortification, and process stabilization. The shift toward cleaner-label ingredients and stringent quality benchmarks further supports advancements in refining technologies and specialty-grade production.
- For instance, Compass Minerals Limited operates a high-purity evaporated salt facility in Lyons, Kansas, capable of producing more than 450,000 tonnes of food-grade and industrial-grade salt annually. Its refining line incorporates a multistage crystal purification system that consistently delivers NaCl purity above 99.8%, with insoluble content reduced to below 30 mg/kg.
- Expansion of Application Scope in Meat, Seafood, and Dairy Processing
Industrial salts gain broader adoption across protein processing sectors as manufacturers focus on improving yield, texture uniformity, and moisture retention. Phosphates remain essential in stabilizing emulsions, enhancing water-binding capacity, and supporting product safety through improved microbial resistance. Growing consumption of processed meat, cheese, and ready-to-cook meals expands opportunity for salt-based functional additives. Producers offering application-specific blends for marination, curing, and rehydration processes strengthen their competitive edge across evolving protein-based product lines.
- For instance, K+S Group operates its high-purity food-grade salt production line at the Werra plant, which produces more than 500,000 tonnes annually with NaCl purity above 99.9%.
- Technological Advancements in Extraction, Purification, and Processing
Innovations in mining, brine extraction, and production efficiency enable manufacturers to supply industrial salts with improved purity and optimized chemical characteristics. Automated evaporation systems, membrane filtration, and continuous crystallization technologies enhance throughput and environmental performance. Opportunities arise for producers investing in energy-efficient processing and environmentally aligned extraction models. These advancements reduce waste, improve operational reliability, and support scalable production, positioning technologically advanced manufacturers to meet rising demand across global industrial applications.
Key Challenges
- Raw Material Quality Variability and Supply Chain Dependency
Producers often face challenges associated with inconsistent raw material quality, particularly in natural brine and rock salt sources sensitive to climatic and geological factors. Variability affects purity levels, processing efficiency, and final product performance, increasing operational complexity. Supply chain fluctuations linked to mining constraints and transportation bottlenecks further elevate risk. These issues pressure manufacturers to invest in purification technologies, diversify sourcing, and develop buffer inventories to maintain reliable market supply.
- Environmental Regulations and Waste Management Constraints
Stringent regulations governing brine discharge, mining operations, and production-related emissions create operational hurdles for industrial salt manufacturers. Environmental compliance requires significant investment in waste treatment, water recycling, and low-impact extraction processes. In regions with heightened ecological scrutiny, permitting challenges and rising operational costs limit expansion opportunities. Managing byproducts and ensuring sustainable disposal practices remain critical concerns, compelling industry participants to modernize production infrastructure and adopt environmentally responsible processing frameworks.
Regional Analysis
North America
North America holds an exact 28% share of the Industrial Salts Market, supported by strong demand from chemical processing, water treatment, and food manufacturing industries. The U.S. leads consumption due to its large chlor-alkali sector and established brine extraction facilities. The region benefits from advanced mining technologies, stable regulatory frameworks, and consistent investment in municipal water infrastructure. Expanding applications in de-icing and industrial purification reinforce market growth. Rising focus on high-purity grades for pharmaceuticals and processed food applications further strengthens the region’s strategic position.
Europe
Europe accounts for an exact 24% share, driven by robust food processing, dairy production, and chemical manufacturing activities. Countries such as Germany, the Netherlands, and France maintain strong consumption levels due to extensive industrial salt usage in water softening and detergent formulations. Strict environmental regulations promote the adoption of refined salts with controlled impurity levels, supporting modernization of production systems. Demand for anti-caking agents, leavening salts, and phosphate-based additives remains stable across the food and bakery sectors. The region’s advanced mining practices and strong emphasis on sustainable processing further enhance market performance.
Asia-Pacific
Asia-Pacific dominates the Industrial Salts Market with an exact 38% share, driven by large-scale food processing, rapid industrialization, and significant expansion in water treatment infrastructure. China and India contribute the majority of demand due to extensive chemical manufacturing, pharmaceuticals, and metallurgical operations. Growing consumption of processed food amplifies the need for food-grade salts and phosphate derivatives. Rising investment in desalination plants and municipal water quality upgrades strengthens long-term demand. The region’s competitive production capabilities and abundant natural salt reserves reinforce its leadership within the global market.
Latin America
Latin America captures an exact 6% share, supported by increasing adoption of industrial salts in food processing, mining, and chemical manufacturing. Brazil and Mexico drive regional growth as expanding packaged food industries and active mineral extraction sectors elevate usage of refined salts and phosphate-based additives. Water treatment applications gain traction due to rising urbanization and infrastructure development. Although production capacity remains moderate, improving extraction technologies and supply chain optimization efforts strengthen market reliability. Growth opportunities continue to emerge as local industries shift toward consistent quality standards and value-added salt formulations.
Middle East & Africa
The Middle East & Africa region holds an exact 4% share, with demand concentrated in water treatment, desalination, and chemical manufacturing. Countries such as Saudi Arabia and the UAE rely heavily on industrial salts for brine regeneration and purification systems in large-scale desalination plants. Mining and metals sectors across South Africa and Morocco contribute additional consumption. Limited domestic production capacity drives imports of refined salts and phosphates. Ongoing investment in food processing, municipal water systems, and industrial expansion creates steady growth potential despite structural supply constraints.
Market Segmentations:
By Grade:
- Food grade
- Technical grade
By Product:
- Dicalcium phosphate (DCP)
- Tricalcium phosphate (TCP)
By End User:
- Dairy
- Bakery products
By Geography
- North America
- U.S.
- Canada
- Mexico
- Europe
- Germany
- France
- U.K.
- Italy
- Spain
- Rest of Europe
- Asia Pacific
- China
- Japan
- India
- South Korea
- South-east Asia
- Rest of Asia Pacific
- Latin America
- Brazil
- Argentina
- Rest of Latin America
- Middle East & Africa
- GCC Countries
- South Africa
- Rest of the Middle East and Africa
Competitive Landscape
The Industrial Salts Market players such as INEOS Enterprises, Morton Salt, Rio Tinto PLC, Delmon Salt Factory Co. Ltd, Compass Minerals Limited, K+S Group, Mitsui & Co. Ltd., Cargill Inc., China National Salt Industry Corporation (CNSIC), Tata Chemicals Limited. the Industrial Salts Market reflects a balanced mix of global producers, regional suppliers, and vertically integrated chemical manufacturers that actively expand their operational capabilities to meet rising industrial demand. Companies strengthen their competitiveness by investing in high-efficiency extraction methods, automated brine processing systems, and advanced purification technologies that enhance product consistency and purity levels. Many participants focus on diversifying their portfolios with specialty salts and phosphate-based derivatives tailored for food processing, water treatment, and chemical manufacturing. Strategic supply agreements, logistical optimization, and sustainable mining practices further reinforce market positioning as end users increasingly seek reliable, high-quality, and application-specific salt solutions.
Key Player Analysis
- INEOS Enterprises
- Morton Salt
- Rio Tinto PLC
- Delmon Salt Factory Co. Ltd
- Compass Minerals Limited
- K+S Group
- Mitsui & Co. Ltd.
- Cargill Inc.
- China National Salt Industry Corporation (CNSIC)
- Tata Chemicals Limited
Recent Developments
- In May 2025, Minerals Development Oman (MDO) partnered with Dev Salt for the Naqa Salt Project in Mahout, Oman, to build the region's largest solar-powered industrial salt facility, producing high-purity, bromine-rich salt for global markets, boosting Oman's mining sector and exports. The project uses sustainable solar evaporation in MDO's concession area, leveraging proximity to Duqm Port for export, and aims to meet growing industrial demand.
- In April 2025, McCormick launched five limited-edition finishing salts introducing unique flavors such as Watermelon Lime and Brown Butter. These coarse-textured salts are designed to add a final flourish of flavor, texture, and aroma to a wide variety of dishes and drinks.
- In March 2025, The Michigan Potash & Salt Co. launched its new Michigan Salt business aiming to produce of food-quality salt annually from America's newest and lowest-cost evaporative plant, a co-product of their potash fertilizer operation, meeting Midwest demand for water softening, road de-icing, and food needs while enhancing domestic supply.
- In September 2024, QatarEnergy, through its TAWTEEN localization program, formed a joint venture with Mesaieed Petrochemical Holding Company (MPHC), Qatar Industrial Manufacturing Co. (QIMC), and Turkey's Atlas Yatirim to create Qatar Salt Products Company (QSalt) in Um Al Houl, Qatar.
Report Coverage
The research report offers an in-depth analysis based on Grade, Product, End-User and Geography. It details leading market players, providing an overview of their business, product offerings, investments, revenue streams, and key applications. Additionally, the report includes insights into the competitive environment, SWOT analysis, current market trends, as well as the primary drivers and constraints. Furthermore, it discusses various factors that have driven market expansion in recent years. The report also explores market dynamics, regulatory scenarios, and technological advancements that are shaping the industry. It assesses the impact of external factors and global economic changes on market growth. Lastly, it provides strategic recommendations for new entrants and established companies to navigate the complexities of the market.
Future Outlook
- The market will experience rising demand for high-purity salts across food, pharmaceutical, and specialty chemical applications.
- Water treatment and desalination projects will continue to expand industrial salt consumption worldwide.
- Producers will adopt advanced extraction and refining technologies to improve efficiency and sustainability.
- Growth in processed food manufacturing will increase the use of functional phosphate salts.
- Mining and metallurgy sectors will strengthen demand for salts supporting flotation, separation, and purification processes.
- Energy-efficient and low-impact production methods will gain prominence across major facilities.
- Custom-formulated salts will see higher adoption as end users seek application-specific performance.
- Regional supply chain integration will improve distribution reliability and reduce import dependencies.
- Regulatory shifts will encourage greater investment in environmentally compliant processing systems.
- Market competition will intensify as producers expand capacity and introduce technologically upgraded salt solutions.
Request a Free Sample
Fill in your details and we'll send you a free sample report.
- Sample data tables & charts
- Research methodology
Need a Custom Version of This Report?
Tailor the scope, geography, or segments to your exact requirements.
- Custom geography or segment scope
- Direct access to our analyst team
Frequently Asked Questions
What is the current market size for the Industrial Salts Market, and what is its projected size in 2032?
At what Compound Annual Growth Rate is the Industrial Salts Market projected to grow between 2024 and 2032?
Which Industrial Salts Market segment held the largest share in 2024?
What are the primary factors fueling the growth of the Industrial Salts Market?
Who are the leading companies in the Industrial Salts Market?
Which region commanded the largest share of the Industrial Salts Market in 2024?
Table of Content
Chapter 1. Report Introduction
- 1.1 Report Description & Purpose
- 1.1.1 Report Title & Market Definition
- 1.1.2 Unique Selling Propositions (USP) & Key Differentiators
- 1.1.3 Value Proposition for Stakeholders
- 1.2 Research Objectives
- 1.2.1 Market Sizing Objectives (Volume & Revenue)
- 1.2.2 Segmentation Objectives
- 1.2.3 Competitive Intelligence Objectives
- 1.2.4 Forecast & Scenario Objectives
- 1.3 Report Scope
- 1.3.1 Industrial Salts Scope – Types & Subtypes Covered
- 1.3.2 Geographic Scope – Regions & Countries Covered
- 1.3.3 Historical Period, Base Year & Forecast Period (the historical period; forecast to 2032)
- 1.3.4 Inclusions & Exclusions
- 1.4 HS Code & Classification Framework
- 1.5 Currency, Units & Pricing Basis
- 1.6 Target Stakeholders
- 1.7 Limitations & Assumptions
Chapter 2. Executive Summary
- 2.1 Global Industrial Salts Market Snapshot
- 2.1.1 Market Size – Historical (the historical period) & Forecast (2032) (base year: USD 15,688 million → 2032: USD 18,308.8 million)
- 2.1.2 Volume & Revenue – Global Totals
- 2.1.3 Key Market Highlights – Top Five Facts
- 2.2 Industrial Salts Market Segmentation Snapshot
- 2.2.1 Market Split by Region – vs. 2032
- 2.3 Competitive Snapshot
- 2.3.1 Top 10 Players by Revenue Share –
- 2.3.2 Top 10 Players by Volume Share –
- 2.3.3 Recent Strategic Developments (18-Month Summary)
- 2.4 Key Investment Highlights & Strategic Conclusions
Chapter 3. Industrial Salts Market Dynamics & Industry Analysis
- 3.1 Market Overview & Context
- 3.1.1 Industrial Salts Market Position in the Broader Automotive Value Chain
- 3.1.2 OEM vs. Replacement Market Dynamics
- 3.1.3 Market Maturity & Development Stage by Region
- 3.2 Industrial Salts Market Drivers
- 3.3 Industrial Salts Market Restraints & Challenges
- 3.4 Industrial Salts Market Opportunities
- 3.5 Porter's Five Forces Analysis
- 3.5.1 Threat of New Entrants
- 3.5.2 Bargaining Power of Suppliers
- 3.5.3 Bargaining Power of Buyers
- 3.5.4 Threat of Substitutes
- 3.5.5 Competitive Rivalry – Intensity Assessment
- 3.6 Industrial Salts Value Chain Analysis
- 3.6.1 Upstream – Raw Material/Input Suppliers
- 3.6.1.1 Raw Material/Input 1
- 3.6.1.2 Raw Material/Input 2
- 3.6.1.3 Raw Material/Input 3
- 3.6.2 Midstream – Production/Manufacturing/Service Delivery
- 3.6.2.1 Production/Process Overview
- 3.6.2.2 Key Facility Locations & Capacity by Manufacturer
- 3.6.3 Downstream – Distribution & End Consumer
- 3.6.3.1 Primary Channel – B2B/OEM
- 3.6.3.2 Secondary Channels – Dealer, Retail, Online, Direct
- 3.6.4 Value Chain Profitability Analysis
- 3.6.1 Upstream – Raw Material/Input Suppliers
- 3.7 PESTEL Analysis
- 3.7.1 Political Factors
- 3.7.2 Economic Factors
- 3.7.3 Social Factors
- 3.7.4 Technological Factors
- 3.7.5 Environmental Factors
- 3.7.6 Legal Factors
- 3.8 Industrial Salts Supply Chain Analysis
- 3.8.1 Raw Material/Input Supply Risk Assessment
- 3.8.2 Manufacturing Concentration Risk (Geographic Exposure)
- 3.8.3 Trade Disruption Impact Analysis
- 3.9 Regulatory & Policy Landscape
Note: The regulatory and policy landscape section covers regulations based on their applicability to the market, Industrial Salts category, geography, and scope of the study. Only regulatory frameworks with a material impact on operations, compliance, trade, sustainability, or market access are analyzed in detail.
Chapter 4. Key Investment Pockets & Opportunity Analysis
- 4.1 Industrial Salts Market Attractiveness Analysis
- 4.1.1 By Region – Investment Attractiveness Matrix (Volume × CAGR)
- 4.2 Absolute Revenue Growth Opportunity
- 4.2.1 By Region – Absolute USD Growth Through 2032
- 4.3 Incremental Volume Opportunity
- 4.3.1 By Region – Incremental Volume Through 2032
- 4.3.2 Segment – Incremental Volume
- 4.4 Emerging Submarket Opportunity Deep Dive (Subject to Applicability)
- 4.5 Emerging Market Opportunity Scorecards
- 4.5.1 United States
- 4.5.2 Europe
- 4.5.3 Asia
- 4.5.4 Middle East & Africa
Note: Emerging Market Opportunity Scorecards will be included based on relevance and strategic importance. Regions listed are indicative and may vary depending on data availability and market dynamics.
Chapter 5. Industrial Salts Import-Export Analysis & Trade Flows
- 5.1 Global Trade Overview
- 5.1.1 Global Export Value by Country (the historical period)
- 5.1.2 Global Export Volume by Country (the historical period)
- 5.1.3 Global Import Value by Country (the historical period)
- 5.1.4 Global Import Volume by Country (the historical period)
- 5.1.5 Net Trade Balance by Country (the historical period)
- 5.2 Export Analysis – Segment
- 5.2.1 Type 1 (HS Code)
- 5.2.2 Type 2 (HS Code)
- 5.2.3 Type 3 (HS Code)
- 5.2.4 Type 4 (HS Code)
- 5.2.5 Type 5 (HS Code)
- 5.3 Import Analysis – Segment
- 5.3.1 Type 1 (HS Code)
- 5.3.2 Type 2 (HS Code)
- 5.3.3 Type 3 (HS Code)
- 5.3.4 Type 4 (HS Code)
- 5.3.5 Type 5 (HS Code)
- 5.4 Average Unit Trade Prices
- 5.4.1 Average Export Price – Segment & Country
- 5.4.2 Average Import Price – Segment & Source Country
- 5.4.3 Price Trends (the historical period)
- 5.5 Key Trade Route Analysis
- 5.5.1 Trade Route 1
- 5.5.2 Trade Route 2
- 5.5.3 Trade Route 3
- 5.5.4 Trade Route 4
- 5.5.5 Trade Route 5
- 5.6 Trade Policy Impact Assessment
- 5.6.1 US Anti-Dumping & Section 301 Tariffs
- 5.6.2 EU Customs Union Impact
- 5.6.3 Major Free Trade Agreements
- 5.6.4 USMCA Rules of Origin
Note: Trade policy analysis will be included only where relevant to the Industrial Salts market.
Chapter 6. Competitive Landscape & Company Benchmarking
- 6.1 Industrial Salts Market Concentration & Structure
- 6.1.1 Herfindahl-Hirschman Index (HHI) – vs.
- 6.1.2 Tier 1, Tier 2 & Tier 3 Market Structure
- 6.1.3 Global, Regional & Local Player Dynamics
- 6.2 Industrial Salts Market Share Analysis –
- 6.2.1 Global Revenue Share by Company
- 6.2.2 Global Volume Share by Company
- 6.2.3 Regional Revenue Share
- 6.2.4 Market Share Evolution ( vs. )
- 6.2.5 OEM Segment Share by Company
- 6.2.6 Replacement Segment Share by Company
- 6.3 Production/Delivery Capacity & Facility Analysis
- 6.3.1 Global Installed Capacity
- 6.3.2 Capacity Utilization Rates
- 6.3.3 Production/Output Volume
- 6.3.4 Facility Locations & Capacity Map
- 6.3.5 Planned Capacity Additions
- 6.4 Industrial Salts Competitive Benchmarking Matrix
- 6.4.1 Revenue, Volume, CAGR & Profitability Comparison
- 6.4.2 Channel Revenue Mix
- 6.4.3 Geographic Revenue Exposure
- 6.4.4 R&D Intensity
- 6.4.5 Sustainability Maturity
- 6.5 Strategic Developments in Industrial Salts (Last 24 Months)
- 6.5.1 Mergers, Acquisitions & Divestments
- 6.5.2 New Industrial Salts Launches
- 6.5.3 Facility Expansions
- 6.5.4 Strategic Alliances, Joint Ventures & Partnerships
- 6.5.5 Distribution Expansion & Market Entry
- 6.5.6 Sustainability & ESG Initiatives
- 6.6 Competitive Strategy Mapping
- 6.6.1 Leader, Challenger, Follower & Niche Classification
- 6.6.2 Pricing Strategy Comparison
- 6.6.3 Channel Strategy Matrix
Note: Strategic developments are included based on their materiality and the availability of reliable information.
Chapter 7. Global Industrial Salts Market – By Distribution Channel
- 7.1 Segment Overview
- 7.1.1 Volume & Revenue Split by Channel ( & 2032)
- 7.1.2 Channel Mix Evolution (2032)
Chapter 8. Regional Market Analysis – Global Overview
- 8.1 Global Regional Overview
- 8.1.1 Regional Volume Share
- 8.1.2 Regional Revenue Share
- 8.1.3 Regional Volume by Region
- 8.1.4 Regional Revenue by Region
- 8.1.5 Regional Forecast Through 2032
- 8.2 Cross-Regional Segment Analysis
- 8.2.1 By Distribution Channel
- 8.2.2 By Brand/Price Tier
Chapter 9. North America Industrial Salts Market
- 9.1 United States
- 9.2 Canada
- 9.3 Mexico
Chapter 10. Europe Industrial Salts Market
- 10.1 Germany
- 10.2 France
- 10.3 Italy
- 10.4 United Kingdom
- 10.5 Spain
- 10.6 Poland
- 10.7 Russia
- 10.8 Netherlands
- 10.9 Belgium
- 10.10 Sweden
- 10.11 Denmark
- 10.12 Norway
- 10.13 Rest of Europe
Chapter 11. Asia Pacific Industrial Salts Market
- 11.1 China
- 11.2 India
- 11.3 Japan
- 11.4 South Korea
- 11.5 Thailand
- 11.6 Indonesia
- 11.7 Vietnam
- 11.8 Malaysia
- 11.9 Australia
- 11.10 Rest of Asia Pacific
Chapter 12. Latin America Industrial Salts Market
- 12.1 Brazil
- 12.2 Argentina
- 12.3 Colombia
- 12.4 Chile
- 12.5 Rest of Latin America
Chapter 13. Middle East Industrial Salts Market
- 13.1 Saudi Arabia
- 13.2 United Arab Emirates
- 13.3 Turkey
- 13.4 Israel
- 13.5 Iran
- 13.6 Rest of the Middle East
Chapter 14. Africa Industrial Salts Market
- 14.1 South Africa
- 14.2 Egypt
- 14.3 Nigeria
- 14.4 Morocco
- 14.5 Rest of Africa
Chapter 15. Industrial Salts Company Profiles
- 15.1 [Company 01]
- 15.1.1 Company Overview
- 15.1.2 Key Management Personnel
- 15.1.3 Products & Services Portfolio
- 15.1.4 Financial Performance
- 15.1.5 Key Market Focus & Geographic Presence
- 15.1.6 Recent Developments & Strategic Initiatives
Note: The company profile list is preliminary and may change based on research findings, market developments, data availability, and client requirements.
Chapter 16. Appendices
- Appendix A – List of Abbreviations & Acronyms
- Appendix B – Industry Classification Code Reference – Full Series
- Appendix C – Production & Capacity Data Tables
- Appendix D – End-Use & Demand Base Tables
- Appendix E – Consumption & Replacement Rate Assumptions
- Appendix F – ASP Reference Tables
- Appendix G – Manufacturing & Facility Database
- Appendix H – Import-Export Data Tables
- Appendix I – Regulatory Summary Tables
- Appendix J – Primary Research Participant List (Anonymized)
- Appendix K – Primary Research Questionnaire Framework
- Appendix L – Data Sources & Bibliography
- Appendix M – Market Size Divergence & Source Comparison
Chapter 17. Research Methodology
- 17.1 Research Framework & Philosophy
- 17.2 Secondary Research – Sources, Hierarchy & Data Extraction
- 17.3 Data Modeling – Bottom-Up & Top-Down Market Sizing
- 17.4 Primary Research – Stakeholder Framework, LOI & Sample Sizes
- 17.5 Forecast Methodology – Regression, Scenario & Sensitivity Analysis
- 17.6 Quality Control – Four-Layer Validation Framework
- 17.7 Limitations & Standard Assumptions
- 17.8 Disclaimer
