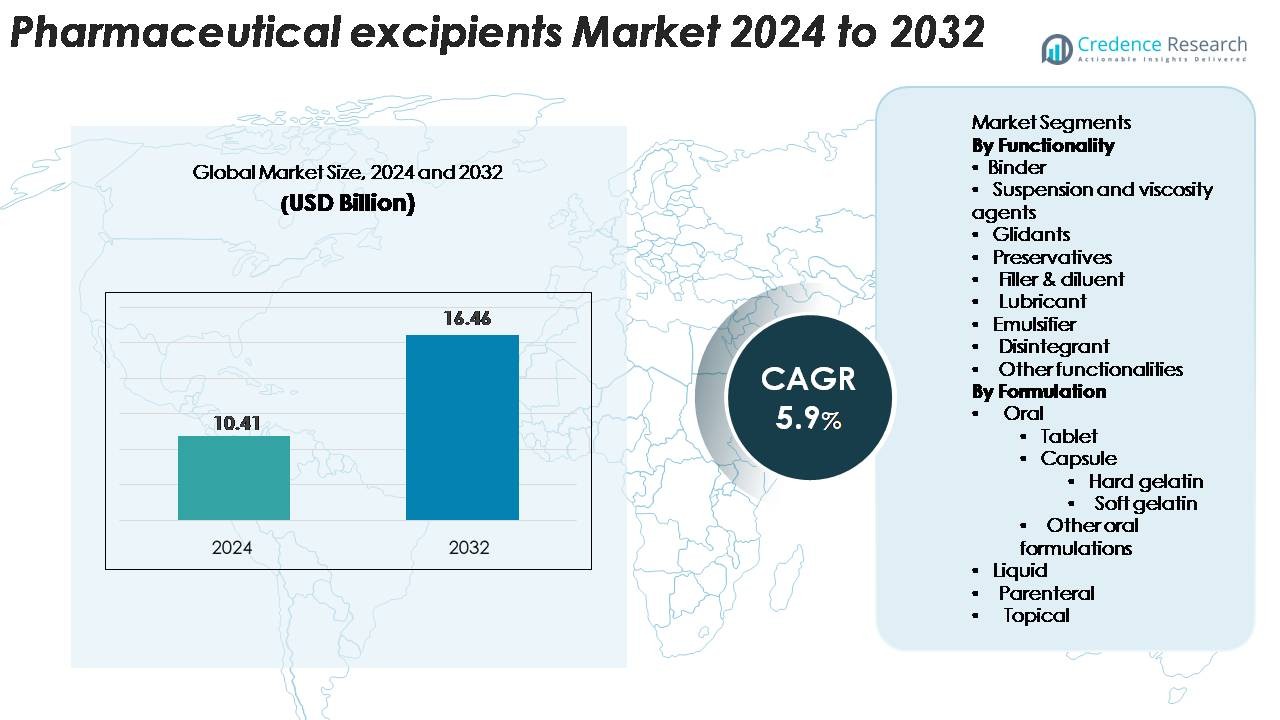
Home » Healthcare » Pharmaceuticals » Pharmaceutical Excipients Market

Pharmaceutical Excipients Market By Price Range (Low, Medium, High)-Growth, Future Prospects & Competitive Analysis, 2016 – 2030

Price: $4999

Published: | Report ID: 9419 | Report Format : PDF

Market Insights

  • The global pharmaceutical excipients market has been experiencing constant growth in current years.
  • Excipients are non-active substances added to pharmaceutical formulations to enhance their stability, solubility, palatability, and overall performance.
  • They serve various functions, along with binding, lubricating, disintegrating, and sustaining the discharge of active pharmaceutical elements (APIs).
  • The increasing demand drives the market for innovative drug formulations, growing investments in studies and development sports, and the need for improved patient safety and experience.

Executive Summary

Market Definition

The pharmaceutical excipients market is witnessing tremendous growth, driven by factors including the expanding pharmaceutical industry, the growing regular drug marketplace, and the need for regulatory compliance.

Excipients play a crucial position in pharmaceutical formulations by ensuring drug stability, bioavailability, and patient acceptability. This report presents a comprehensive marketplace analysis, which includes marketplace drivers, restraints, possibilities, competitive landscape, key findings, and future outlook.

Market Overview

The pharmaceutical excipients market has grown notably due to the increasing pharmaceutical industry globally. Excipients are extensively used to formulate numerous dosage forms, which include capsules, drugs, injectables, topicals, and oral liquids. They help hold the integrity and efficacy of the active substances, enhance the drug delivery process, and improve patient compliance.

Additionally, excipients assist in producing generic tablets, which are cost-effective options for branded medicines. The market is segmented based on type, capability, dosage form, and region.

Design Element 2

Access crucial information at unmatched prices!

Request your free sample report today & start making informed decisions powered by Credence Research!

Download Free Sample
CTA Design Element 3

Key Highlights of the Report

The international pharmaceutical excipients marketplace is projected to reach revenue of USD 14,306.95 million by 2030, with a compound annual growth rate (CAGR) of 6.55% from 2023 to 2030. Organic pharmaceutical excipients held the foremost percentage of the marketplace, driven by the increasing demand for herbal and green excipients.

Due to a properly-mounted pharmaceutical enterprise and robust regulatory framework, Europe emerged as the second-main marketplace for pharmaceutical excipients. The oral formulations section became the biggest in 2022, indicating the high consumption of pharmaceutical excipients in tablet and capsule formulations.

Fillers and diluents have been the most significant category of pharmaceutical excipients, as they may be broadly used to enhance the bulk and stability of pharmaceutical formulations.

Pharmaceutical Excipients Market

What Are the Main Drivers of the Pharmaceutical Excipients Market?

The main drivers of the Pharmaceutical Excipients Market include the expanding pharmaceutical industry, the growing generic drug market, and regulatory compliance.

What Are The Major Challenges Faced By the Pharmaceutical Excipients Market?

The major challenges faced by the Pharmaceutical Excipients Market include the price volatility of raw materials and the complex regulatory environment.

What Are The Growth Opportunities In the Pharmaceutical Excipients Market?

The growth opportunities in the Pharmaceutical Excipients Market include the development of novel excipients, rising demand for biopharmaceuticals, and focusing on patient safety and experience.

Expanding Pharmaceutical Industry

The pharmaceutical industry has been growing hastily, driven by the rising prevalence of chronic illnesses, ageing populations, and improved healthcare spending. As the pharmaceutical industry expands, the demand for excipients grows, as they’re critical to drug formulations. Excipients ensure pharmaceutical products’ balance, bioavailability, and overall quality.

Growing Generic Drug Market

Generic pills are gaining recognition because of their lower price compared to branded medicines. The generic drug market has witnessed substantial growth with the expiration of patents for many blockbuster drugs. Excipients are essential in formulating generic tablets, as they help maintain the therapeutic equivalence and efficacy of the original branded drugs. The growing demand for widespread capsules drives the growth of the pharmaceutical excipients marketplace.

Regulatory Compliance

Regulatory organizations, like the U.S. Food and Drug Administration (FDA) and the European Medicines Agency (EMA), have stringent regulations to ensure the safety of pharmaceutical products and their efficacy. Compliance with those policies is vital for pharmaceutical manufacturers. Excipients must meet the regulatory necessities, including Good Manufacturing Practices (GMP), to be used in drug formulations. The want for regulatory compliance drives the demand for high-quality excipients.

Price Volatility of Raw Materials

The price volatility of raw materials affects the pharmaceutical excipients market. Excipients are derived from diverse assets, including natural, semi-synthetic, and synthetic substances. Fluctuations in the costs of these raw materials impact the overall manufacturing cost of excipients. Manufacturers face challenges in keeping a stable supply chain and managing cost fluctuations that can hinder market growth.

Complex Regulatory Environment

The pharmaceutical enterprise operates in a complicated regulatory environment, with stringent guidelines governing pharmaceutical product development, production, and distribution. The approval procedure for new excipients may be time-consuming and high-priced. Manufacturers must adhere to regulatory necessities, safety assessments, stability testing, and documentation, which could pose challenges and impede marketplace growth.

Development of Novel Excipients

The development of novel excipients gives big opportunities within the pharmaceutical industry. Researchers and producers are exploring new excipients to enhance drug transport, solubility, and increase bioavailability. Novel excipients offer benefits such as advanced patient compliance, decreased side effects, and enhanced healing outcomes. The development of modern excipients opens new avenues for market growth and differentiation.

Rising Demand for Biopharmaceuticals

The demand for biopharmaceuticals, including protein-based therapeutics and biosimilars, has elevated. Biopharmaceutical formulations often require specialized excipients to ensure stability, maintain protein conformation, and enhance delivery. The growing demand for biopharmaceuticals allows excipient producers to develop excipients tailored for these complicated formulations.

Focus on Patient Safety and Experience

Patient safety and experience have become crucial priorities in the healthcare industry. Excipients play a vital role in ensuring pharmaceutical products’ safety and acceptability. Manufacturers are developing safe, well-tolerated excipients that enhance the patient experience, such as taste-masking agents, controlled-release matrices, and improved texture modifiers. The emphasis on patient-centric formulations creates opportunities for innovation and market growth.

Competitive Landscape

The pharmaceutical excipients marketplace is relatively competitive, with numerous international and regional players. The marketplace is characterized by excessive competition, product innovation, and strategic collaborations.

Key players in the market consist of Ashland Global Holdings Inc., BASF SE, DowDuPont Inc., Evonik Industries AG, Roquette Frères, and Colorcon Inc. These companies focus on expanding their product portfolios, investing in research and development, and strengthening their distribution networks to gain a competitive advantage.

Key Players

The Pharmaceutical Excipients market is highly competitive, with several key players. Some of the major players in the market and their market share are as follows:

  • Ashland Inc.
  • BASF SE
  • DowDuPont Inc.
  • Evonik Industries AG
  • Roquette Group
  • Kerry Group
  • Colorcon Inc.

These key players are actively involved in product improvement, strategic collaborations, and mergers and acquisitions to reinforce their marketplace position. They are additionally aware of expanding their product portfolios by introducing novel excipients with stronger functionalities to fulfill the evolving pharmaceutical industry needs.

Summary of Key Findings

  • The global pharmaceutical excipients marketplace is projected to reach USD 14,306.95 million by 2030, with a CAGR of 6.55% from 2023 to 2030.
  • Organic pharmaceutical excipients held the essential percentage of the market, driven by the increasing demand for natural and eco-friendly excipients.
  • Thanks to a well-established pharmaceutical industry and sturdy regulatory framework, Europe emerged as the second leading market for pharmaceutical excipients.
  • The oral formulations segment became the most important in 2022, indicating the high intake of pharmaceutical excipients in tablet and pill formulations.
  • Fillers and diluents have been the most sizable category of pharmaceutical excipients, as they’re extensively used to enhance the bulk and stability of pharmaceutical formulations.

Shape Your Report to Specific Countries or Regions & Enjoy 30% Off!

Future Outlook

  • The worldwide pharmaceutical excipients market will maintain its growth trajectory in the coming years.
  • Factors such as the increasing demand for innovative drug formulations, the expanding pharmaceutical industry, and the focus on patient safety and experience will drive marketplace growth.
  • However, challenges like the cost volatility of raw materials, and the complicated regulatory environment need to be addressed.
  • Manufacturers must invest money into research and development to develop novel excipients and capitalize on the possibilities of the rising demand for biopharmaceuticals.
  • Strategic partnerships and collaborations can drive market growth and foster innovation inside the pharmaceutical excipients industry.

Segmentation

  • By Price Range
    • Low
    • Medium
    • High
  • By Region
    • North America
      • USA
      • Canada
      • Mexico
    • Europe
      • Germany
      • France
      • U.K.
      • Italy
      • Spain
      • Rest of Europe
    • Asia Pacific
      • China
      • Japan
      • India
      • South Korea
      • South-east Asia
      • Rest of Asia Pacific
    • Latin America
      • Brazil
      • Argentina
      • Rest of Latin America
    • Middle East & Africa
      • GCC Countries
      • South Africa
      • Rest of Middle East and Africa

CHAPTER NO. 1 : INTRODUCTION 19

1.1. Report Description 19

1.1.1. Purpose of the Report 19

1.1.2. USP & Key Offerings 19

1.2. Key Benefits for Stakeholders 19

1.3. Target Audience 20

1.4. Report Scope 20


CHAPTER NO. 2 : EXECUTIVE SUMMARY 24

2.1. Pharmaceutical Excipients Market Snapshot 24

2.2. Global Pharmaceutical Excipients Market, 2017 – 2030 (Kilo Tons) (USD Million) 26

2.1. Insights from Primary Respondents 26


CHAPTER NO. 3 : COVID 19 IMPACT ANALYSIS 27

3.1. Impact Assessment of COVID-19 Pandemic, By Region 27


CHAPTER NO. 4 : PHARMACEUTICAL EXCIPIENTS MARKET – INDUSTRY ANALYSIS 28

4.1. Introduction 28

4.2. Market Drivers 29

4.2.1. Driving Factor 1 Analysis 29

4.2.2. Driving Factor 2 Analysis 30

4.3. Market Restraints 30

4.3.1. Restraining Factor Analysis 30

4.4. Market Opportunities 31

4.4.1. Market Opportunity Analysis 31

4.5. Porter’s Five Forces Analysis 31

4.6. Value Chain Analysis 32


CHAPTER NO. 5 : KEY INVESTMENT POCKETS ANALYSIS 33

5.1. Top Investment Pockets 33

5.1.1.1. Pharmaceutical Excipients Market Attractiveness Analysis, By Type 33

5.1.1.2. Pharmaceutical Excipients Market Attractiveness Analysis, By Application 33

5.1.1.3. Pharmaceutical Excipients Market Attractiveness Analysis, By Formulation 34

5.2. Product Life Cycle Analysis 35

5.3. Incremental Revenue Growth Opportunity, 2023 – 2030 36

5.3.1. Type 36

5.3.2. Application 36

5.3.3. Formulation 37


CHAPTER NO. 6 : IMPORT EXPORT ANALYSIS 38

6.1. Import Analysis by Region 38

6.1.1. Global Pharmaceutical Excipients Market Import Volume, By Region, 2017 – 2022 (Kilo Tons) 38

6.2. Export Analysis by Region 38

6.2.1. Global Pharmaceutical Excipients Market Export Volume, By Region, 2017 – 2022 (Kilo Tons) 38


CHAPTER NO. 7 : DEMAND SUPPLY ANALYSIS 39

7.1. Demand Analysis by Region 39

7.1.1. Global Pharmaceutical Excipients Market Demand Volume, By Region, 2017 – 2022 (Kilo Tons) 39

7.2. Supply Analysis by Region 39

7.2.1. Global Pharmaceutical Excipients Market Supply Volume, By Region, 2017 – 2022 (Kilo Tons) 39


CHAPTER NO. 8 : MARKET POSITIONING OF KEY PLAYERS 40

8.1. Company Market Share Analysis –2020 and 2022 40

8.1.1. Global Pharmaceutical Excipients Market: Company Market Share, 2022 40

8.1.2. Global Pharmaceutical Excipients Market: Company Market Share, 2022 40

8.1. Global Pharmaceutical Excipients Market Company Volume Market Share, 2022 41

8.2. Global Pharmaceutical Excipients Market Company Revenue Market Share, 2022 42

8.3. Market Position of Key Players 2022 43

8.3.1. Market Position of Key Players, 2022 43

8.4. Strategic Developments 44

8.4.1. Acquisitions & Mergers 44

8.4.2. New Product Launch 44

8.4.3. Regional Expansion 44


CHAPTER NO. 9 : PHARMACEUTICAL EXCIPIENTS MARKET – BY TYPE SEGMENT ANALYSIS 45

9.1. Pharmaceutical Excipients Market Overview, by Type Segment 45

9.1.1. Global Pharmaceutical Excipients Market Volume Share, By Type, 2022 & 2030 46

9.1.2. Global Pharmaceutical Excipients Market Revenue Share, By Type, 2022 & 2030 46

9.2. Organic 47

9.2.1. Global Organic Pharmaceutical Excipients Market Volume, By Region, 2017 – 2022 (Kilo Tons) 47

9.2.2. Global Organic Pharmaceutical Excipients Market Revenue, By Region, 2017 – 2022 (USD Million) 48

9.3. Inorganic 49

9.3.1. Global Inorganic Pharmaceutical Excipients Market Volume, By Region, 2017 – 2022 (Kilo Tons) 49

9.3.2. Global Organic Pharmaceutical Excipients Market Revenue, By Region, 2017 – 2022 (USD Million) 50


CHAPTER NO. 10 : PHARMACEUTICAL EXCIPIENTS MARKET – BY APPLICATION SEGMENT ANALYSIS 57

10.1. Pharmaceutical Excipients Market Overview, by Application Segment 57

10.1.1. Global Pharmaceutical Excipients Market Volume Share, By Application, 2022 & 2030 58

10.1.2. Global Pharmaceutical Excipients Market Revenue Share, By Application, 2022 & 2030 58

10.2. Binders 59

10.2.1. Global Pharmaceutical Excipients for Binders Market Volume, By Region, 2017 – 2022 (Kilo Tons) 59

10.2.2. Global Pharmaceutical Excipients for Binders Market Revenue, By Region, 2017 – 2022 (USD Million) 60

10.3. Fillers and diluents 61

10.3.1. Global Pharmaceutical Excipients for Fillers and diluents Market Volume, By Region, 2017 – 2022 (Kilo Tons) 61

10.3.2. Global Pharmaceutical Excipients for Fillers and diluents Market Revenue, By Region, 2017 – 2022 (USD Million) 62

10.4. Disintegrants 63

10.4.1. Global Pharmaceutical Excipients for Disintegrants Market Volume, By Region, 2017 – 2022 (Kilo Tons) 63

10.4.2. Global Pharmaceutical Excipients for Disintegrants Market Revenue, By Region, 2017 – 2022 (USD Million) 64

10.5. Lubricants and glidants 65

10.5.1. Global Pharmaceutical Excipients for Lubricants and glidants Market Volume, By Region, 2017 – 2022 (Kilo Tons) 65

10.5.2. Global Pharmaceutical Excipients for Lubricants and glidants Market Revenue, By Region, 2017 – 2022 (USD Million) 66

10.6. Coatings & Preservatives 67

10.6.1. Global Pharmaceutical Excipients for Coatings & Preservatives Market Volume, By Region, 2017 – 2022 (Kilo Tons) 67

10.6.2. Global Pharmaceutical Excipients for Coatings & Preservatives Market Revenue, By Region, 2017 – 2022 (USD Million) 68


CHAPTER NO. 11 : PHARMACEUTICAL EXCIPIENTS MARKET – BY FORMULATION SEGMENT ANALYSIS 69

11.1. Pharmaceutical Excipients Market Overview, by Formulation Segment 69

11.1.1. Global Pharmaceutical Excipients Market Volume Share, By Formulation, 2022 & 2030 70

11.1.2. Global Pharmaceutical Excipients Market Revenue Share, By Formulation, 2022 & 2030 70

11.2. Oral Formulations 71

11.2.1. Global Oral Formulations Pharmaceutical Excipients Market Volume, By Region, 2017 – 2022 (Kilo Tons) 71

11.2.2. Global Oral Formulations Pharmaceutical Excipients Market Revenue, By Region, 2017 – 2022 (USD Million) 72

11.3. Tablets 73

11.3.1. Global Tablets Pharmaceutical Excipients Market Volume, By Region, 2017 – 2022 (Kilo Tons) 73

11.3.2. Global Tablets Pharmaceutical Excipients Market Revenue, By Region, 2017 – 2022 (USD Million) 74

11.4. Capsules 75

11.4.1. Global Capsules Pharmaceutical Excipients Market Volume, By Region, 2017 – 2022 (Kilo Tons) 75

11.4.2. Global Capsules Pharmaceutical Excipients Market Revenue, By Region, 2017 – 2022 (USD Million) 76

11.5. Parenteral Formulations 77

11.5.1. Global Parenteral Formulations Pharmaceutical Excipients Market Volume, By Region, 2017 – 2022 (Kilo Tons) 77

11.5.2. Global Parenteral Formulations Pharmaceutical Excipients Market Revenue, By Region, 2017 – 2022 (USD Million) 78

11.6. Topical Formulations 79

11.6.1. Global Topical Formulations Pharmaceutical Excipients Market Volume, By Region, 2017 – 2022 (Kilo Tons) 79

11.6.2. Global Topical Formulations Pharmaceutical Excipients Market Revenue, By Region, 2017 – 2022 (USD Million) 80


CHAPTER NO. 12 : PHARMACEUTICAL EXCIPIENTS MARKET – REGIONAL ANALYSIS 81

12.1. Pharmaceutical Excipients Market Overview, by Region Segment 81

12.1.1. Global Pharmaceutical Excipients Market Volume Share, By Region, 2022 & 2030 82

12.1.2. Global Pharmaceutical Excipients Market Revenue Share, By Region, 2022 & 2030 82

12.1.3. Global Pharmaceutical Excipients Market Volume, By Region, 2017 – 2022 (Kilo Tons) 83

12.1.4. Global Pharmaceutical Excipients Market Revenue, By Region, 2017 – 2022 (USD Million) 84

12.1.5. Global Pharmaceutical Excipients Market Volume, By Type, 2017 – 2022 (Kilo Tons) 85

12.1.6. Global Pharmaceutical Excipients Market Revenue, By Type, 2017 – 2022 (USD Million) 86

12.1.7. Global Pharmaceutical Excipients Market Volume, By Application, 2017 – 2022 (Kilo Tons) 87

12.1.8. Global Pharmaceutical Excipients Market Revenue, By Application, 2017 – 2022 (USD Million) 88

12.1.9. Global Pharmaceutical Excipients Market Volume, By Formulation, 2017 – 2022 (Kilo Tons) 89

12.1.10. Global Pharmaceutical Excipients Market Revenue, By Formulation, 2017 – 2022 (USD Million) 90

12.2. North America 91

12.2.1. North America Pharmaceutical Excipients Market Volume, By Country, 2017 – 2022 (Kilo Tons) 92

12.2.2. North America Pharmaceutical Excipients Market Revenue, By Country, 2017 – 2022 (USD Million) 92

12.2.2.1. North America Pharmaceutical Excipients Market Volume, By Type, 2017 – 2022 (Kilo Tons) 93

12.2.3. North America Pharmaceutical Excipients Market Revenue, By Type, 2017 – 2022 (USD Million) 94

12.2.4. North America Pharmaceutical Excipients Market Volume, By Application, 2017 – 2022 (Kilo Tons) 95

12.2.5. North America Pharmaceutical Excipients Market Revenue, By Application, 2017 – 2022 (USD Million) 96

12.2.6. North America Pharmaceutical Excipients Market Volume, By Formulation, 2017 – 2022 (Kilo Tons) 97

12.2.7. North America Pharmaceutical Excipients Market Revenue, By Formulation, 2017 – 2022 (USD Million) 98

12.2.8. U.S. 99

12.2.9. Canada 99

12.2.10. Mexico 99

12.3. Europe 100

12.3.1. Europe Pharmaceutical Excipients Market Volume, By Country, 2017 – 2022 (Kilo Tons) 101

12.3.2. Europe Pharmaceutical Excipients Market Revenue, By Country, 2017 – 2022 (USD Million) 102

12.3.3. Europe Pharmaceutical Excipients Market Volume, By Type, 2017 – 2022 (Kilo Tons) 103

12.3.4. Europe Pharmaceutical Excipients Market Revenue, By Type, 2017 – 2022 (USD Million) 104

12.3.5. Europe Pharmaceutical Excipients Market Volume, By Application, 2017 – 2022 (Kilo Tons) 105

12.3.6. Europe Pharmaceutical Excipients Market Revenue, By Application, 2017 – 2022 (USD Million) 106

12.3.7. Europe Pharmaceutical Excipients Market Volume, By Formulation, 2017 – 2022 (Kilo Tons) 107

12.3.8. Europe Pharmaceutical Excipients Market Revenue, By Formulation, 2017 – 2022 (USD Million) 108

12.3.9. UK 109

12.3.10. France 109

12.3.11. Germany 109

12.3.12. Italy 109

12.3.13. Spain 109

12.3.14. Russia 109

12.3.15. BENELUX 109

12.3.16. Sweden 109

12.3.17. Denmark 109

12.3.18. Poland 109

12.3.19. Austria 109

12.3.20. Rest of Europe 109

12.4. Asia Pacific 110

12.4.1. Asia Pacific Pharmaceutical Excipients Market Volume, By Country, 2017 – 2022 (Kilo Tons) 111

12.4.2. Asia Pacific Pharmaceutical Excipients Market Revenue, By Country, 2017 – 2022 (USD Million) 112

12.4.3. Asia Pacific Pharmaceutical Excipients Market Volume, By Type, 2017 – 2022 (Kilo Tons) 113

12.4.4. Asia Pacific Pharmaceutical Excipients Market Revenue, By Type, 2017 – 2022 (USD Million) 114

12.4.5. Asia Pacific Pharmaceutical Excipients Market Volume, By Application, 2017 – 2022 (Kilo Tons) 115

12.4.6. Asia Pacific Pharmaceutical Excipients Market Revenue, By Application, 2017 – 2022 (USD Million) 116

12.4.7. Asia Pacific Pharmaceutical Excipients Market Volume, By Formulation, 2017 – 2022 (Kilo Tons) 117

12.4.8. Asia Pacific Pharmaceutical Excipients Market Revenue, By Formulation, 2017 – 2022 (USD Million) 118

12.4.9. China 119

12.4.10. Japan 119

12.4.11. South Korea 119

12.4.12. India 119

12.4.13. Thailand 119

12.4.14. Indonesia 119

12.4.15. Vietnam 119

12.4.16. Malaysia 119

12.4.17. Philippines 119

12.4.18. Taiwan 119

12.4.19. Rest of Asia Pacific 119

12.5. Latin America 120

12.5.1. Latin America Pharmaceutical Excipients Market Volume, By Country, 2017 – 2022 (Kilo Tons) 121

12.5.2. Latin America Pharmaceutical Excipients Market Revenue, By Country, 2017 – 2022 (USD Million) 122

12.5.3. Latin America Pharmaceutical Excipients Market Volume, By Type, 2017 – 2022 (Kilo Tons) 123

12.5.4. Latin America Pharmaceutical Excipients Market Revenue, By Type, 2017 – 2022 (USD Million) 124

12.5.5. Latin America Pharmaceutical Excipients Market Volume, By Application, 2017 – 2022 (Kilo Tons) 125

12.5.6. Latin America Pharmaceutical Excipients Market Revenue, By Application, 2017 – 2022 (USD Million) 126

12.5.7. Latin America Pharmaceutical Excipients Market Volume, By Formulation, 2017 – 2022 (Kilo Tons) 127

12.5.8. Latin America Pharmaceutical Excipients Market Revenue, By Formulation, 2017 – 2022 (USD Million) 128

12.5.9. Brazil 129

12.5.10. Argentina 129

12.5.11. Colombia 129

12.5.12. Chile 129

12.5.13. Peru 129

12.5.14. Rest of Latin America 129

12.6. The Middle-East 130

12.6.1. Middle East Pharmaceutical Excipients Market Volume, By Country, 2017 – 2022 (Kilo Tons) 131

12.6.2. Middle East Pharmaceutical Excipients Market Revenue, By Country, 2017 – 2022 (USD Million) 132

12.6.3. Middle East Pharmaceutical Excipients Market Volume, By Type, 2017 – 2022 (Kilo Tons) 133

12.6.4. Middle East Pharmaceutical Excipients Market Revenue, By Type, 2017 – 2022 (USD Million) 134

12.6.5. Middle East Pharmaceutical Excipients Market Volume, By Application, 2017 – 2022 (Kilo Tons) 135

12.6.6. Middle East Pharmaceutical Excipients Market Revenue, By Application, 2017 – 2022 (USD Million) 136

12.6.7. Middle East Pharmaceutical Excipients Market Volume, By Formulation, 2017 – 2022 (Kilo Tons) 137

12.6.8. Middle East Pharmaceutical Excipients Market Revenue, By Formulation, 2017 – 2022 (USD Million) 138

12.6.9. GCC Countries 139

12.6.10. Israel 139

12.6.11. Turkey 139

12.6.12. Iran 139

12.6.13. Rest of Middle East & Africa 139

12.7. Africa 140

12.7.1. Africa Pharmaceutical Excipients Market Volume, By Country, 2017 – 2022 (Kilo Tons) 141

12.7.2. Africa Pharmaceutical Excipients Market Revenue, By Country, 2017 – 2022 (USD Million) 142

12.7.3. Africa Pharmaceutical Excipients Market Volume, By Type, 2017 – 2022 (Kilo Tons) 143

12.7.4. Africa Pharmaceutical Excipients Market Revenue, By Type, 2017 – 2022 (USD Million) 144

12.7.5. Africa Pharmaceutical Excipients Market Volume, By Application, 2017 – 2022 (Kilo Tons) 145

12.7.6. Africa Pharmaceutical Excipients Market Revenue, By Application, 2017 – 2022 (USD Million) 146

12.7.7. Africa Pharmaceutical Excipients Market Volume, By Formulation, 2017 – 2022 (Kilo Tons) 147

12.7.8. Africa Pharmaceutical Excipients Market Revenue, By Formulation, 2017 – 2022 (USD Million) 148

12.7.9. South Africa 149

12.7.10. Egypt 149

12.7.11. Nigeria 149

12.7.12. Algeria 149

12.7.13. Morocco 149

12.7.14. Rest of Africa 149


CHAPTER NO. 13 : COMPANY PROFILES 150

13.1. Ashland Global Holdings Inc. 150

13.1.1. Company Overview 150

13.1.2. Product Portfolio 150

13.1.3. Financial Overview 150

13.2. BASF SE 151

13.3. Croda International Plc 151

13.4. DuPont de Nemours, Inc. 151

13.5. Evonik Industries AG 151

13.6. Roquette Frères 151

13.7. Dow Chemical Company 151

13.8. Lubrizol Corporation 151

13.9. Kerry Group 151

13.10. Merck KGaA 151

13.11. Archer Daniels Midland Company 151

13.12. Colorcon Inc. 151

13.13. JRS Pharma 151

13.14. Pfanstiehl, Inc. 151


CHAPTER NO. 14 : RESEARCH METHODOLOGY 152

14.1. Research Methodology 152

14.2. Phase I – Secondary Research 153

14.3. Phase II – Data Modeling 153

14.3.1. Company Share Analysis Model 154

14.3.2. Revenue Based Modeling 154

14.4. Phase III – Primary Research 155

14.5. Research Limitations 156

14.5.1. Assumptions 156

List of Figures

FIG NO. 1. Global Pharmaceutical Excipients Market Volume & Revenue, 2017 – 2030 (Kilo Tons) (USD Million) 26

FIG NO. 2. Porter’s Five Forces Analysis for Global Pharmaceutical Excipients Market 31

FIG NO. 3. Value Chain Analysis for Global Pharmaceutical Excipients Market 32

FIG NO. 4. Market Attractiveness Analysis, By Type 33

FIG NO. 5. Market Attractiveness Analysis, By Application 33

FIG NO. 6. Market Attractiveness Analysis, By Formulation 34

FIG NO. 7. Product Life Cycle Analysis 35

FIG NO. 8. Incremental Revenue Growth Opportunity by Type 36

FIG NO. 9. Incremental Revenue Growth Opportunity by Application 36

FIG NO. 10. Incremental Revenue Growth Opportunity by Formulation 37

FIG NO. 11. Company Share Analysis, 2020 40

FIG NO. 12. Company Share Analysis, 2022 40

FIG NO. 13. Pharmaceutical Excipients Market – Company Volume  Market Share, 2022 41

FIG NO. 14. Pharmaceutical Excipients Market – Company Revenue Market Share, 2022 42

FIG NO. 15. Market Position of Key Players, 2022 43

FIG NO. 16. Global Pharmaceutical Excipients Market Volume Share, By Type, 2022 & 2030 46

FIG NO. 17. Global Pharmaceutical Excipients Market Revenue Share, By Type, 2022 & 2030 46

FIG NO. 18. Global Pharmaceutical Excipients Market for Organic, Volume & Revenue (Kilo Tons) (USD Million) 2017 – 2030 47

FIG NO. 19. Global Pharmaceutical Excipients Market for Inorganic, Volume & Revenue (Kilo Tons) (USD Million) 2017 – 2030 49

FIG NO. 20. Global Pharmaceutical Excipients Market for Type 3, Volume & Revenue (Kilo Tons) (USD Million) 2017 – 2030 51

FIG NO. 21. Global Pharmaceutical Excipients Market for Type 4, Volume & Revenue (Kilo Tons) (USD Million) 2017 – 2030 53

FIG NO. 22. Global Pharmaceutical Excipients Market for Type 5, Volume & Revenue (Kilo Tons) (USD Million) 2017 – 2030 55

FIG NO. 23. Global Pharmaceutical Excipients Market Volume Share, By Application, 2022 & 2030 58

FIG NO. 24. Global Pharmaceutical Excipients Market Revenue Share, By Application, 2022 & 2030 58

FIG NO. 25. Global Pharmaceutical Excipients Market for Binders, Volume & Revenue (Kilo Tons) (USD Million) 2017 – 2030 59

FIG NO. 26. Global Pharmaceutical Excipients Market for Fillers and diluents, Volume & Revenue (Kilo Tons) (USD Million) 2017 – 2030 61

FIG NO. 27. Global Pharmaceutical Excipients Market for Disintegrants, Volume & Revenue (Kilo Tons) (USD Million) 2017 – 2030 63

FIG NO. 28. Global Pharmaceutical Excipients Market for Lubricants and glidants, Volume & Revenue (Kilo Tons) (USD Million) 2017 – 2030 65

FIG NO. 29. Global Pharmaceutical Excipients Market for Coatings & Preservatives, Volume & Revenue (Kilo Tons) (USD Million) 2017 – 2030 67

FIG NO. 30. Global Pharmaceutical Excipients Market Volume Share, By Formulation, 2022 & 2030 70

FIG NO. 31. Global Pharmaceutical Excipients Market Revenue Share, By Formulation, 2022 & 2030 70

FIG NO. 32. Global Pharmaceutical Excipients Market for Oral Formulations, Volume & Revenue (Kilo Tons) (USD Million) 2017 – 2030 71

FIG NO. 33. Global Pharmaceutical Excipients Market for Tablets, Volume & Revenue (Kilo Tons) (USD Million) 2017 – 2030 73

FIG NO. 34. Global Pharmaceutical Excipients Market for Capsules, Volume & Revenue (Kilo Tons) (USD Million) 2017 – 2030 75

FIG NO. 35. Global Pharmaceutical Excipients Market for Parenteral Formulations, Volume & Revenue (Kilo Tons) (USD Million) 2017 – 2030 77

FIG NO. 36. Global Pharmaceutical Excipients Market for Topical Formulations, Volume & Revenue (Kilo Tons) (USD Million) 2017 – 2030 79

FIG NO. 37. Global Pharmaceutical Excipients Market Volume Share, By Region, 2022 & 2030 82

FIG NO. 38. Global Pharmaceutical Excipients Market Revenue Share, By Region, 2022 & 2030 82

FIG NO. 39. North America Pharmaceutical Excipients Market Volume & Revenue, 2017 – 2022 (Kilo Tons) (USD Million) 91

FIG NO. 40. Europe Pharmaceutical Excipients Market Volume & Revenue, 2017 – 2022 (Kilo Tons) (USD Million) 100

FIG NO. 41. Asia Pacific Pharmaceutical Excipients Market Volume & Revenue, 2017 – 2022 (Kilo Tons) (USD Million) 110

FIG NO. 42. Latin America Pharmaceutical Excipients Market Volume & Revenue, 2017 – 2022 (Kilo Tons) (USD Million) 120

FIG NO. 43. The Middle-East Pharmaceutical Excipients Market Volume & Revenue, 2017 – 2022 (Kilo Tons) (USD Million) 130

FIG NO. 44. Africa Pharmaceutical Excipients Market Volume & Revenue, 2017 – 2022 (Kilo Tons) (USD Million) 140

FIG NO. 45. Research Methodology – Detailed View 152

FIG NO. 46. Research Methodology 153

List of Tables

TABLE NO. 1. : Global Pharmaceutical Excipients Market: Snapshot 24

TABLE NO. 2. : Drivers for the Pharmaceutical Excipients Market: Impact Analysis 29

TABLE NO. 3. : Restraints for the Pharmaceutical Excipients Market: Impact Analysis 30

TABLE NO. 4. : Global Pharmaceutical Excipients Market Import Volume, By Formulation, 2017 – 2022 (Kilo Tons) 38

TABLE NO. 5. : Global Pharmaceutical Excipients Market Export Volume, By Formulation, 2017 – 2022 (Kilo Tons) 38

TABLE NO. 6. : Global Pharmaceutical Excipients Market Demand Volume, By Formulation, 2017 – 2022 (Kilo Tons) 39

TABLE NO. 7. : Global Pharmaceutical Excipients Market Supply Volume, By Formulation, 2017 – 2022 (Kilo Tons) 39

TABLE NO. 8. : Global Organic Pharmaceutical Excipients Market Volume, By Region, 2017 – 2022 (Kilo Tons) 47

TABLE NO. 9. : Global Organic Pharmaceutical Excipients Market Volume, By Region, 2023– 2030 (Kilo Tons) 47

TABLE NO. 10. : Global Organic Pharmaceutical Excipients Market Revenue, By Region, 2017 – 2022 (USD Million) 48

TABLE NO. 11. : Global Organic Pharmaceutical Excipients Market Revenue, By Region, 2023– 2030 (USD Million) 48

TABLE NO. 12. : Global Inorganic Pharmaceutical Excipients Market Volume, By Region, 2017 – 2022 (Kilo Tons) 49

TABLE NO. 13. : Global Inorganic Pharmaceutical Excipients Market Volume, By Region, 2023– 2030 (Kilo Tons) 49

TABLE NO. 14. : Global Organic Pharmaceutical Excipients Market Revenue, By Region, 2017 – 2022 (USD Million) 50

TABLE NO. 15. : Global Organic Pharmaceutical Excipients Market Revenue, By Region, 2023– 2030 (USD Million) 50

TABLE NO. 16. : Global Type 3 Pharmaceutical Excipients Market Volume, By Region, 2017 – 2022 (Kilo Tons) 51

TABLE NO. 17. : Global Type 3 Pharmaceutical Excipients Market Volume, By Region, 2023– 2030 (Kilo Tons) 51

TABLE NO. 18. : Global Type 3 Pharmaceutical Excipients Market Revenue, By Region, 2017 – 2022 (USD Million) 52

TABLE NO. 19. : Global Type 3 Pharmaceutical Excipients Market Revenue, By Region, 2023– 2030 (USD Million) 52

TABLE NO. 20. : Global Type 4 Pharmaceutical Excipients Market Revenue, By Region, 2017 – 2022 (USD Million) 53

TABLE NO. 21. : Global Type 4 Pharmaceutical Excipients Market Volume, By Region, 2023– 2030 (Kilo Tons) 53

TABLE NO. 22. : Global Type 4 Pharmaceutical Excipients Market Revenue, By Region, 2017 – 2022 (USD Million) 54

TABLE NO. 23. : Global Type 4 Pharmaceutical Excipients Market Revenue, By Region, 2023– 2030 (USD Million) 54

TABLE NO. 24. : Global Type 5 Pharmaceutical Excipients Market Volume, By Region, 2017 – 2022 (Kilo Tons) 55

TABLE NO. 25. : Global Type 5 Pharmaceutical Excipients Market Volume, By Region, 2023– 2030 (Kilo Tons) 55

TABLE NO. 26. : Global Type 5 Pharmaceutical Excipients Market Revenue, By Region, 2017 – 2022 (USD Million) 56

TABLE NO. 27. : Global Type 5 Pharmaceutical Excipients Market Revenue, By Region, 2023– 2030 (USD Million) 56

TABLE NO. 28. : Global Pharmaceutical Excipients for Binders Market Volume, By Region, 2017 – 2022 (Kilo Tons) 59

TABLE NO. 29. : Global Pharmaceutical Excipients for Binders Market Volume, By Region, 2023– 2030 (Kilo Tons) 59

TABLE NO. 30. : Global Pharmaceutical Excipients for Binders Market Revenue, By Region, 2017 – 2022 (USD Million) 60

TABLE NO. 31. : Global Pharmaceutical Excipients for Binders Market Revenue, By Region, 2023– 2030 (USD Million) 60

TABLE NO. 32. : Global Pharmaceutical Excipients for Fillers and diluents Market Volume, By Region, 2017 – 2022 (Kilo Tons) 61

TABLE NO. 33. : Global Pharmaceutical Excipients for Fillers and diluents Market Volume, By Region, 2023– 2030 (Kilo Tons) 61

TABLE NO. 34. : Global Pharmaceutical Excipients for Fillers and diluents Market Revenue, By Region, 2017 – 2022 (USD Million) 62

TABLE NO. 35. : Global Pharmaceutical Excipients for Fillers and diluents Market Revenue, By Region, 2023– 2030 (USD Million) 62

TABLE NO. 36. : Global Pharmaceutical Excipients for Disintegrants Market Volume, By Region, 2017 – 2022 (Kilo Tons) 63

TABLE NO. 37. : Global Pharmaceutical Excipients for Disintegrants Market Volume, By Region, 2023– 2030 (Kilo Tons) 63

TABLE NO. 38. : Global Pharmaceutical Excipients for Disintegrants Market Revenue, By Region, 2017 – 2022 (USD Million) 64

TABLE NO. 39. : Global Pharmaceutical Excipients for Disintegrants Market Revenue, By Region, 2023– 2030 (USD Million) 64

TABLE NO. 40. : Global Pharmaceutical Excipients for Lubricants and glidants Market Volume, By Region, 2017 – 2022 (Kilo Tons) 65

TABLE NO. 41. : Global Pharmaceutical Excipients for Lubricants and glidants Market Volume, By Region, 2023– 2030 (Kilo Tons) 65

TABLE NO. 42. : Global Pharmaceutical Excipients for Lubricants and glidants Market Revenue, By Region, 2017 – 2022 (USD Million) 66

TABLE NO. 43. : Global Pharmaceutical Excipients for Lubricants and glidants Market Revenue, By Region, 2023– 2030 (USD Million) 66

TABLE NO. 44. : Global Pharmaceutical Excipients for Coatings & Preservatives Market Volume, By Region, 2017 – 2022 (Kilo Tons) 67

TABLE NO. 45. : Global Pharmaceutical Excipients for Coatings & Preservatives Market Volume, By Region, 2023– 2030 (Kilo Tons) 67

TABLE NO. 46. : Global Pharmaceutical Excipients for Coatings & Preservatives Market Revenue, By Region, 2017 – 2022 (USD Million) 68

TABLE NO. 47. : Global Pharmaceutical Excipients for Coatings & Preservatives Market Revenue, By Region, 2023– 2030 (USD Million) 68

TABLE NO. 48. : Global Oral Formulations Pharmaceutical Excipients Market Volume, By Region, 2017 – 2022 (Kilo Tons) 71

TABLE NO. 49. : Global Oral Formulations Pharmaceutical Excipients Market Volume, By Region, 2023– 2030 (Kilo Tons) 71

TABLE NO. 50. : Global Oral Formulations Pharmaceutical Excipients Market Revenue, By Region, 2017 – 2022 (USD Million) 72

TABLE NO. 51. : Global Oral Formulations Pharmaceutical Excipients Market Revenue, By Region, 2023– 2030 (USD Million) 72

TABLE NO. 52. : Global Tablets Pharmaceutical Excipients Market Volume, By Region, 2017 – 2022 (Kilo Tons) 73

TABLE NO. 53. : Global Tablets Pharmaceutical Excipients Market Volume, By Region, 2023– 2030 (Kilo Tons) 73

TABLE NO. 54. : Global Tablets Pharmaceutical Excipients Market Revenue, By Region, 2017 – 2022 (USD Million) 74

TABLE NO. 55. : Global Tablets Pharmaceutical Excipients Market Revenue, By Region, 2023– 2030 (USD Million) 74

TABLE NO. 56. : Global Capsules Pharmaceutical Excipients Market Volume, By Region, 2017 – 2022 (Kilo Tons) 75

TABLE NO. 57. : Global Capsules Pharmaceutical Excipients Market Volume, By Region, 2023– 2030 (Kilo Tons) 75

TABLE NO. 58. : Global Capsules Pharmaceutical Excipients Market Revenue, By Region, 2017 – 2022 (USD Million) 76

TABLE NO. 59. : Global Capsules Pharmaceutical Excipients Market Revenue, By Region, 2023– 2030 (USD Million) 76

TABLE NO. 60. : Global Parenteral Formulations Pharmaceutical Excipients Market Volume, By Region, 2017 – 2022 (Kilo Tons) 77

TABLE NO. 61. : Global Parenteral Formulations Pharmaceutical Excipients Market Volume, By Region, 2023– 2030 (Kilo Tons) 77

TABLE NO. 62. : Global Parenteral Formulations Pharmaceutical Excipients Market Revenue, By Region, 2017 – 2022 (USD Million) 78

TABLE NO. 63. : Global Parenteral Formulations Pharmaceutical Excipients Market Revenue, By Region, 2023– 2030 (USD Million) 78

TABLE NO. 64. : Global Topical Formulations Pharmaceutical Excipients Market Volume, By Region, 2017 – 2022 (Kilo Tons) 79

TABLE NO. 65. : Global Topical Formulations Pharmaceutical Excipients Market Volume, By Region, 2023– 2030 (Kilo Tons) 79

TABLE NO. 66. : Global Topical Formulations Pharmaceutical Excipients Market Revenue, By Region, 2017 – 2022 (USD Million) 80

TABLE NO. 67. : Global Topical Formulations Pharmaceutical Excipients Market Revenue, By Region, 2023– 2030 (USD Million) 80

TABLE NO. 68. : Global Pharmaceutical Excipients Market Volume, By Region, 2017 – 2022 (Kilo Tons) 83

TABLE NO. 69. : Global Pharmaceutical Excipients Market Volume, By Region, 2023– 2030 (Kilo Tons) 83

TABLE NO. 70. : Global Pharmaceutical Excipients Market Revenue, By Region, 2017 – 2022 (USD Million) 84

TABLE NO. 71. : Global Pharmaceutical Excipients Market Revenue, By Region, 2023– 2030 (USD Million) 84

TABLE NO. 72. : Global Pharmaceutical Excipients Market Volume, By Type, 2017 – 2022 (Kilo Tons) 85

TABLE NO. 73. : Global Pharmaceutical Excipients Market Volume, By Type, 2023– 2030 (Kilo Tons) 85

TABLE NO. 74. : Global Pharmaceutical Excipients Market Revenue, By Type, 2017 – 2022 (USD Million) 86

TABLE NO. 75. : Global Pharmaceutical Excipients Market Revenue, By Type, 2023– 2030 (USD Million) 86

TABLE NO. 76. : Global Pharmaceutical Excipients Market Volume, By Application, 2017 – 2022 (Kilo Tons) 87

TABLE NO. 77. : Global Pharmaceutical Excipients Market Volume, By Application, 2023– 2030 (Kilo Tons) 87

TABLE NO. 78. : Global Pharmaceutical Excipients Market Revenue, By Application, 2017 – 2022 (USD Million) 88

TABLE NO. 79. : Global Pharmaceutical Excipients Market Revenue, By Application, 2023– 2030 (USD Million) 88

TABLE NO. 80. : Global Pharmaceutical Excipients Market Volume, By Formulation, 2017 – 2022 (Kilo Tons) 89

TABLE NO. 81. : Global Pharmaceutical Excipients Market Volume, By Formulation, 2023– 2030 (Kilo Tons) 89

TABLE NO. 82. : Global Pharmaceutical Excipients Market Revenue, By Formulation, 2017 – 2022 (USD Million) 90

TABLE NO. 83. : Global Pharmaceutical Excipients Market Revenue, By Formulation, 2023– 2030 (USD Million) 90

TABLE NO. 84. : North America Pharmaceutical Excipients Market Volume, By Country, 2017 – 2022 (Kilo Tons) 92

TABLE NO. 85. : North America Pharmaceutical Excipients Market Volume, By Country, 2023– 2030 (Kilo Tons) 92

TABLE NO. 86. : North America Pharmaceutical Excipients Market Revenue, By Country, 2017 – 2022 (USD Million) 92

TABLE NO. 87. : North America Pharmaceutical Excipients Market Revenue, By Country, 2023– 2030 (USD Million) 92

TABLE NO. 88. : North America Pharmaceutical Excipients Market Volume, By Type, 2017 – 2022 (Kilo Tons) 93

TABLE NO. 89. : North America Pharmaceutical Excipients Market Volume, By Type, 2023– 2030 (Kilo Tons) 93

TABLE NO. 90. : North America Pharmaceutical Excipients Market Revenue, By Type, 2017 – 2022 (USD Million) 94

TABLE NO. 91. : North America Pharmaceutical Excipients Market Revenue, By Type, 2023– 2030 (USD Million) 94

TABLE NO. 92. : North America Pharmaceutical Excipients Market Volume, By Application, 2017 – 2022 (Kilo Tons) 95

TABLE NO. 93. : North America Pharmaceutical Excipients Market Volume, By Application, 2023– 2030 (Kilo Tons) 95

TABLE NO. 94. : North America Pharmaceutical Excipients Market Revenue, By Application, 2017 – 2022 (USD Million) 96

TABLE NO. 95. : North America Pharmaceutical Excipients Market Revenue, By Application, 2023– 2030 (USD Million) 96

TABLE NO. 96. : North America Pharmaceutical Excipients Market Volume, By Formulation, 2017 – 2022 (Kilo Tons) 97

TABLE NO. 97. : North America Pharmaceutical Excipients Market Volume, By Formulation, 2023– 2030 (Kilo Tons) 97

TABLE NO. 98. : North America Pharmaceutical Excipients Market Revenue, By Formulation, 2017 – 2022 (USD Million) 98

TABLE NO. 99. : North America Pharmaceutical Excipients Market Revenue, By Formulation, 2023– 2030 (USD Million) 98

TABLE NO. 100. : Europe Pharmaceutical Excipients Market Volume, By Country, 2017 – 2022 (Kilo Tons) 101

TABLE NO. 101. : Europe Pharmaceutical Excipients Market Volume, By Country, 2023– 2030 (Kilo Tons) 101

TABLE NO. 102. : Europe Pharmaceutical Excipients Market Revenue, By Country, 2017 – 2022 (USD Million) 102

TABLE NO. 103. : Europe Pharmaceutical Excipients Market Revenue, By Country, 2023– 2030 (USD Million) 102

TABLE NO. 104. : Europe Pharmaceutical Excipients Market Volume, By Type, 2017 – 2022 (Kilo Tons) 103

TABLE NO. 105. : Europe Pharmaceutical Excipients Market Volume, By Type, 2023– 2030 (Kilo Tons) 103

TABLE NO. 106. : Europe Pharmaceutical Excipients Market Revenue, By Type, 2017 – 2022 (USD Million) 104

TABLE NO. 107. : Europe Pharmaceutical Excipients Market Revenue, By Type, 2023– 2030 (USD Million) 104

TABLE NO. 108. : Europe Pharmaceutical Excipients Market Volume, By Application, 2017 – 2022 (Kilo Tons) 105

TABLE NO. 109. : Europe Pharmaceutical Excipients Market Volume, By Application, 2023– 2030 (Kilo Tons) 105

TABLE NO. 110. : Europe Pharmaceutical Excipients Market Revenue, By Application, 2017 – 2022 (USD Million) 106

TABLE NO. 111. : Europe Pharmaceutical Excipients Market Revenue, By Application, 2023– 2030 (USD Million) 106

TABLE NO. 112. : Europe Pharmaceutical Excipients Market Volume, By Formulation, 2017 – 2022 (Kilo Tons) 107

TABLE NO. 113. : Europe Pharmaceutical Excipients Market Volume, By Formulation, 2023– 2030 (Kilo Tons) 107

TABLE NO. 114. : Europe Pharmaceutical Excipients Market Revenue, By Formulation, 2017 – 2022 (USD Million) 108

TABLE NO. 115. : Europe Pharmaceutical Excipients Market Revenue, By Formulation, 2023– 2030 (USD Million) 108

TABLE NO. 116. : Asia Pacific Pharmaceutical Excipients Market Volume, By Country, 2017 – 2022 (Kilo Tons) 111

TABLE NO. 117. : Asia Pacific Pharmaceutical Excipients Market Volume, By Country, 2023– 2030 (Kilo Tons) 111

TABLE NO. 118. : Asia Pacific Pharmaceutical Excipients Market Revenue, By Country, 2017 – 2022 (USD Million) 112

TABLE NO. 119. : Asia Pacific Pharmaceutical Excipients Market Revenue, By Country, 2023– 2030 (USD Million) 112

TABLE NO. 120. : Asia Pacific Pharmaceutical Excipients Market Volume, By Type, 2017 – 2022 (Kilo Tons) 113

TABLE NO. 121. : Asia Pacific Pharmaceutical Excipients Market Volume, By Type, 2023– 2030 (Kilo Tons) 113

TABLE NO. 122. : Asia Pacific Pharmaceutical Excipients Market Revenue, By Type, 2017 – 2022 (USD Million) 114

TABLE NO. 123. : Asia Pacific Pharmaceutical Excipients Market Revenue, By Type, 2023– 2030 (USD Million) 114

TABLE NO. 124. : Asia Pacific Pharmaceutical Excipients Market Volume, By Application, 2017 – 2022 (Kilo Tons) 115

TABLE NO. 125. : Asia Pacific Pharmaceutical Excipients Market Volume, By Application, 2023– 2030 (Kilo Tons) 115

TABLE NO. 126. : Asia Pacific Pharmaceutical Excipients Market Revenue, By Application, 2017 – 2022 (USD Million) 116

TABLE NO. 127. : Asia Pacific Pharmaceutical Excipients Market Revenue, By Application, 2023– 2030 (USD Million) 116

TABLE NO. 128. : Asia Pacific Pharmaceutical Excipients Market Volume, By Formulation, 2017 – 2022 (Kilo Tons) 117

TABLE NO. 129. : Asia Pacific Pharmaceutical Excipients Market Volume, By Formulation, 2023– 2030 (Kilo Tons) 117

TABLE NO. 130. : Asia Pacific Pharmaceutical Excipients Market Revenue, By Formulation, 2017 – 2022 (USD Million) 118

TABLE NO. 131. : Asia Pacific Pharmaceutical Excipients Market Revenue, By Formulation, 2023– 2030 (USD Million) 118

TABLE NO. 132. : Latin America Pharmaceutical Excipients Market Volume, By Country, 2017 – 2022 (Kilo Tons) 121

TABLE NO. 133. : Latin America Pharmaceutical Excipients Market Volume, By Country, 2023– 2030 (Kilo Tons) 121

TABLE NO. 134. : Latin America Pharmaceutical Excipients Market Revenue, By Country, 2017 – 2022 (USD Million) 122

TABLE NO. 135. : Latin America Pharmaceutical Excipients Market Revenue, By Country, 2023– 2030 (USD Million) 122

TABLE NO. 136. : Latin America Pharmaceutical Excipients Market Volume, By Type, 2017 – 2022 (Kilo Tons) 123

TABLE NO. 137. : Latin America Pharmaceutical Excipients Market Volume, By Type, 2023– 2030 (Kilo Tons) 123

TABLE NO. 138. : Latin America Pharmaceutical Excipients Market Revenue, By Type, 2017 – 2022 (USD Million) 124

TABLE NO. 139. : Latin America Pharmaceutical Excipients Market Revenue, By Type, 2023– 2030 (USD Million) 124

TABLE NO. 140. : Latin America Pharmaceutical Excipients Market Volume, By Application, 2017 – 2022 (Kilo Tons) 125

TABLE NO. 141. : Latin America Pharmaceutical Excipients Market Volume, By Application, 2023– 2030 (Kilo Tons) 125

TABLE NO. 142. : Latin America Pharmaceutical Excipients Market Revenue, By Application, 2017 – 2022 (USD Million) 126

TABLE NO. 143. : Latin America Pharmaceutical Excipients Market Revenue, By Application, 2023– 2030 (USD Million) 126

TABLE NO. 144. : Latin America Pharmaceutical Excipients Market Volume, By Formulation, 2017 – 2022 (Kilo Tons) 127

TABLE NO. 145. : Latin America Pharmaceutical Excipients Market Volume, By Formulation, 2023– 2030 (Kilo Tons) 127

TABLE NO. 146. : Latin America Pharmaceutical Excipients Market Revenue, By Formulation, 2017 – 2022 (USD Million) 128

TABLE NO. 147. : Latin America Pharmaceutical Excipients Market Revenue, By Formulation, 2023– 2030 (USD Million) 128

TABLE NO. 148. : Middle East Pharmaceutical Excipients Market Volume, By Country, 2017 – 2022 (Kilo Tons) 131

TABLE NO. 149. : Middle East Pharmaceutical Excipients Market Volume, By Country, 2023– 2030 (Kilo Tons) 131

TABLE NO. 150. : Middle East Pharmaceutical Excipients Market Revenue, By Country, 2017 – 2022 (USD Million) 132

TABLE NO. 151. : Middle East Pharmaceutical Excipients Market Revenue, By Country, 2023– 2030 (USD Million) 132

TABLE NO. 152. : Middle East Pharmaceutical Excipients Market Volume, By Type, 2017 – 2022 (Kilo Tons) 133

TABLE NO. 153. : Middle East Pharmaceutical Excipients Market Volume, By Type, 2023– 2030 (Kilo Tons) 133

TABLE NO. 154. : Middle East Pharmaceutical Excipients Market Revenue, By Type, 2017 – 2022 (USD Million) 134

TABLE NO. 155. : Middle East Pharmaceutical Excipients Market Revenue, By Type, 2023– 2030 (USD Million) 134

TABLE NO. 156. : Middle East Pharmaceutical Excipients Market Volume, By Application, 2017 – 2022 (Kilo Tons) 135

TABLE NO. 157. : Middle East Pharmaceutical Excipients Market Volume, By Application, 2023– 2030 (Kilo Tons) 135

TABLE NO. 158. : Middle East Pharmaceutical Excipients Market Revenue, By Application, 2017 – 2022 (USD Million) 136

TABLE NO. 159. : Middle East Pharmaceutical Excipients Market Revenue, By Application, 2023– 2030 (USD Million) 136

TABLE NO. 160. : Middle East Pharmaceutical Excipients Market Volume, By Formulation, 2017 – 2022 (Kilo Tons) 137

TABLE NO. 161. : Middle East Pharmaceutical Excipients Market Volume, By Formulation, 2023– 2030 (Kilo Tons) 137

TABLE NO. 162. : Middle East Pharmaceutical Excipients Market Revenue, By Formulation, 2017 – 2022 (USD Million) 138

TABLE NO. 163. : Middle East Pharmaceutical Excipients Market Revenue, By Formulation, 2023– 2030 (USD Million) 138

TABLE NO. 164. : Africa Pharmaceutical Excipients Market Volume, By Country, 2017 – 2022 (Kilo Tons) 141

TABLE NO. 165. : Africa Pharmaceutical Excipients Market Volume, By Country, 2023– 2030 (Kilo Tons) 141

TABLE NO. 166. : Africa Pharmaceutical Excipients Market Revenue, By Country, 2017 – 2022 (USD Million) 142

TABLE NO. 167. : Africa Pharmaceutical Excipients Market Revenue, By Country, 2023– 2030 (USD Million) 142

TABLE NO. 168. : Africa Pharmaceutical Excipients Market Volume, By Type, 2017 – 2022 (Kilo Tons) 143

TABLE NO. 169. : Africa Pharmaceutical Excipients Market Volume, By Type, 2023– 2030 (Kilo Tons) 143

TABLE NO. 170. : Africa Pharmaceutical Excipients Market Revenue, By Type, 2017 – 2022 (USD Million) 144

TABLE NO. 171. : Africa Pharmaceutical Excipients Market Revenue, By Type, 2023– 2030 (USD Million) 144

TABLE NO. 172. : Africa Pharmaceutical Excipients Market Volume, By Application, 2017 – 2022 (Kilo Tons) 145

TABLE NO. 173. : Africa Pharmaceutical Excipients Market Volume, By Application, 2023– 2030 (Kilo Tons) 145

TABLE NO. 174. : Africa Pharmaceutical Excipients Market Revenue, By Application, 2017 – 2022 (USD Million) 146

TABLE NO. 175. : Africa Pharmaceutical Excipients Market Revenue, By Application, 2023– 2030 (USD Million) 146

TABLE NO. 176. : Africa Pharmaceutical Excipients Market Volume, By Formulation, 2017 – 2022 (Kilo Tons) 147

TABLE NO. 177. : Africa Pharmaceutical Excipients Market Volume, By Formulation, 2023– 2030 (Kilo Tons) 147

TABLE NO. 178. : Africa Pharmaceutical Excipients Market Revenue, By Formulation, 2017 – 2022 (USD Million) 148

TABLE NO. 179. : Africa Pharmaceutical Excipients Market Revenue, By Formulation, 2023– 2030 (USD Million) 148

Frequently Asked Questions:

What are pharmaceutical excipients?

Pharmaceutical excipients are inert substances used to formulate pharmaceutical pills. They aren’t intended to have any therapeutic effect. Still, they’re included in drug formulations for useful resource manufacturing, improve stability, enhance drug transport, and offer precise functionalities inclusive of binding, disintegration, or taste masking.

What are the key types of pharmaceutical excipients in the market?

There are various types of pharmaceutical excipients available inside the marketplace, including binders, fillers, disintegrants, lubricants, preservatives, coatings, solvents, flavoring agents, sweeteners, and colorants. Each excipient type serves a particular purpose in the formulation of pharmaceutical tablets.

What is the function of pharmaceutical excipients in drug formulation?

Pharmaceutical excipients play several essential roles in drug formulation. They can improve the stability of medication, control drug release profiles, enhance bioavailability, provide bulk to solid dosage forms, enhance flavor and appearance, facilitate drug solubility, and ensure uniformity and consistency in drug manufacturing.

What factors are driving the growth of the pharmaceutical excipients marketplace?          

The pharmaceutical excipients marketplace is driven by several elements, inclusive of the increasing demand for generic drugs, the growing pharmaceutical industry, the increasing prevalence of chronic diseases, improvements in drug delivery technology, increasing consciousness of patient-centric formulations, and the need for novel excipients to overcome formula challenges.

Are there any regulatory considerations for pharmaceutical excipients?

Pharmaceutical excipients are subject to regulatory oversight to ensure their safety and suitability for use in drug products. Regulatory bodies, such as, the U.S. Food and Drug Administration (FDA), and the European Medicines Agency (EMA) offer guidelines and standards for comparing, qualification, and labeling excipients.

What are the challenges faced by the pharmaceutical excipients market?

The pharmaceutical excipients marketplace faces challenges such as stringent regulatory requirements, the need for extensive compatibility studies with active pharmaceutical elements (APIs), the growing demand for natural and biodegradable excipients, and the need for excipients which are well suited with advanced drug delivery systems.

Which region dominates the pharmaceutical excipients marketplace?

The pharmaceutical excipients marketplace is globally distributed, with North America and Europe being the dominant regions due to their properly set up pharmaceutical industries and superior regulatory frameworks. However, the market is also expanding unexpectedly in emerging economies of Asia Pacific, Latin America, and the Middle East due to increasing investments in healthcare infrastructure.

How is the growing trend of personalized medicine influencing the pharmaceutical excipients marketplace?

Personalized medication, which offers individualized remedies primarily based on a patient’s particular needs and characteristics, drives the demand for custom-designed drug formulations. This trend influences the pharmaceutical excipients market via the growing need for excipients that may facilitate personalized dosage forms, controlled drug release, and targeted drug delivery systems.

Are there any advancements or innovations inside the pharmaceutical excipients market?

The pharmaceutical excipients marketplace is witnessing continuous innovations and advancements. These consist of developing multifunctional excipients that can carry out multiple roles in drug formulation, using nanotechnology to enhance drug delivery systems, incorporating natural and biodegradable excipients, and utilizing smart excipients for controlled drug release.

What is the future outlook for the pharmaceutical excipients marketplace?

The future outlook for the pharmaceutical excipients marketplace is promising. With the increasing demand for pharmaceutical capsules, the market is anticipated to grow steadily. Factors such as the development of novel excipients, the rising adoption of revolutionary drug delivery technology, and the focus on patient-centric formulations will probably drive the market’s growth in the coming years. Expanding the pharmaceutical industry in emerging economies is likewise predicted to present new opportunities for marketplace players.

Prostate Cancer Market

Published:
Report ID: 36273

Antineoplastic Agents Market

Published:
Report ID: 36065

US Retail Pharmacy Market

Published:
Report ID: 32801

OTC Vitamins Dietary Supplements Market

Published:
Report ID: 35994

Liposomes Market

Published:
Report ID: 35888

UK Iron Supplement Market

Published:
Report ID: 35709

U.S. Iron Supplement Market

Published:
Report ID: 35688

Malignant Ascites Market

Published:
Report ID: 11184

Middle East and Africa In-Vitro Fertilization (IVF) Market

Published:
Report ID: 35578

Chronic Myeloid Leukemia (CML) Treatment Market

Published:
Report ID: 2939

Combination Therapies In Aesthetics Market

Published:
Report ID: 35434

CAR T-Cell Therapy Market

Published:
Report ID: 2051

Purchase Options

$2999
Delivery Format: Excel.
$4999
Designed for the individual purchaser.
$6999
Users located at a single corporate site or regional office.
$7999
Allowed for unlimited sharing globally within one company.
Smallform of Sample request

Have a question?

User Profile

Don’t settle for less – trust Mitul to help you find the best solution.

Report delivery within 24 to 48 hours

– Other Info –

What people say?-

User Review

I am very impressed with the information in this report. The author clearly did their research when they came up with this product and it has already given me a lot of ideas.

Jana Schmidt
CEDAR CX Technologies

– Connect with us –

Phone

+91 6232 49 3207


support

24/7 Research Support


sales@credenceresearch.com

– Research Methodology –

Going beyond the basics: advanced techniques in research methodology

– Trusted By –

Pepshi, LG, Nestle
Motorola, Honeywell, Johnson and johnson
LG Chem, SIEMENS, Pfizer
Unilever, Samsonite, QIAGEN