Market Overview
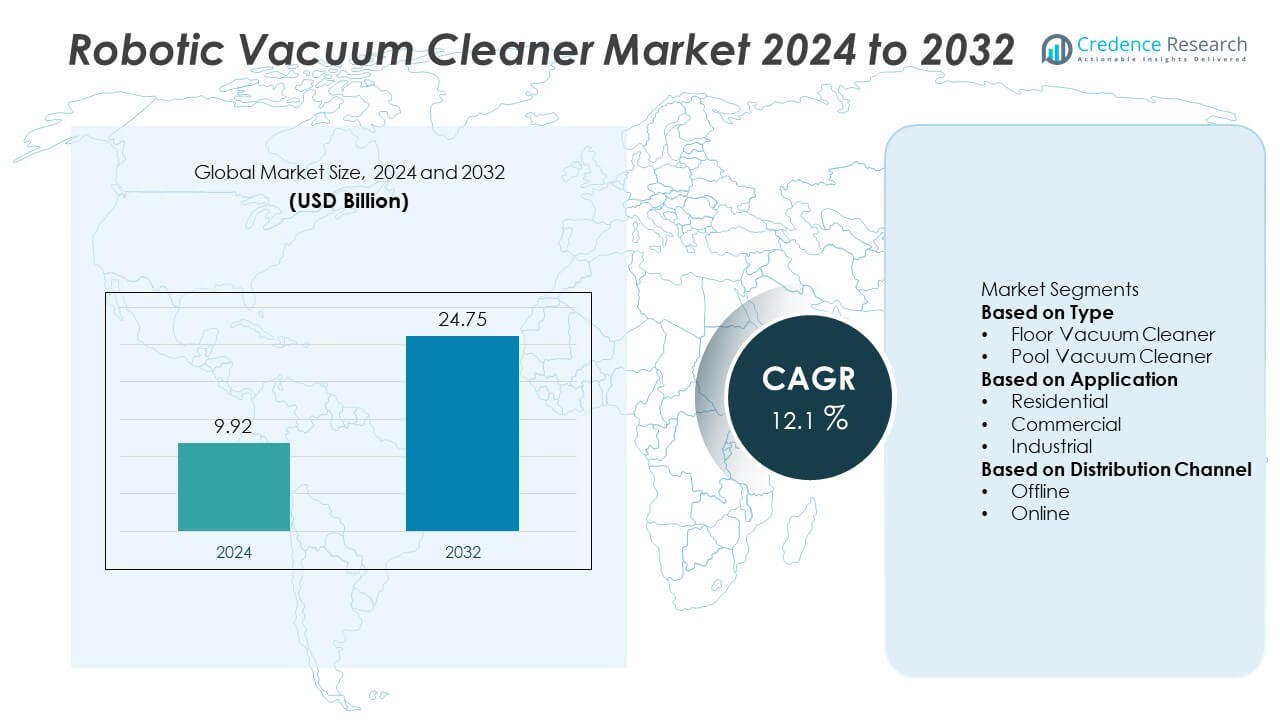
The robotic vacuum cleaner market was valued at USD 9.92 billion in 2024 and is projected to reach USD 24.75 billion by 2032, registering a CAGR of 12.1% during the forecast period.
| REPORT ATTRIBUTE |
DETAILS |
| Historical Period |
2020-2023 |
| Base Year |
2024 |
| Forecast Period |
2025-2032 |
| Robotic Vacuum Cleaner Market Size 2024 |
USD 9.92 Billion |
| Robotic Vacuum Cleaner Market, CAGR |
12.1% |
| Robotic Vacuum Cleaner Market Size 2032 |
USD 24.75 Billion |
The robotic vacuum cleaner market is led by major players including Dyson Ltd., Ecovacs Robotics, Panasonic Corporation, Neato Robotics, Inc., Samsung Electronics Co., Ltd., Xiaomi Corporation, SharkNinja Operating LLC, Beijing Roborock Technology Co., Ltd., iRobot Corporation, and Cecotec Innovaciones S.L. These companies dominate through strong product innovation, AI-based navigation, and advanced automation technologies that enhance cleaning performance and user experience. Dyson and iRobot lead in premium product design and smart mapping solutions, while Ecovacs and Roborock excel in hybrid vacuum-mop models. Regionally, North America held the largest share of 36% in 2024, driven by high smart home adoption and strong consumer preference for automated cleaning devices.
Access crucial information at unmatched prices!
Request your sample report today & start making informed decisions powered by Credence Research Inc.!
Download Sample
Market Insights
- The robotic vacuum cleaner market was valued at USD 9.92 billion in 2024 and is projected to reach USD 24.75 billion by 2032, registering a CAGR of 12.1%.
- Market growth is driven by rising demand for smart home technologies, growing disposable incomes, and increasing preference for automated cleaning solutions that reduce manual effort.
- The market is witnessing trends such as AI-based navigation, self-emptying features, and hybrid vacuum-mop systems that enhance performance and user convenience.
- Key players including Dyson Ltd., Ecovacs Robotics, iRobot Corporation, and Xiaomi Corporation focus on product innovation, smart connectivity, and expansion across online channels to strengthen global presence.
- North America led the market with 36% share in 2024, followed by Europe with 28% and Asia-Pacific with 27%, while the floor vacuum cleaner segment dominated with a 72% share, driven by widespread residential adoption and advanced automation technologies.
Market Segmentation Analysis:
By Type
The floor vacuum cleaner segment dominated the robotic vacuum cleaner market with a 72% share in 2024. Its dominance is attributed to growing household automation and increased demand for compact, self-operating cleaning devices. Floor vacuum cleaners are widely preferred for their ability to handle multiple surfaces such as hardwood, tile, and carpets. Manufacturers are integrating advanced features like LiDAR navigation, smart mapping, and auto dirt disposal to enhance performance and convenience. The rising penetration of AI-powered and voice-controlled cleaning systems continues to drive segment expansion across both residential and commercial spaces.
- For instance, Dyson introduced the 360 Vis Nav robot featuring a 110,000 rpm Hyperdymium motor, capable of detecting dust with a piezo sensor and providing 360° vision mapping.
By Application
The residential segment held the largest market share of 68% in 2024, driven by increasing consumer preference for smart home cleaning solutions. Rapid urbanization, busy lifestyles, and the growing adoption of connected home ecosystems are boosting demand for robotic vacuum cleaners in households. Users favor these devices for their ability to perform automated and scheduled cleaning with minimal supervision. Advancements in compact design, noise reduction, and real-time mapping technologies further enhance residential adoption. The rise in dual-income households and smart home integration trends continues to strengthen this segment’s dominance.
- For instance, iRobot’s Roomba Combo j9+ offers self-emptying and self-refilling capabilities via the Clean Base Auto-Fill Dock and features advanced Dirt Detective intelligence via the iRobot OS platform.
By Distribution Channel
The online distribution channel accounted for a 57% share of the robotic vacuum cleaner market in 2024, emerging as the leading segment. Growing e-commerce penetration and attractive digital promotions have encouraged consumers to purchase robotic cleaners online. Leading brands are leveraging direct-to-consumer platforms and offering virtual demonstrations, detailed product comparisons, and bundled service options to increase online sales. The availability of a wide product range, quick delivery options, and seasonal discounts further enhance adoption. As consumers increasingly rely on digital channels for household appliances, online sales are expected to maintain strong growth momentum.
Key Growth Drivers
Rising Adoption of Smart Home Ecosystems
The growing integration of smart home technologies is driving the robotic vacuum cleaner market. Consumers increasingly prefer automated devices that sync with home assistants and mobile apps for hands-free cleaning. The convenience of voice control through systems like Alexa and Google Home enhances usability and appeal. As global smart home penetration rises, manufacturers are focusing on developing AI-enabled cleaners that offer real-time mapping, obstacle detection, and remote monitoring, creating significant demand across urban and tech-driven households.
- For instance, Ecovacs Robotics developed the DEEBOT X2 Omni, which uses AI-powered AIVI 3D 2.0 with an upgraded RGBD sensor and dual-laser LiDAR for intelligent navigation, precise 3D mapping, and accurate obstacle avoidance.
Increasing Disposable Income and Urban Living
Rising disposable incomes and rapid urbanization are boosting the adoption of robotic vacuum cleaners worldwide. Consumers in metropolitan areas are prioritizing time-saving, automated cleaning solutions to suit their busy lifestyles. Compact living spaces and growing awareness of hygiene and home automation further support product demand. The increasing affordability of mid-range robotic models with advanced features such as self-charging and multi-surface cleaning also strengthens market expansion among middle-income households.
- For instance, SharkNinja’s AI Ultra Robot incorporates a self-cleaning brushroll and precision mapping system powered by a 360° LiDAR scanner, optimizing performance in compact apartments and high-traffic urban homes.
Technological Advancements in Cleaning Systems
Continuous innovation in robotics and sensor technologies is enhancing cleaning efficiency and user experience. Modern robotic vacuum cleaners are equipped with AI-based navigation, LiDAR sensors, and smart mapping for precise and adaptive cleaning. Improved battery life and suction power allow longer and deeper cleaning cycles. Manufacturers are integrating dirt detection sensors and self-emptying dustbins to minimize maintenance efforts. These advancements are transforming traditional cleaning practices, increasing consumer confidence, and fueling long-term adoption across residential and commercial spaces.
Key Trends & Opportunities
Integration of AI and IoT for Intelligent Cleaning
Artificial intelligence and IoT connectivity are redefining robotic cleaning performance. Smart vacuum cleaners now learn floor layouts, detect high-dust zones, and adjust cleaning routes dynamically. IoT integration allows users to control and monitor devices remotely via smartphones. Real-time data analysis helps improve cleaning patterns and energy efficiency. This technological evolution opens opportunities for manufacturers to design more adaptive and user-centric models that align with the broader trend of intelligent home automation.
- For instance, Roborock’s S8 MaxV Ultra uses a Reactive AI 2.0 system with an RGB camera and 3D structured light to detect and navigate around up to 73 object types. The vacuum uses this technology to skillfully navigate floors, avoiding items such as shoes, pet waste, and floor mirrors.
Growing Popularity of Self-Emptying and Hybrid Models
Self-emptying and hybrid robotic vacuum cleaners that combine mopping and vacuuming functions are gaining rapid traction. These models reduce manual maintenance while ensuring comprehensive cleaning across various floor types. Manufacturers are focusing on developing all-in-one devices equipped with automatic water refilling and dust disposal systems. The convenience of dual functionality and improved autonomy is attracting both residential and commercial users. This trend is expected to shape future product innovation and premium segment growth.
- For instance, Dreame Technology’s L20 Ultra uses a dual-rotary mop and a self-cleaning dock that automatically empties, refills, washes, and hot-air dries the mop pads, ensuring continuous and hygienic performance.
Expansion of E-Commerce Distribution Channels
The rapid growth of e-commerce platforms presents major opportunities for robotic vacuum cleaner manufacturers. Online retail enables wider product visibility, direct consumer engagement, and efficient distribution. Brands are using digital platforms to offer virtual demos, detailed comparisons, and customer feedback-driven designs. The availability of global brands through online marketplaces and regional websites enhances market accessibility, especially in emerging economies. Increasing online penetration continues to accelerate sales and strengthen brand reach across key regions.
Key Challenges
High Product Cost and Limited Affordability
The high initial cost of robotic vacuum cleaners remains a key barrier to mass adoption, particularly in developing economies. Premium models with advanced navigation, AI features, and self-cleaning systems often exceed the average household budget. Consumers in price-sensitive markets still prefer traditional cleaning equipment. Manufacturers must balance innovation and affordability through modular designs and cost-efficient production. Expanding mid-range product lines and financing options will be essential to broaden market penetration.
Maintenance and Battery Performance Issues
Maintenance complexity and limited battery life continue to challenge product reliability. Frequent cleaning of filters, brushes, and sensors increases user inconvenience. Battery degradation over time reduces efficiency, especially for larger cleaning areas. These issues affect long-term satisfaction and replacement cycles. Manufacturers are focusing on developing longer-lasting lithium-ion batteries and self-maintenance technologies to overcome these limitations. Enhancing durability and ease of use will remain vital for sustaining customer loyalty and long-term adoption.
Regional Analysis
North America
North America dominated the robotic vacuum cleaner market with a 36% share in 2024. The region’s leadership is driven by strong adoption of smart home devices and increasing consumer focus on automated cleaning solutions. The United States remains the key contributor, supported by high disposable income and rapid integration of AI-enabled home appliances. Continuous innovation from major brands and the popularity of voice-controlled vacuum systems also strengthen growth. Expanding e-commerce platforms and the growing preference for premium models further enhance market penetration across urban households in the region.
Europe
Europe accounted for 28% of the robotic vacuum cleaner market share in 2024, fueled by rising awareness of energy-efficient and time-saving cleaning technologies. Consumers across Germany, the United Kingdom, and France are adopting robotic systems as part of modern home automation. Stringent labor costs and high demand for hygienic living environments drive the need for autonomous cleaning devices. Regional manufacturers are investing in compact, quiet, and multi-surface vacuum cleaners to meet urban living preferences. Integration with smart assistants and sustainability-focused designs further support market expansion across European households.
Asia-Pacific
Asia-Pacific held a 27% market share in 2024, emerging as the fastest-growing region in the robotic vacuum cleaner market. Rapid urbanization, increasing middle-class income, and strong growth in smart home adoption are fueling demand. China, Japan, and South Korea dominate production and consumption due to technological innovation and affordability. Local manufacturers are developing cost-effective, AI-powered models with advanced navigation systems. Growing awareness of hygiene, particularly in densely populated cities, further supports adoption. The expansion of online retail channels and rising preference for intelligent household appliances continue to accelerate regional growth.
Latin America
Latin America represented a 6% share of the robotic vacuum cleaner market in 2024. Growth is supported by rising urban populations and gradual technological adoption in Brazil, Mexico, and Argentina. Increasing availability of affordable models through online platforms and retail outlets has improved accessibility. Consumers are showing growing interest in compact robotic cleaners that suit smaller living spaces. Regional distributors and global brands are collaborating to introduce localized products and customer support networks. Expanding e-commerce penetration and rising awareness of home automation continue to strengthen market presence in the region.
Middle East & Africa
The Middle East & Africa accounted for a 3% share in 2024, reflecting growing potential in premium home appliance adoption. Wealthier Gulf nations, including the UAE and Saudi Arabia, are leading adoption due to high smart home integration and tech-savvy consumers. The market benefits from expanding retail networks and increasing consumer interest in time-saving household solutions. Manufacturers are introducing energy-efficient and Wi-Fi-enabled robotic models to match regional lifestyles. Although adoption remains limited in parts of Africa, improving internet connectivity and growing middle-class populations support gradual market expansion.
Market Segmentations:
By Type
- Floor Vacuum Cleaner
- Pool Vacuum Cleaner
By Application
- Residential
- Commercial
- Industrial
By Distribution Channel
By Geography
- North America
- Europe
- Germany
- France
- U.K.
- Italy
- Spain
- Rest of Europe
- Asia Pacific
- China
- Japan
- India
- South Korea
- South-east Asia
- Rest of Asia Pacific
- Latin America
- Brazil
- Argentina
- Rest of Latin America
- Middle East & Africa
- GCC Countries
- South Africa
- Rest of the Middle East and Africa
Competitive Landscape
The competitive landscape of the robotic vacuum cleaner market is shaped by leading players such as Dyson Ltd., Ecovacs Robotics, Panasonic Corporation, Neato Robotics, Inc., Samsung Electronics Co., Ltd., Xiaomi Corporation, SharkNinja Operating LLC, Beijing Roborock Technology Co., Ltd., iRobot Corporation, and Cecotec Innovaciones S.L. These companies focus on innovation, automation, and advanced cleaning technologies to enhance performance and user convenience. The competition centers around AI-based navigation, LiDAR mapping, and multi-surface cleaning systems. Key players are investing in smart connectivity, integrating voice control and app-based management to strengthen customer engagement. Partnerships with e-commerce platforms and expansion into emerging markets are further supporting global reach. Product differentiation through design efficiency, battery performance, and automated self-cleaning functions continues to define market competitiveness. As consumer demand for intelligent and energy-efficient home solutions rises, manufacturers are prioritizing sustainability, affordability, and premium product development to maintain market leadership.
Shape Your Report to Specific Countries or Regions & Enjoy 30% Off!
Key Player Analysis
- Dyson Ltd.
- Ecovacs Robotics
- Panasonic Corporation
- Neato Robotics, Inc.
- Samsung Electronics Co., Ltd.
- Xiaomi Corporation
- SharkNinja Operating LLC
- Beijing Roborock Technology Co., Ltd.
- iRobot Corporation
- Cecotec Innovaciones S.L.
Recent Developments
- In September 2025, Ecovacs Robotics unveiled its flagship DEEBOT X11 featuring “PowerBoost Technology” to deliver perpetual runtime.
- In March 2025, Samsung launched the brand’s 2025 lineup of robot vacuum cleaners, including the Bespoke AI Jet Bot Steam Ultra.
- In 2025, Ecovacs revealed the DEEBOT X8 PRO OMNI family with OZMO ROLLER mopping and AIVI 3D obstacle-avoidance at CES 2025.
Report Coverage
The research report offers an in-depth analysis based on Type, Application, Distribution Channel and Geography. It details leading market players, providing an overview of their business, product offerings, investments, revenue streams, and key applications. Additionally, the report includes insights into the competitive environment, SWOT analysis, current market trends, as well as the primary drivers and constraints. Furthermore, it discusses various factors that have driven market expansion in recent years. The report also explores market dynamics, regulatory scenarios, and technological advancements that are shaping the industry. It assesses the impact of external factors and global economic changes on market growth. Lastly, it provides strategic recommendations for new entrants and established companies to navigate the complexities of the market.
Future Outlook
- The demand for robotic vacuum cleaners will continue to rise with expanding smart home adoption.
- Integration of AI and machine learning will enhance navigation accuracy and cleaning efficiency.
- Hybrid models combining vacuuming and mopping functions will gain stronger market traction.
- Manufacturers will focus on energy-efficient and eco-friendly designs to meet sustainability goals.
- Advancements in sensor and LiDAR technologies will improve obstacle detection and mapping precision.
- Online sales channels will expand further, driven by consumer preference for digital purchases.
- Compact and budget-friendly models will attract middle-income households in emerging markets.
- Premium robotic cleaners with self-emptying and voice-controlled features will dominate urban markets.
- Asia-Pacific will emerge as the fastest-growing region, supported by rapid urbanization and income growth.
- Continuous innovation and partnerships with smart home platforms will define the next phase of market competition.


