
Market Overview:
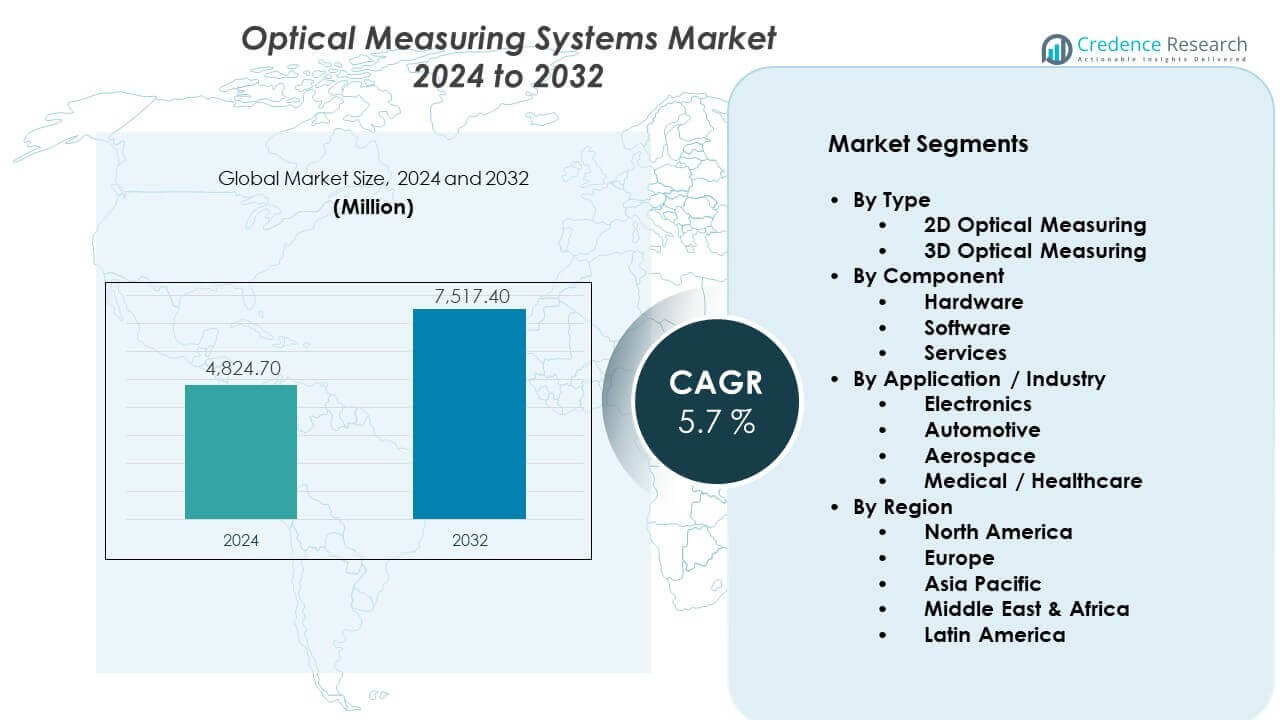
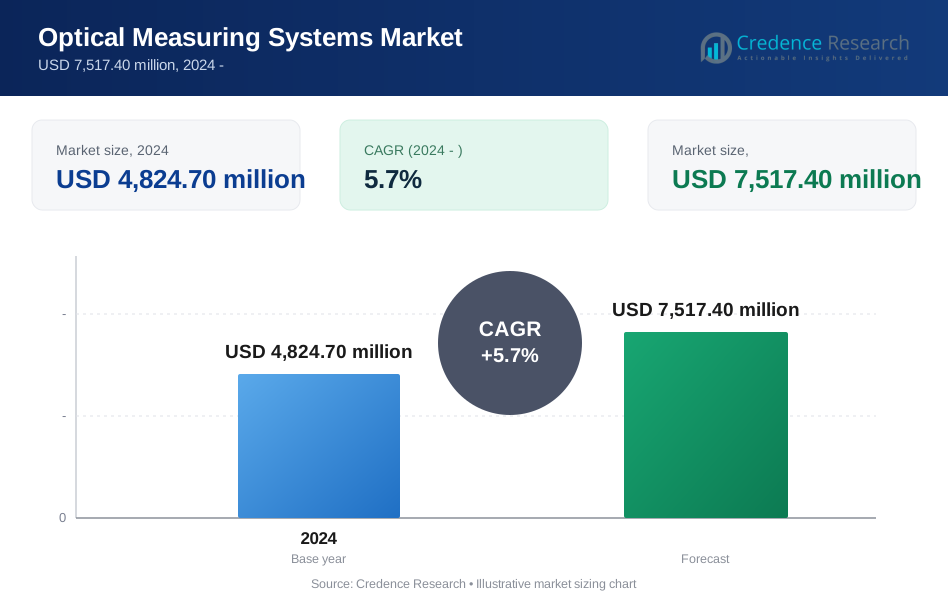
The Optical measuring systems market is projected to grow from USD 4,824.70 million in 2024 to an estimated USD 7,517.40 million by 2032. The market is expected to register a CAGR of 5.7% from 2024 to 2032.
| REPORT ATTRIBUTE | DETAILS |
|---|---|
| Historical Period | 2020-2023 |
| Base Year | 2024 |
| Forecast Period | 2025-2032 |
| Optical Measuring Systems Market Size 2024 | USD 4,824.70 million |
| Optical Measuring Systems Market, CAGR | 5.7% |
| Optical Measuring Systems Market Size 2032 | USD 7,517.40 million |
Market growth is driven by rising precision needs in manufacturing and engineering operations. Automotive and aerospace producers use optical systems for complex part inspection. Electronics manufacturers rely on these systems for micro-level accuracy. Non-contact measurement reduces material damage and inspection time. Automation trends support wider system adoption across production lines. Smart factories increase demand for real-time measurement data. Software upgrades improve speed, accuracy, and system usability. Industry focus on waste reduction strengthens demand. Quality compliance requirements further support steady market expansion.
North America leads the market due to advanced manufacturing and strong automation adoption. Europe follows with high demand from automotive and industrial engineering sectors. Germany plays a key role due to precision engineering strengths. Asia Pacific is the fastest emerging region, driven by rapid industrial growth. China, Japan, and South Korea expand usage across electronics and automotive manufacturing. India shows rising adoption due to factory modernization. Latin America and the Middle East remain emerging markets. Infrastructure upgrades support gradual regional market penetration.
Market Insights:
- The market reached USD 4,824.70 million in 2024 and is projected to reach USD 7,517.40 million by 2032, growing at a CAGR of 5.7% during the forecast period.
- North America leads with about 35% share due to advanced manufacturing and automation adoption, followed by Europe at nearly 30% driven by automotive and precision engineering, while Asia Pacific holds around 25% supported by electronics and industrial expansion.
- Asia Pacific is the fastest-growing region with about 25% share, supported by rapid industrialization, factory modernization, and strong electronics and automotive manufacturing growth in China, Japan, and South Korea.
- By type, 3D optical measuring systems account for nearly 60% of the market due to demand for complex geometry inspection, while 2D systems hold around 40% supported by cost-sensitive applications.
- By component, hardware dominates with about 55% share due to high-value sensors and optics, while software and services together account for nearly 45% driven by analytics, calibration, and system support needs.
Market Drivers:
Rising Demand For High-Precision And Non-Contact Measurement Solutions
The Optical measuring systems market benefits from rising precision requirements across manufacturing sectors. Automotive producers require accurate dimensional checks for complex parts. Aerospace firms depend on optical systems for tight tolerance control. Electronics manufacturing needs micro-level measurement accuracy. Non-contact methods prevent surface damage during inspection. These systems reduce manual inspection dependency. Faster inspection cycles improve production throughput. Quality assurance teams rely on optical data consistency. Industrial digitization strengthens long-term system adoption.
- For instance, Carl Zeiss Industrial Metrology confirms its ATOS Q optical scanners achieve measurement accuracy down to 2 microns, supporting complex automotive body and powertrain inspections.
Expansion Of Automation And Smart Manufacturing Practices Across Industries
Automation adoption drives steady demand for optical measurement tools. Smart factories rely on real-time dimensional feedback. The Optical measuring systems market supports automated inspection workflows. Integrated systems improve process control accuracy. Robotics adoption increases need for inline measurement. Optical tools align with closed-loop manufacturing setups. Reduced human intervention improves repeatability. Production lines gain higher operational efficiency. Manufacturers invest to maintain competitive output quality.
- For instance, KEYENCE reports its LJ-X8000 Series laser profilers capture 3,200 points per profile at scanning speeds of up to 16 kHz, enabling continuous inline measurement
Growing Quality Compliance And Regulatory Standards In Industrial Production
Stricter quality standards increase inspection system adoption. Manufacturers must meet global compliance benchmarks. Optical systems provide traceable measurement records. Aerospace and medical sectors face strong audit requirements. The Optical measuring systems market supports certification needs. Automated reporting simplifies compliance documentation. Inspection accuracy reduces rejection rates. Manufacturers aim to avoid costly recalls. Compliance pressure sustains system investment levels.
Technological Advancements In Sensors Software And Measurement Algorithms
Sensor innovation improves resolution and accuracy. Advanced optics enable faster data capture. Software upgrades enhance measurement reliability. The Optical measuring systems market benefits from algorithm improvements. AI-based analytics improve defect detection. User interfaces become more intuitive for operators. Integration with factory software simplifies deployment. Hardware miniaturization expands application scope. Continuous innovation sustains market momentum.
Market Trends:
Integration Of Artificial Intelligence For Advanced Measurement Interpretation
AI adoption reshapes measurement analysis methods. Systems now detect patterns beyond manual capability. The Optical measuring systems market adopts predictive quality analysis. Machine learning improves anomaly detection accuracy. Automated decision support reduces inspection delays. AI tools support adaptive measurement settings. Production teams gain deeper process insights. Data-driven insights improve yield management. This trend reshapes inspection intelligence.
- For instance, Hexagon AB states its Manufacturing Intelligence software applies AI algorithms to analyze millions of inspection points per scan for predictive quality control.
Shift Toward Inline And Real-Time Measurement Deployment Models
Manufacturers prefer inline inspection over offline methods. Real-time feedback reduces defect propagation. The Optical measuring systems market supports continuous monitoring. Inline systems reduce production downtime. Measurement at source improves correction speed. Automated alerts enhance process stability. Inline deployment supports lean manufacturing goals. Space-efficient designs ease installation. Demand for real-time inspection keeps rising.
- For instance, Cognex confirms its In-Sight vision systems perform inspections in milliseconds per part, supporting high-speed electronics and packaging lines.
Rising Use Of Multi-Sensor And Hybrid Optical Measurement Platforms
Hybrid systems combine optical and tactile methods. Multi-sensor setups improve measurement flexibility. The Optical measuring systems market adapts to complex geometries. Manufacturers reduce reliance on multiple standalone tools. Unified platforms save operational space. Combined data improves inspection accuracy. Hybrid solutions address varied surface types. Industries value versatile measurement platforms. This trend broadens application reach.
Growing Adoption Of Portable And Flexible Measurement Systems
Portability gains importance in industrial inspection. Mobile systems support large component measurement. The Optical measuring systems market addresses on-site inspection needs. Flexible systems reduce part transport requirements. Lightweight designs improve operator convenience. Battery-powered units enhance mobility. Field inspection becomes more efficient. Maintenance teams benefit from rapid deployment. Portability supports decentralized production models.
Market Challenges Analysis:
High Initial Investment And Complex System Integration Requirements
High system costs limit adoption among small manufacturers. Advanced optics increase capital expenditure levels. The Optical measuring systems market faces budget sensitivity. Integration with legacy systems creates deployment challenges. Skilled technicians are required for setup. Software customization adds implementation time. Training needs increase operational complexity. Smaller firms delay investment decisions. Cost barriers restrict market penetration.
Environmental Sensitivity And Performance Limitations In Harsh Conditions
Optical systems face sensitivity to dust and vibration. Factory floor conditions affect measurement accuracy. The Optical measuring systems market addresses calibration challenges. Temperature variation impacts optical stability. Shielding requirements increase installation complexity. Maintenance needs rise in harsh environments. System downtime affects production flow. Operators require controlled conditions for accuracy. Environmental limits constrain broader deployment.
Market Opportunities:
Expansion Of Industrialization And Manufacturing Capacity In Emerging Economies
Emerging economies invest in advanced manufacturing tools. The Optical measuring systems market gains new demand. Factory modernization programs support system adoption. Automotive and electronics sectors expand capacity. Quality improvement goals drive inspection upgrades. Government initiatives support technology investment. Local manufacturers seek global quality standards. Automation readiness increases optical system use. Emerging regions offer strong growth potential.
Increasing Demand From New Application Areas And Industry Verticals
New sectors adopt optical measurement technologies. Medical device production requires high accuracy inspection. The Optical measuring systems market expands into energy applications. Additive manufacturing needs precise dimensional validation. Composite material inspection gains importance. Semiconductor fabrication increases measurement demand. Research institutions adopt advanced systems. Diverse applications widen revenue opportunities. Market scope continues to broaden.
Market Segmentation Analysis:
By Type
2D optical measuring systems support basic dimensional inspection and surface analysis tasks. These systems suit applications that require speed and cost control. 3D optical measuring systems enable complex geometry capture and full volumetric inspection. Industries adopt 3D systems for high-precision and tolerance-critical components. Demand for 3D solutions grows faster due to advanced manufacturing needs. The Optical measuring systems market reflects a steady shift toward three-dimensional inspection. It benefits from accuracy, flexibility, and reduced inspection cycles.
- For instance, GOM reports its ATOS 3D scanners capture up to 12 million measurement points per scan for aerospace and automotive structures.
By Component
Hardware forms the core segment due to cameras, sensors, and optical assemblies. Manufacturers invest in robust hardware to ensure measurement stability. Software plays a vital role in data processing and visualization. Advanced software improves accuracy and workflow efficiency. Services include calibration, maintenance, and training support. This segment ensures system reliability over long operational periods. Service demand rises with complex system deployment.
- For instance, FARO Technologies states its laser scanners collect billions of data points per project, with calibration services traceable to ISO standards for long-term accuracy.
By Application / Industry
Electronics leads adoption due to micro-level inspection needs. Automotive relies on optical systems for part validation and assembly checks. Aerospace uses these systems for strict tolerance and safety compliance. Medical and healthcare adopt optical measurement for device accuracy. Each sector values non-contact inspection benefits. Automation integration supports cross-industry usage.
Segmentation:
By Type- 2D Optical Measuring
- 3D Optical Measuring
- Hardware
- Software
- Services
- Electronics
- Automotive
- Aerospace
- Medical / Healthcare
- North America
- U.S.
- Canada
- Mexico
- Europe
- Germany
- France
- U.K.
- Italy
- Spain
- Rest of Europe
- Asia Pacific
- China
- Japan
- India
- South Korea
- South-east Asia
- Rest of Asia Pacific
- Latin America
- Brazil
- Argentina
- Rest of Latin America
- Middle East & Africa
- GCC Countries
- South Africa
- Rest of the Middle East and Africa
Regional Analysis:
North America
North America holds the largest share of the Optical measuring systems market, accounting for about 35% of global revenue. The region benefits from advanced manufacturing infrastructure and early technology adoption. Automotive and aerospace industries drive strong demand for high-precision inspection systems. Electronics manufacturing also supports steady system deployment. The United States leads regional adoption due to strong automation investment. It benefits from skilled labor and mature quality standards. Continuous upgrades in smart factories sustain market leadership.
Europe
Europe represents nearly 30% of the global market share. Germany, France, and the United Kingdom drive regional demand. Automotive engineering and industrial machinery sectors rely on optical measurement for precision control. Aerospace manufacturing supports consistent system usage. Strict quality regulations increase inspection requirements. It gains strength from advanced metrology expertise. High focus on accuracy sustains long-term regional demand.
Asia Pacific, Middle East & Africa, and Latin America
Asia Pacific accounts for around 25% of the global market and shows the fastest growth. China, Japan, and South Korea expand usage across electronics and automotive production. India supports growth through factory modernization initiatives. Middle East & Africa hold about 5% share, driven by industrial diversification. Latin America also accounts for nearly 5%, led by Brazil and Mexico. It benefits from gradual automation adoption across manufacturing sectors. Emerging regions offer long-term expansion potential.
Key Player Analysis:
- Nikon Metrology
- Hexagon Manufacturing Intelligence
- Carl Zeiss
- Mitutoyo Corporation
- FARO Technologies
Competitive Analysis:
The Optical measuring systems market shows moderate consolidation with strong global players. Leading companies focus on precision, automation compatibility, and software strength. Competition centers on accuracy, speed, and system integration depth. Firms invest in R&D to enhance sensor resolution and analytics. It benefits from long-term contracts with automotive and aerospace clients. Strategic partnerships help expand regional reach. Product differentiation relies on multi-sensor platforms and usability. Smaller players compete through niche applications and cost-focused offerings.
Recent Developments:
- In June 2025, Hexagon Manufacturing Intelligence released ESPRIT EDGE 2025, a major update to its computer-aided manufacturing (CAM) software that introduces AI-driven automation tools to address skills gaps in high-precision manufacturing. This release features "Hexagon Copilot," an AI virtual assistant, and "ProPlanAI" for optimizing process planning, specifically enhancing support for complex Swiss machining applications. Earlier, in October 2024, Hexagon entered into a strategic partnership with Exact Metrology, appointing them as a primary reseller in the Midwest United States to distribute Hexagon’s coordinate metrology solutions, including portable laser trackers and measuring arms.
- In May 2025, Carl Zeiss Industrial Quality Solutions launched its 2025 Quality Software Release, which introduced significant updates to its flagship platforms including ZEISS CALYPSO 2025, ZEISS PiWeb, and the newly integrated ZEISS CONNECTED QUALITY hub. These enhancements focused on improving CMM measurement precision with advanced GD&T functions and "SoftTouch Mode" for faster sensor performance, while also facilitating better global data connectivity and team collaboration. Furthermore, in March 2025, during its "Live Tech Reveal," Zeiss unveiled several optical innovations, including the ZEISS ScanBox 4 Series for automated optical 3D inspection and the ZEISS O-INSPECT Duo, a hybrid system combining optical and tactile measurement capabilities in a single device.
- In January 2025, FARO Technologies launched the FARO Leap ST, a new handheld 3D scanning solution designed to expand their portable metrology portfolio for the manufacturing sector. This device features five distinct operating modes-including ultra-fast scanning, hyperfine scanning, and deep hole scanning-and seamlessly integrates with the updated FARO CAM2 software to provide a unified platform for capturing and analyzing metrology-grade data. Additionally, in late 2025, FARO continued to expand its hardware lineup with the release of the Quantum X FaroArm Series, the latest iteration of its portable coordinate measuring machines designed for high-accuracy inspection and probing applications.
Report Coverage:
The research report offers an in-depth analysis based on type, component, application, and region segments. It details leading market players, providing an overview of their business, product offerings, investments, revenue streams, and key applications. Additionally, the report includes insights into the competitive environment, SWOT analysis, current market trends, as well as the primary drivers and constraints. Furthermore, it discusses various factors that have driven market expansion in recent years. The report also explores market dynamics, regulatory scenarios, and technological advancements that are shaping the industry. It assesses the impact of external factors and global economic changes on market growth. Lastly, it provides strategic recommendations for new entrants and established companies to navigate the complexities of the market.
Future Outlook:
- Automation adoption will continue to increase demand for inline optical inspection systems across manufacturing facilities.
- Artificial intelligence integration will enhance defect detection accuracy and measurement reliability.
- Smart factory expansion will support wider deployment of real-time optical measurement solutions.
- Electronics manufacturing will remain a major source of demand due to miniaturization requirements.
- Aerospace quality standards will sustain long-term demand for high-precision inspection systems.
- Portable optical measuring systems will gain wider acceptance for on-site and large-part inspection.
- Software-driven measurement platforms will strengthen recurring revenue opportunities for suppliers.
- Emerging economies will expand adoption through industrial modernization and automation initiatives.
- Integration with digital twins will improve process optimization and quality control.
- Customized optical solutions will grow in importance for specialized industrial applications.
Request a Free Sample
Fill in your details and we'll send you a free sample report.
- Sample data tables & charts
- Research methodology
Need a Custom Version of This Report?
Tailor the scope, geography, or segments to your exact requirements.
- Custom geography or segment scope
- Direct access to our analyst team
Frequently Asked Questions
What is the current market size for Optical measuring systems market, and what is its projected size in 2032?
At what Compound Annual Growth Rate is the Optical measuring systems market projected to grow between 2025 and 2032?
Which Optical measuring systems market segment held the largest share in 2024?
What are the primary factors fueling the growth of the Optical measuring systems market?
Who are the leading companies in the Optical measuring systems market?
Which region commanded the largest share of the Optical measuring systems market in 2024?
Table of Content
Chapter 1. Report Introduction
- 1.1 Report Description & Purpose
- 1.1.1 Report Title & Market Definition
- 1.1.2 Unique Selling Propositions (USP) & Key Differentiators
- 1.1.3 Value Proposition for Stakeholders
- 1.2 Research Objectives
- 1.2.1 Market Sizing Objectives (Volume & Revenue)
- 1.2.2 Segmentation Objectives
- 1.2.3 Competitive Intelligence Objectives
- 1.2.4 Forecast & Scenario Objectives
- 1.3 Report Scope
- 1.3.1 Optical Measuring Systems Scope – Types & Subtypes Covered
- 1.3.2 Geographic Scope – Regions & Countries Covered
- 1.3.3 Historical Period, Base Year & Forecast Period (2024; forecast to the forecast period)
- 1.3.4 Inclusions & Exclusions
- 1.4 HS Code & Classification Framework
- 1.5 Currency, Units & Pricing Basis
- 1.6 Target Stakeholders
- 1.7 Limitations & Assumptions
Chapter 2. Executive Summary
- 2.1 Global Optical Measuring Systems Market Snapshot
- 2.1.1 Market Size – Historical (2024) & Forecast (the forecast period) (2024: USD 4,824.70 million → forecast year: USD 7,517.40 million)
- 2.1.2 Volume & Revenue – Global Totals
- 2.1.3 Key Market Highlights – Top Five Facts
- 2.2 Optical Measuring Systems Market Segmentation Snapshot
- 2.2.1 Market Split by Region – 2024 vs.
- 2.3 Competitive Snapshot
- 2.3.1 Top 10 Players by Revenue Share – 2024
- 2.3.2 Top 10 Players by Volume Share – 2024
- 2.3.3 Recent Strategic Developments (18-Month Summary)
- 2.4 Key Investment Highlights & Strategic Conclusions
Chapter 3. Optical Measuring Systems Market Dynamics & Industry Analysis
- 3.1 Market Overview & Context
- 3.1.1 Optical Measuring Systems Market Position in the Broader Automotive Value Chain
- 3.1.2 OEM vs. Replacement Market Dynamics
- 3.1.3 Market Maturity & Development Stage by Region
- 3.2 Optical Measuring Systems Market Drivers
- 3.3 Optical Measuring Systems Market Restraints & Challenges
- 3.4 Optical Measuring Systems Market Opportunities
- 3.5 Porter's Five Forces Analysis
- 3.5.1 Threat of New Entrants
- 3.5.2 Bargaining Power of Suppliers
- 3.5.3 Bargaining Power of Buyers
- 3.5.4 Threat of Substitutes
- 3.5.5 Competitive Rivalry – Intensity Assessment
- 3.6 Optical Measuring Systems Value Chain Analysis
- 3.6.1 Upstream – Raw Material/Input Suppliers
- 3.6.1.1 Raw Material/Input 1
- 3.6.1.2 Raw Material/Input 2
- 3.6.1.3 Raw Material/Input 3
- 3.6.2 Midstream – Production/Manufacturing/Service Delivery
- 3.6.2.1 Production/Process Overview
- 3.6.2.2 Key Facility Locations & Capacity by Manufacturer
- 3.6.3 Downstream – Distribution & End Consumer
- 3.6.3.1 Primary Channel – B2B/OEM
- 3.6.3.2 Secondary Channels – Dealer, Retail, Online, Direct
- 3.6.4 Value Chain Profitability Analysis
- 3.6.1 Upstream – Raw Material/Input Suppliers
- 3.7 PESTEL Analysis
- 3.7.1 Political Factors
- 3.7.2 Economic Factors
- 3.7.3 Social Factors
- 3.7.4 Technological Factors
- 3.7.5 Environmental Factors
- 3.7.6 Legal Factors
- 3.8 Optical Measuring Systems Supply Chain Analysis
- 3.8.1 Raw Material/Input Supply Risk Assessment
- 3.8.2 Manufacturing Concentration Risk (Geographic Exposure)
- 3.8.3 Trade Disruption Impact Analysis
- 3.9 Regulatory & Policy Landscape
Note: The regulatory and policy landscape section covers regulations based on their applicability to the market, Optical Measuring Systems category, geography, and scope of the study. Only regulatory frameworks with a material impact on operations, compliance, trade, sustainability, or market access are analyzed in detail.
Chapter 4. Key Investment Pockets & Opportunity Analysis
- 4.1 Optical Measuring Systems Market Attractiveness Analysis
- 4.1.1 By Region – Investment Attractiveness Matrix (Volume × CAGR)
- 4.2 Absolute Revenue Growth Opportunity
- 4.2.1 By Region – Absolute USD Growth Through the forecast period
- 4.3 Incremental Volume Opportunity
- 4.3.1 By Region – Incremental Volume Through the forecast period
- 4.3.2 Segment – Incremental Volume
- 4.4 Emerging Submarket Opportunity Deep Dive (Subject to Applicability)
- 4.5 Emerging Market Opportunity Scorecards
- 4.5.1 United States
- 4.5.2 Europe
- 4.5.3 Asia
- 4.5.4 Middle East & Africa
Note: Emerging Market Opportunity Scorecards will be included based on relevance and strategic importance. Regions listed are indicative and may vary depending on data availability and market dynamics.
Chapter 5. Optical Measuring Systems Import-Export Analysis & Trade Flows
- 5.1 Global Trade Overview
- 5.1.1 Global Export Value by Country (2024)
- 5.1.2 Global Export Volume by Country (2024)
- 5.1.3 Global Import Value by Country (2024)
- 5.1.4 Global Import Volume by Country (2024)
- 5.1.5 Net Trade Balance by Country (2024)
- 5.2 Export Analysis – Segment
- 5.2.1 Type 1 (HS Code)
- 5.2.2 Type 2 (HS Code)
- 5.2.3 Type 3 (HS Code)
- 5.2.4 Type 4 (HS Code)
- 5.2.5 Type 5 (HS Code)
- 5.3 Import Analysis – Segment
- 5.3.1 Type 1 (HS Code)
- 5.3.2 Type 2 (HS Code)
- 5.3.3 Type 3 (HS Code)
- 5.3.4 Type 4 (HS Code)
- 5.3.5 Type 5 (HS Code)
- 5.4 Average Unit Trade Prices
- 5.4.1 Average Export Price – Segment & Country
- 5.4.2 Average Import Price – Segment & Source Country
- 5.4.3 Price Trends (2024)
- 5.5 Key Trade Route Analysis
- 5.5.1 Trade Route 1
- 5.5.2 Trade Route 2
- 5.5.3 Trade Route 3
- 5.5.4 Trade Route 4
- 5.5.5 Trade Route 5
- 5.6 Trade Policy Impact Assessment
- 5.6.1 US Anti-Dumping & Section 301 Tariffs
- 5.6.2 EU Customs Union Impact
- 5.6.3 Major Free Trade Agreements
- 5.6.4 USMCA Rules of Origin
Note: Trade policy analysis will be included only where relevant to the Optical Measuring Systems market.
Chapter 6. Competitive Landscape & Company Benchmarking
- 6.1 Optical Measuring Systems Market Concentration & Structure
- 6.1.1 Herfindahl-Hirschman Index (HHI) – vs. 2024
- 6.1.2 Tier 1, Tier 2 & Tier 3 Market Structure
- 6.1.3 Global, Regional & Local Player Dynamics
- 6.2 Optical Measuring Systems Market Share Analysis – 2024
- 6.2.1 Global Revenue Share by Company
- 6.2.2 Global Volume Share by Company
- 6.2.3 Regional Revenue Share
- 6.2.4 Market Share Evolution ( vs. 2024)
- 6.2.5 OEM Segment Share by Company
- 6.2.6 Replacement Segment Share by Company
- 6.3 Production/Delivery Capacity & Facility Analysis
- 6.3.1 Global Installed Capacity
- 6.3.2 Capacity Utilization Rates
- 6.3.3 Production/Output Volume
- 6.3.4 Facility Locations & Capacity Map
- 6.3.5 Planned Capacity Additions
- 6.4 Optical Measuring Systems Competitive Benchmarking Matrix
- 6.4.1 Revenue, Volume, CAGR & Profitability Comparison
- 6.4.2 Channel Revenue Mix
- 6.4.3 Geographic Revenue Exposure
- 6.4.4 R&D Intensity
- 6.4.5 Sustainability Maturity
- 6.5 Strategic Developments in Optical Measuring Systems (Last 24 Months)
- 6.5.1 Mergers, Acquisitions & Divestments
- 6.5.2 New Optical Measuring Systems Launches
- 6.5.3 Facility Expansions
- 6.5.4 Strategic Alliances, Joint Ventures & Partnerships
- 6.5.5 Distribution Expansion & Market Entry
- 6.5.6 Sustainability & ESG Initiatives
- 6.6 Competitive Strategy Mapping
- 6.6.1 Leader, Challenger, Follower & Niche Classification
- 6.6.2 Pricing Strategy Comparison
- 6.6.3 Channel Strategy Matrix
Note: Strategic developments are included based on their materiality and the availability of reliable information.
Chapter 7. Global Optical Measuring Systems Market – By Distribution Channel
- 7.1 Segment Overview
- 7.1.1 Volume & Revenue Split by Channel (2024 & )
- 7.1.2 Channel Mix Evolution (the forecast period)
Chapter 8. Regional Market Analysis – Global Overview
- 8.1 Global Regional Overview
- 8.1.1 Regional Volume Share
- 8.1.2 Regional Revenue Share
- 8.1.3 Regional Volume by Region
- 8.1.4 Regional Revenue by Region
- 8.1.5 Regional Forecast Through the forecast period
- 8.2 Cross-Regional Segment Analysis
- 8.2.1 By Distribution Channel
- 8.2.2 By Brand/Price Tier
Chapter 9. North America Optical Measuring Systems Market
- 9.1 United States
- 9.2 Canada
- 9.3 Mexico
Chapter 10. Europe Optical Measuring Systems Market
- 10.1 Germany
- 10.2 France
- 10.3 Italy
- 10.4 United Kingdom
- 10.5 Spain
- 10.6 Poland
- 10.7 Russia
- 10.8 Netherlands
- 10.9 Belgium
- 10.10 Sweden
- 10.11 Denmark
- 10.12 Norway
- 10.13 Rest of Europe
Chapter 11. Asia Pacific Optical Measuring Systems Market
- 11.1 China
- 11.2 India
- 11.3 Japan
- 11.4 South Korea
- 11.5 Thailand
- 11.6 Indonesia
- 11.7 Vietnam
- 11.8 Malaysia
- 11.9 Australia
- 11.10 Rest of Asia Pacific
Chapter 12. Latin America Optical Measuring Systems Market
- 12.1 Brazil
- 12.2 Argentina
- 12.3 Colombia
- 12.4 Chile
- 12.5 Rest of Latin America
Chapter 13. Middle East Optical Measuring Systems Market
- 13.1 Saudi Arabia
- 13.2 United Arab Emirates
- 13.3 Turkey
- 13.4 Israel
- 13.5 Iran
- 13.6 Rest of the Middle East
Chapter 14. Africa Optical Measuring Systems Market
- 14.1 South Africa
- 14.2 Egypt
- 14.3 Nigeria
- 14.4 Morocco
- 14.5 Rest of Africa
Chapter 15. Optical Measuring Systems Company Profiles
- 15.1 [Company 01]
- 15.1.1 Company Overview
- 15.1.2 Key Management Personnel
- 15.1.3 Products & Services Portfolio
- 15.1.4 Financial Performance
- 15.1.5 Key Market Focus & Geographic Presence
- 15.1.6 Recent Developments & Strategic Initiatives
Note: The company profile list is preliminary and may change based on research findings, market developments, data availability, and client requirements.
Chapter 16. Appendices
- Appendix A – List of Abbreviations & Acronyms
- Appendix B – Industry Classification Code Reference – Full Series
- Appendix C – Production & Capacity Data Tables
- Appendix D – End-Use & Demand Base Tables
- Appendix E – Consumption & Replacement Rate Assumptions
- Appendix F – ASP Reference Tables
- Appendix G – Manufacturing & Facility Database
- Appendix H – Import-Export Data Tables
- Appendix I – Regulatory Summary Tables
- Appendix J – Primary Research Participant List (Anonymized)
- Appendix K – Primary Research Questionnaire Framework
- Appendix L – Data Sources & Bibliography
- Appendix M – Market Size Divergence & Source Comparison
Chapter 17. Research Methodology
- 17.1 Research Framework & Philosophy
- 17.2 Secondary Research – Sources, Hierarchy & Data Extraction
- 17.3 Data Modeling – Bottom-Up & Top-Down Market Sizing
- 17.4 Primary Research – Stakeholder Framework, LOI & Sample Sizes
- 17.5 Forecast Methodology – Regression, Scenario & Sensitivity Analysis
- 17.6 Quality Control – Four-Layer Validation Framework
- 17.7 Limitations & Standard Assumptions
- 17.8 Disclaimer
