Market Overview
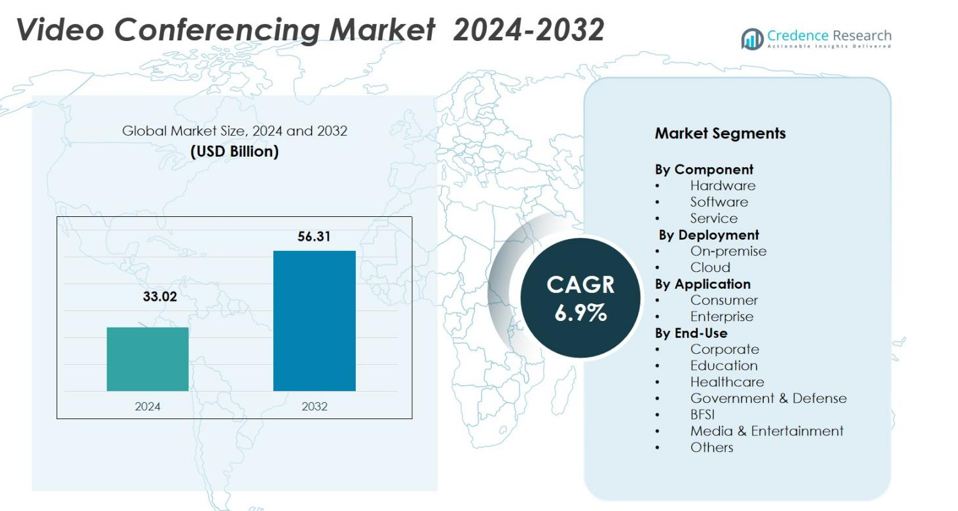
The Video Conferencing Market was valued at USD 33.02 billion in 2024 and is anticipated to reach USD 56.31 billion by 2032, at a CAGR of 6.9% during the forecast period.
| REPORT ATTRIBUTE |
DETAILS |
| Historical Period |
2020-2023 |
| Base Year |
2024 |
| Forecast Period |
2025-2032 |
| Video Conferencing Market Size 2024 |
USD 33.02 billion |
| Video Conferencing Market, CAGR |
6.9% |
| Video Conferencing Market Size 2032 |
USD 56.31 billion |
The Video Conferencing Market features strong participation from leading players such as Zoom Video Communications, Microsoft, Cisco Systems, Google, and RingCentral, who together shape product innovation, feature breadth, and market penetration. Zoom commands roughly 55.9% of the global share, while Microsoft holds around 32.3%. The market’s leading region is North America, which captured 38.9% of the global video conferencing market in 2024. Strong technology adoption, widespread hybrid work practices, and high-speed internet penetration drive this dominance.
Market Insights
- The global Video Conferencing Market size was valued at USD 33.02 billion in 2024 and is projected to reach USD 56.31 billion by 2032, growing at a CAGR of 6.9% during the forecast period.
- Rising adoption of remote and hybrid work models is significantly driving the demand for video conferencing solutions, as businesses seek reliable and scalable communication tools.
- Key trends include the integration of AI and machine learning to enhance video quality and meeting productivity, along with a shift towards cloud-based solutions for scalability and cost-effectiveness.
- The market is highly competitive, with major players like Zoom Video Communications, Microsoft, and Cisco Systems leading the space by offering advanced features and cloud-based platforms.
- North America holds the largest market share at 38.9%, with strong growth seen in regions like Asia-Pacific, driven by rising internet penetration and increasing demand from SMEs and educational institutions.
Access crucial information at unmatched prices!
Request your sample report today & start making informed decisions powered by Credence Research Inc.!
Download Sample
Market Segmentation Analysis
By Component
The Hardware sub‑segment dominates the video conferencing market, accounting for 46% of the total market share in 2024. This dominance is driven by the increasing adoption of hybrid and remote work models, which require reliable video conferencing equipment such as cameras, microphones, collaboration bars, and codec systems. The demand for high-quality hardware, including features like 4K video, AI-powered noise cancellation, and intelligent framing, further boosts investments from enterprises in dedicated video conferencing setups.
- For instance, Logitech’s Rally Bar offers “AI video intelligence, advanced sound pickup and noise suppression” to ensure that remote participants are seen and heard clearly.
By Deployment
The On-premise deployment model remains dominant, holding 58% of the market share in 2024, particularly among large enterprises and industries with strict data security and regulatory requirements. Businesses prefer greater control over data and infrastructure for mission-critical operations. However, Cloud-based deployment is quickly gaining ground as the fastest-growing sub-segment, capturing 42% of the market in 2024. The shift to cloud solutions is driven by their scalability, flexibility, and cost-effectiveness, particularly among small to medium-sized enterprises (SMEs) and globally distributed organizations.
- For instance, Google Workspace expanded its global cloud region footprint to support enterprises shifting video collaboration workloads to the cloud, enabling lower latency and meeting data residency requirements across regions such as the EU and Asia-Pacific.
By Application
In 2024, the Enterprise application sub-segment captured the largest market share of 69%, driven by increasing demand for video conferencing solutions that support remote collaboration, global team coordination, and hybrid work models. Enterprises are investing in comprehensive systems that integrate hardware, software, and services to enhance productivity and reduce operational costs. Although smaller in share, the Consumer segment, with 31% of the market, is expected to grow rapidly, as demand for affordable and accessible video conferencing solutions for personal use, remote learning, and social connections continues to rise.
Key Growth Drivers
Rising Adoption of Remote and Hybrid Work Models
The surge in remote and hybrid work models has significantly accelerated the demand for video conferencing solutions. Organizations across industries are increasingly adopting flexible work environments, necessitating robust communication systems that facilitate seamless collaboration between remote teams and in-office employees. Video conferencing platforms offer essential tools for virtual meetings, reducing the need for travel and supporting increased productivity. This shift towards remote work is expected to remain a major growth driver in the video conferencing market, with companies continually investing in advanced, scalable solutions to enhance their workforce connectivity.
- For instance, Microsoft reported that over 320 million people use Teams monthly in 2024, driven by hybrid work adoption and the use of features like intelligent meeting recap and cross-device collaboration.
Technological Advancements in Video Conferencing Tools
Advancements in video conferencing technologies, such as AI-driven features, enhanced video quality, and real-time collaboration tools, are propelling market growth. Integration of machine learning, real-time language translation, automated meeting scheduling, and smart video optimization are transforming video conferencing into a more efficient and user-friendly experience. These innovations not only improve the functionality of video conferencing platforms but also make them more accessible to users across diverse industries, ranging from healthcare to education, thereby increasing the adoption rate across both enterprise and consumer segments.
- For instance, Google Meet upgraded its video engine with adaptive video resolution and on-device noise cancellation, improving performance in low-bandwidth environments and enhancing accessibility for education and remote healthcare users.
Cost Efficiency and Operational Benefits
Cost-saving benefits associated with video conferencing are driving its widespread adoption, particularly among businesses looking to optimize their operations. By reducing travel expenses, minimizing physical office space requirements, and enabling real-time global collaboration, companies are recognizing the financial advantages of investing in video conferencing solutions. Video conferencing tools also help streamline decision-making, enhance communication, and improve employee engagement, contributing to higher operational efficiency. These cost-effective benefits make video conferencing an essential tool for businesses aiming to improve profitability while maintaining a competitive edge in their respective industries.
Key Trends & Opportunities
Integration of Cloud-Based Solutions
The transition towards cloud-based video conferencing solutions is a significant trend reshaping the market. Cloud technology provides scalability, cost-effectiveness, and flexibility, making it easier for businesses to implement and manage their video conferencing needs. The ability to access meetings from anywhere, coupled with cloud storage options, has made cloud video conferencing platforms attractive for businesses with remote or global teams. As cloud adoption continues to rise, this trend presents a substantial opportunity for vendors to expand their services and offer more customizable solutions to meet diverse customer demands.
- For instance, in 2024, Zoom expanded its Zoom Cloud Infrastructure, allowing organizations to store meeting recordings and transcripts in region-specific data centers to meet data residency requirements.
Expansion of Video Conferencing in Healthcare and Education
The healthcare and education sectors represent major opportunities for growth in the video conferencing market. In healthcare, telemedicine services rely heavily on video conferencing to provide remote consultations and enhance patient care. Similarly, educational institutions are adopting video conferencing for virtual classrooms, online courses, and distance learning programs, especially in the wake of the COVID-19 pandemic. These sectors are expected to continue investing in video conferencing solutions, creating substantial opportunities for technology providers to tailor their products to meet specific industry needs, particularly for secure, high-quality video communication.
- For instance, Epic Systems expanded its telehealth integration in 2024, enabling hospitals to conduct HIPAA-compliant video visits directly through MyChart, supporting millions of remote clinical consultations.
Key Challenges
Security and Privacy Concerns
Security and privacy concerns remain one of the significant challenges in the video conferencing market. As video conferencing tools become more widely adopted across industries, the risks associated with unauthorized access, data breaches, and cyber-attacks increase. Organizations must implement robust security measures, such as end-to-end encryption, secure authentication protocols, and data protection regulations, to safeguard sensitive information shared during virtual meetings. Without addressing these security issues, user trust in video conferencing platforms may be undermined, limiting their widespread adoption.
Technical Difficulties and Compatibility Issues
While video conferencing tools have advanced, technical difficulties, including connectivity issues, poor audio/video quality, and software compatibility challenges, still present barriers to seamless communication. Different network conditions, inadequate hardware, and the need for software updates can disrupt meetings and hinder the user experience. As video conferencing solutions become more integrated into various business operations, ensuring consistent, high-quality performance across diverse environments remains a critical challenge. Vendors must continue improving their platforms to minimize these issues and enhance the overall reliability of video conferencing tools.
Regional Analysis
North America
North America holds the largest share in the video conferencing market, accounting for 35% of the total market in 2024. The demand for video conferencing solutions is driven by the widespread adoption of remote and hybrid work models, particularly in the United States and Canada. The region is home to several leading technology companies, which continue to innovate and offer advanced video conferencing tools for various industries such as education, healthcare, and corporate enterprises. Additionally, the strong infrastructure, high internet penetration, and focus on digital transformation further propel the growth of video conferencing solutions in North America.
Europe
Europe accounts for 28% of the global video conferencing market share in 2024, with the demand driven by both enterprise and government sectors seeking cost-effective and efficient communication solutions. Countries such as the United Kingdom, Germany, and France lead the market, where hybrid working and the need for seamless collaboration tools have significantly increased. Europe is also a major hub for digital innovation, with companies in the region integrating advanced technologies like AI and machine learning into video conferencing tools to enhance user experience and productivity, fueling market growth.
Asia-Pacific
Asia-Pacific is a rapidly growing region in the video conferencing market, holding 22% of the total market share in 2024. The region is witnessing significant demand from both emerging and developed economies, including China, India, Japan, and Australia, as businesses and educational institutions shift towards remote and hybrid work models. The rise in mobile and internet penetration, coupled with the increasing adoption of cloud-based video conferencing platforms, supports the expansion of this market. Additionally, the region’s growing technology infrastructure and focus on digitalization further contribute to the market’s growth prospects.
Latin America
Latin America holds 7% of the video conferencing market share in 2024, with significant growth driven by increasing mobile internet usage and the adoption of digital collaboration tools in both private and public sectors. The demand for video conferencing solutions is particularly strong in Brazil, Mexico, and Argentina, where businesses are adopting these tools for cost-effective communication and collaboration. The COVID-19 pandemic accelerated the region’s shift towards remote work, and the trend is expected to continue, fueling further market growth in Latin America as companies look for scalable and flexible video conferencing solutions.
Middle East & Africa
The Middle East and Africa (MEA) region represents 8% of the video conferencing market in 2024, with steady growth driven by the region’s expanding digital transformation initiatives and infrastructure development. Countries such as the UAE, Saudi Arabia, and South Africa are increasingly adopting video conferencing solutions for business meetings, education, and government services. The increasing emphasis on connectivity, mobile internet access, and remote working is driving the demand for video conferencing tools. Additionally, the push for smart city projects and digitalization in both public and private sectors contributes to the region’s growing adoption of video conferencing platforms.
Shape Your Report to Specific Countries or Regions & Enjoy 30% Off!
Market Segmentations
By Component
- Hardware
- Software
- Service
By Deployment
By Application
By End-Use
- Corporate
- Education
- Healthcare
- Government & Defense
- BFSI
- Media & Entertainment
- Others
By Geography
- North America
- Europe
- Germany
- France
- U.K.
- Italy
- Spain
- Rest of Europe
- Asia Pacific
- China
- Japan
- India
- South Korea
- South-east Asia
- Rest of Asia Pacific
- Latin America
- Brazil
- Argentina
- Rest of Latin America
- Middle East & Africa
- GCC Countries
- South Africa
- Rest of the Middle East and Africa
Competitive Landscape
The video conferencing market is highly competitive, with key players such as Zoom Video Communications, Microsoft, Cisco Systems, Google, and RingCentral leading the market. These companies dominate by offering comprehensive, feature-rich platforms that cater to a variety of sectors, including corporate enterprises, healthcare, education, and government. The market is characterized by continuous innovation, with major players integrating advanced technologies such as artificial intelligence, machine learning, and cloud computing to enhance video quality, meeting productivity, and user experience. Additionally, these companies are expanding their product offerings to support hybrid and remote work environments, offering solutions that include hardware, software, and services. Strategic partnerships, acquisitions, and mergers are also common as companies aim to broaden their market share and enhance their service capabilities. For instance, Microsoft’s acquisition of Skype and Cisco’s focus on WebEx have solidified their positions in the market. The intense competition is also driven by price sensitivity, making cost-effective solutions critical for attracting a broader customer base.
Key Player Analysis
Recent Developments
- In September 2025, Zoom Communications unveiled AI Companion 3.0, rolling out advanced AI‑powered meeting assistance, cross‑platform note retrieval, real‑time translation, and smarter workflow tools.
- In 2025, Cisco Systems and Zoom announced a strategic partnership enabling native Zoom meetings on Cisco RoomOS devices enhancing interoperability and enterprise video collaboration.
- In July 2025, RingCentral launched its new AI Receptionist for all customers, employing generative‑AI/NLP to handle incoming calls expanding its video and communication services portfolio.
Report Coverage
The research report offers an in-depth analysis based on Component, Deployment, Application and Geography. It details leading market players, providing an overview of their business, product offerings, investments, revenue streams, and key applications. Additionally, the report includes insights into the competitive environment, SWOT analysis, current market trends, as well as the primary drivers and constraints. Furthermore, it discusses various factors that have driven market expansion in recent years. The report also explores market dynamics, regulatory scenarios, and technological advancements that are shaping the industry. It assesses the impact of external factors and global economic changes on market growth. Lastly, it provides strategic recommendations for new entrants and established companies to navigate the complexities of the market.
Future Outlook
- The global video conferencing market is likely to see sustained growth as enterprises and SMEs increasingly adopt hybrid and remote working models, maintaining demand for unified communication tools.
- Cloud‑based solutions will gain more traction as companies prioritize scalability, flexibility, and lower upfront costs, driving faster deployment of video conferencing across distributed teams.
- Integration of artificial intelligence — in features such as noise reduction, automated scheduling, real-time transcription, and smart meeting analytics — will raise user experience and drive adoption across industries.
- Video conferencing adoption in sectors like education, healthcare and telemedicine will expand significantly, as remote learning, virtual consultations, and digital collaboration become more standard globally.
- Emerging markets, especially in Asia‑Pacific, will contribute significantly to growth due to rising internet and broadband penetration, increasing digitalization, and growing SME and startup activity.
- Demand for integrated hardware, software, and managed services packages will increase as organizations seek end-to-end video conferencing solutions that simplify IT management and ensure reliability.
- Small and medium enterprises (SMEs) will drive a growing share of the market, leveraging affordable, cloud‑based video conferencing solutions to support remote teams and reduce operational costs.
- Providers will increasingly offer hybrid deployment models combining cloud and on‑premise solutions to address diverse customer needs around data security, compliance, and flexibility.
- Enhanced focus on security, privacy, and compliance features such as end-to-end encryption, secure authentication, and data residency will become critical as video conferencing usage rises across regulated industries.
- The competitive landscape will intensify, with vendors innovating aggressively and differentiating through advanced features, industry‑specific solutions, and service bundling to capture larger market share and deepen customer engagement.


