Social TV Market By Solution (Social TV Software [Broadcast Integration, Audience Engagement, Content Moderation, Social TV Analytics, Social Networking Platform, Others], Social TV Services [Integration and Consulting, Operation and Installation, Maintenance and Repairing]); By Application (Sports, News, TV Shows, Others) – Growth, Share, Opportunities & Competitive Analysis, 2024 – 2032

Report ID: 10451 | Report Format : Excel, PDF

Market Overview

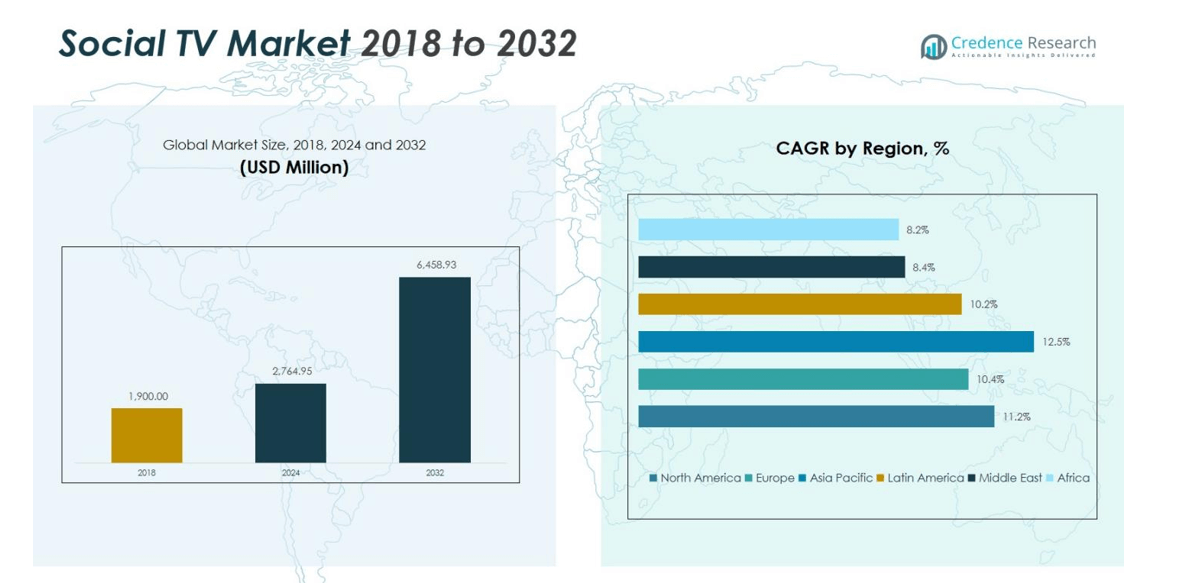
The global Social TV market size was valued at USD 1,900.00 million in 2018 and reached USD 2,764.95 million in 2024. It is anticipated to grow further and reach USD 6,458.93 million by 2032, registering a CAGR of 11.24% during the forecast period.

REPORT ATTRIBUTE DETAILS
Historical Period 2020-2023
Base Year 2024
Forecast Period 2025-2032
Social TV Market Size 2024 USD 2,764.95 million
Social TV Market, CAGR 11.24%
Social TV Market Size 2032 USD 6,458.93million


The global Social TV market is characterized by strong competition among key players such as Talkwalker Inc., Flowics, SentabTV, Telescope Inc., Haier Group, Hitachi Ltd., iPowow Ltd., Sharp Corporation, Snipperwall, and Socialbakers Ltd. These companies focus on enhancing audience engagement, integrating social media analytics, and offering real-time interactive broadcasting solutions. North America leads the global market with a 38% share in 2024, driven by advanced media infrastructure, widespread OTT adoption, and strong investment in AI-powered analytics. Europe and the Asia Pacific regions follow, collectively accounting for over 52% of the global market, supported by rapid digitalization, growing social media penetration, and increased demand for interactive viewing experiences across sports and entertainment sectors.

Social TV Market size

Market Insights

  • The global Social TV market was valued at USD 2,764.95 million in 2024 and is projected to reach USD 6,458.93 million by 2032, growing at a CAGR of 11.24% during the forecast period.
  • Growth is driven by the increasing integration of social media with live television, enabling real-time audience engagement and interactive content experiences.
  • Rising adoption of AI-based analytics and cloud-enabled broadcasting solutions is shaping new trends in audience insights and targeted advertising.
  • The market is moderately fragmented, with key players such as Talkwalker Inc., Flowics, Haier Group, Hitachi Ltd., and Sharp Corporation focusing on technological partnerships and innovation.
  • Regionally, North America holds 38% of the market share, followed by Europe at 24% and Asia Pacific at 28%, while software solutions account for over 65% of total market revenue, reflecting high demand for audience analytics and social engagement tools.

Access crucial information at unmatched prices!

Request your sample report today & start making informed decisions powered by Credence Research Inc.!

Download Sample

Market Segmentation Analysis:

By Solution

The Social TV market by solution is led by the Social TV Software segment, which accounted for 68% of the total market share in 2024. This dominance is attributed to the growing adoption of digital broadcasting tools such as broadcast integration, audience engagement, content moderation, analytics, and social networking platforms. Broadcasters increasingly rely on these tools to merge live television with real-time social media interactions, enhancing viewer participation and advertising potential. Rising demand for AI-driven analytics and cloud-based engagement platforms further strengthens this segment’s growth, making it the core driver of market expansion.

  • For instance, Amagi’s partnership with Tellyo enables broadcasters to instantly clip and share live sports content, enhancing fan engagement through seamless broadcast-social media integration.

By Application

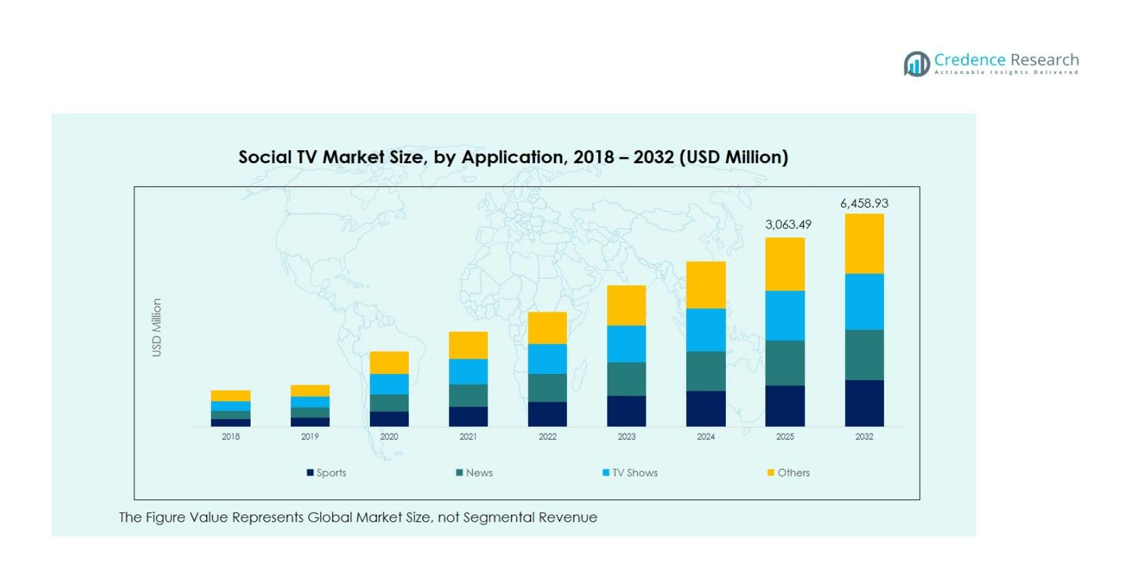
Based on application, the TV Shows segment dominates the market, representing 45% of the global share in 2024, driven by the surge in live entertainment and interactive program formats. Social TV integration enhances audience engagement through live polls, discussions, and gamified participation during popular TV events. The sports segment, holding nearly 30% share, also shows strong growth due to real-time commentary and fan interaction features. Meanwhile, news and other applications continue to gain traction as broadcasters emphasize audience connectivity and instant feedback through integrated social channels.

  • For instance, Innovid partnered with Paramount+ in 2024 to deliver interactive ads during the Super Bowl, enabling viewers to add shows like “Halo” to personalized watchlists through their remote controls.

Key Growth Drivers

Rising Integration of Social Media with Live Broadcasting

The increasing convergence of social media platforms and live television broadcasts is a major growth driver for the Social TV market. Broadcasters are integrating social feeds, real-time polls, and viewer comments to create immersive, interactive experiences. This engagement enhances audience retention and boosts advertising effectiveness. Platforms like Twitter, Instagram, and YouTube are becoming essential tools for broadcasters to promote content and drive real-time participation, leading to higher viewership and stronger brand loyalty across digital and traditional media ecosystems.

  • For instance, YouTube TV has become pivotal for combining live, long-form viewing with digital targeting and engagement, providing broadcasters with a seamless platform to reach and interact with audiences effectively.

Growing Demand for Audience Analytics and Data-Driven Insights

Broadcasters and advertisers are increasingly relying on data analytics to understand viewer behavior and engagement patterns. The use of AI-powered tools allows companies to assess content performance, sentiment, and reach across social platforms. These insights help tailor advertising strategies and optimize content scheduling, driving improved ROI. As personalization becomes critical to audience retention, the demand for social TV analytics is expected to surge, enabling media companies to deliver targeted and measurable viewer experiences in an evolving digital landscape.

  • For instance, the BBC has developed Wing Watch, an interactive wildlife stream that uses machine learning to help viewers navigate live content based on their interests, providing AI-automated jump points for common bird species and enhancing user experience through personalized interactivity.

Expanding Adoption of Connected Devices and OTT Platforms

The widespread adoption of smart TVs, smartphones, and OTT streaming services significantly fuels market growth. Consumers now interact with television content across multiple devices, creating new opportunities for synchronized social engagement. The accessibility of live discussions, interactive features, and shared viewing experiences through connected devices drives participation and content virality. As cord-cutting trends continue and digital ecosystems expand, broadcasters are investing in multi-platform integration to capture larger audiences and strengthen user engagement.

Social TV Market share

Key Trends & Opportunities

Emergence of AI and Machine Learning in Content Personalization

Artificial intelligence and machine learning are revolutionizing the way broadcasters personalize content and audience interactions. These technologies analyze real-time social data to predict preferences, recommend shows, and automate engagement strategies. Broadcasters use AI to generate highlights, monitor sentiment, and manage viewer interactions seamlessly. This trend is reshaping social broadcasting by enabling more tailored experiences that enhance viewer satisfaction. As personalization becomes a central competitive factor, AI-driven tools present a major opportunity for innovation in the Social TV ecosystem.

  • For instance, YouTube, which uses AI-based content moderation systems to proactively identify and remove approximately 90% of policy-violating videos before manual review, thereby maintaining a safer viewer environment.

Growing Monetization Through Interactive Advertising

Interactive advertising is emerging as a significant opportunity within the Social TV landscape. Brands increasingly utilize polls, shoppable content, and live social integrations to connect directly with audiences during broadcasts. This approach enhances user engagement and allows advertisers to measure performance instantly through analytics. The trend toward interactive ad formats not only improves viewer participation but also maximizes ad conversion rates. Broadcasters adopting these solutions are achieving better revenue growth while offering audiences a more dynamic and participatory viewing experience.

  • For instance, Volvo launched interactive Connected TV ads for its S90 model on Roku and Samsung platforms, allowing viewers to virtually explore the vehicle and receive personalized dealership information.

Key Challenges

Data Privacy and Content Moderation Concerns

As social media becomes an integral part of broadcasting, managing user data and moderating content present major challenges. Broadcasters must ensure compliance with privacy regulations and prevent the spread of harmful or inappropriate content during live interactions. Inadequate moderation tools or policy breaches can damage brand reputation and erode audience trust. Implementing AI-driven moderation systems is essential but complex, requiring substantial investment and continuous monitoring to balance openness with safety in digital engagement.

Fragmented Platforms and Technological Integration Issues

The Social TV ecosystem faces fragmentation due to diverse platforms, devices, and regional technologies. Achieving seamless integration across broadcasting systems, OTT platforms, and social media networks is often challenging and costly. This technological disparity can disrupt real-time engagement and hinder consistent viewer experiences. Moreover, smaller broadcasters struggle with high implementation costs and interoperability issues. Addressing these challenges through standardization and cloud-based integration solutions is vital for ensuring scalability and consistent audience interaction across global markets.

Regional Analysis

North America

North America dominates the global Social TV market, accounting for around 38% of the total market share in 2024. The market was valued at USD 729.60 million in 2018 and reached USD 1,049.56 million in 2024, projected to hit USD 2,448.59 million by 2032, growing at a CAGR of 11.2%. The region’s growth is driven by the strong presence of major broadcasters, advanced social media integration, and high smartphone and OTT platform penetration. The U.S. leads regional adoption, with increasing investments in interactive broadcasting and AI-driven analytics enhancing audience engagement.

Europe

Europe holds a significant position in the Social TV market with approximately 24% market share in 2024. Valued at USD 471.20 million in 2018, the market expanded to USD 657.43 million in 2024 and is expected to reach USD 1,445.20 million by 2032, registering a CAGR of 10.4%. Growth is fueled by strong demand for hybrid television services, increased use of social media in live broadcasting, and regulatory support for digital content innovation. The UK, Germany, and France are major contributors, leveraging audience analytics and second-screen engagement to drive interactive viewing experiences.

Asia Pacific

The Asia Pacific region represents the fastest-growing market, holding around 28% share in 2024, with a robust CAGR of 12.5%. The market was valued at USD 509.20 million in 2018 and surged to USD 770.99 million in 2024, projected to reach USD 1,971.92 million by 2032. Growth is driven by rising internet penetration, increasing consumption of digital entertainment, and expanding OTT platforms across China, India, and Japan. The proliferation of smart devices and youth-driven social engagement further boosts adoption, making the region a key innovation hub for interactive and mobile-based broadcasting solutions.

Latin America

Latin America accounts for about 6% of the global Social TV market in 2024, with steady growth at a CAGR of 10.2%. Valued at USD 117.80 million in 2018, it reached USD 169.74 million in 2024 and is anticipated to grow to USD 367.32 million by 2032. Market expansion is supported by increasing social media activity during live events, rising internet access, and the adoption of connected TVs. Brazil and Mexico lead the regional market, leveraging live sports and entertainment broadcasts to promote audience interaction and brand engagement through integrated social platforms.

Middle East

The Middle East Social TV market captured around 3% share in 2024, expanding at a CAGR of 8.4%. The market was valued at USD 39.90 million in 2018 and grew to USD 51.41 million in 2024, expected to reach USD 97.57 million by 2032. Growth is driven by increasing investments in digital broadcasting infrastructure and a rising young population active on social media. GCC countries, particularly the UAE and Saudi Arabia, are leading adoption with the expansion of OTT streaming services and live entertainment platforms enhancing interactive viewer engagement.

Africa

Africa holds a market share of about 2% in 2024, with gradual growth at a CAGR of 8.2%. The market was valued at USD 32.30 million in 2018, increasing to USD 65.82 million in 2024, and is forecasted to reach USD 128.33 million by 2032. Rising mobile connectivity, expanding internet access, and the growing popularity of social media among young audiences are supporting market growth. South Africa and Egypt lead the regional demand, with broadcasters increasingly adopting social integration tools to enhance content visibility and audience participation in live programs.

Social TV Market segmentation

Market Segmentations:

By Solution

  • Social TV Software
  • Broadcast Integration
  • Audience Engagement
  • Content Moderation
  • Social TV Analytics
  • Social Networking Platform
  • Others
  • Social TV Services
  • Integration and Consulting
  • Operation and Installation
  • Maintenance and Repairing

By Application

  • Sports
  • News
  • TV Shows
  • Others

 By Region

  • North America
    • U.S.
    • Canada
    • Mexico
  • Europe
    • Germany
    • France
    • U.K.
    • Italy
    • Spain
    • Rest of Europe
  • Asia Pacific
    • China
    • Japan
    • India
    • South Korea
    • South-east Asia
    • Rest of Asia Pacific
  • Latin America
    • Brazil
    • Argentina
    • Rest of Latin America
  • Middle East & Africa
    • GCC Countries
    • South Africa
    • Rest of the Middle East and Africa

Competitive Landscape

The competitive landscape of the Social TV market features prominent players such as Talkwalker Inc., Flowics, SentabTV, Telescope Inc., Haier Group, Hitachi Ltd., iPowow Ltd., Sharp Corporation, Snipperwall, and Socialbakers Ltd. These companies compete through technological innovation, strategic collaborations, and product diversification to strengthen their global presence. The market is characterized by a growing emphasis on AI-driven analytics, audience engagement platforms, and integration of social networking tools within broadcasting systems. Leading players focus on developing cloud-based, interactive solutions to enhance real-time viewer participation and advertising efficiency. Additionally, mergers and partnerships between broadcasters and tech firms are becoming common, enabling faster deployment of cross-platform engagement tools. Continuous innovation in content moderation, analytics, and user experience personalization remains central to maintaining competitive advantage. As digital transformation accelerates across media industries, competition intensifies, pushing companies to expand their service portfolios and invest heavily in intelligent social interaction technologies.

Shape Your Report to Specific Countries or Regions & Enjoy 30% Off!

Key Player Analysis

  • Talkwalker Inc.
  • Flowics
  • SentabTV
  • Telescope Inc.
  • Haier Group
  • Hitachi, Ltd.
  • iPowow Ltd.
  • Sharp Corporation
  • Snipperwall
  • Socialbakers Ltd.

Recent Developments

  • In July 2025, CloudTV launched a new Connected-TV advertising platform and entered a strategic partnership with Magnite, an independent sell-side ad-tech company, to enhance targeted ad delivery and audience engagement.
  • In October 2025, Trump Media & Technology Group Corp., operator of Truth Social, announced an exclusive partnership with Crypto.com | Derivatives North America (CDNA) to launch Truth Predict, a prediction-markets product integrated into its social media platform.
  • In July 2025, Samba TV and Kochava announced a strategic partnership to launch unified cross-platform TV measurement, integrating Samba TV’s first-party viewership data with Kochava’s omnichannel attribution analytics.
  • In September 2025, AppsFlyer and Roku, Inc. (via Roku Ads) announced a partnership enabling omnichannel campaign measurement from connected TV (CTV) to mobile, allowing advertisers to tie streaming campaigns to mobile app installs and other outcomes

Report Coverage

The research report offers an in-depth analysis based on Solution, Application and Region. It details leading market players, providing an overview of their business, product offerings, investments, revenue streams, and key applications. Additionally, the report includes insights into the competitive environment, SWOT analysis, current market trends, as well as the primary drivers and constraints. Furthermore, it discusses various factors that have driven market expansion in recent years. The report also explores market dynamics, regulatory scenarios, and technological advancements that are shaping the industry. It assesses the impact of external factors and global economic changes on market growth. Lastly, it provides strategic recommendations for new entrants and established companies to navigate the complexities of the market.

Future Outlook

  1. The Social TV market will experience steady growth driven by the rising integration of social media with live television broadcasts.
  2. AI and machine learning will play a key role in enhancing audience analytics and personalized content delivery.
  3. Broadcasters will increasingly adopt cloud-based platforms to enable seamless real-time audience engagement.
  4. Interactive advertising formats will become a major revenue stream for media companies.
  5. The growing popularity of OTT and streaming platforms will expand the scope of Social TV integration.
  6. Partnerships between broadcasters and tech companies will accelerate innovation in engagement tools.
  7. Emerging markets in Asia Pacific and Latin America will witness rapid adoption of Social TV technologies.
  8. Mobile device usage will continue to drive multi-screen engagement and real-time content sharing.
  9. Enhanced data analytics and viewer insights will enable more targeted advertising strategies

Sustainability and digital accessibility will influence future investments in broadcasting and social engagement infrastructure

CHAPTER NO. 1 :     GENESIS OF THE MARKET

1.1 Market Prelude – Introduction & Scope

1.2 The Big Picture – Objectives & Vision

1.3 Strategic Edge – Unique Value Proposition

1.4 Stakeholder Compass – Key Beneficiaries

CHAPTER NO. 2 :   EXECUTIVE LENS   

2.1 Pulse of the Industry – Market Snapshot

2.2 Growth Arc – Revenue Projections (USD Million)

2.3. Premium Insights – Based on Primary Interviews

CHAPTER NO. 3 :   SOCIAL TV MARKET FORCES & INDUSTRY PULSE           

3.1 Foundations of Change – Market Overview
3.2 Catalysts of Expansion – Key Market Drivers
3.2.1 Momentum Boosters – Growth Triggers
3.2.2 Innovation Fuel – Disruptive Technologies
3.3 Headwinds & Crosswinds – Market Restraints
3.3.1 Regulatory Tides – Compliance Challenges
3.3.2 Economic Frictions – Inflationary Pressures
3.4 Untapped Horizons – Growth Potential & Opportunities
3.5 Strategic Navigation – Industry Frameworks
3.5.1 Market Equilibrium – Porter’s Five Forces
3.5.2 Ecosystem Dynamics – Value Chain Analysis
3.5.3 Macro Forces – PESTEL Breakdown

3.6 Price Trend Analysis

3.6.1 Regional Price Trend
3.6.2 Price Trend by product

CHAPTER NO. 4 :   KEY INVESTMENT EPICENTER           

4.1 Regional Goldmines – High-Growth Geographies

4.2 Solution Frontiers – Lucrative Solution Categories

4.3 Application Sweet Spots – Emerging Demand Segments

CHAPTER NO. 5: REVENUE TRAJECTORY & WEALTH MAPPING

5.1 Momentum Metrics – Forecast & Growth Curves

5.2 Regional Revenue Footprint – Market Share Insights

5.3 Segmental Wealth Flow – Solution & Application Revenue

CHAPTER NO. 6 :   TRADE & COMMERCE ANALYSIS      

6.1.      Import Analysis by Region

6.1.1.   Global Social TV Market Import Revenue By Region

6.2.      Export Analysis by Region

6.2.1.   Global Social TV Market Export Revenue By Region

CHAPTER NO. 7 :   COMPETITION ANALYSIS         

7.1.      Company Market Share Analysis

7.1.1.   Global Social TV Market: Company Market Share

7.2.      Global Social TV Market Company Revenue Market Share

7.3.      Strategic Developments

7.3.1.   Acquisitions & Mergers

7.3.2.   New Solution Launch

7.3.3.   Regional Expansion

7.4.      Competitive Dashboard

7.5.    Company Assessment Metrics, 2024

CHAPTER NO. 8 :   SOCIAL TV MARKET – BY SOLUTION SEGMENT ANALYSIS   

8.1.      Social TV Market Overview by Solution Segment

8.1.1.   Social TV Market Revenue Share By Solution

8.1.2.   Social TV Market Revenue Share By Solution

8.2.      Social TV Software

8.2.1    Broadcast Integration

8.2.2    Audience Engagement

8.2.3    Content Moderation

8.2.4    Social TV Analytics

8.2.5    Social Networking Platform

8.2.6    Others

8.3.      Social TV Service

8.3.1    Integration and Consulting

8.3.2    Operation and Installation

8.3.3    Maintenance and Repairing

CHAPTER NO. 9 :   SOCIAL TV MARKET – BY APPLICATION SEGMENT ANALYSIS

9.1.      Social TV Market Overview by Application Segment

9.1.1.   Social TV Market Revenue Share By Application

9.1.2.   Social TV Market Revenue Share By Application

9.2.      Sports

9.3.      News

9.4.      TV Shows

9.5.      Others

CHAPTER NO. 10 : SOCIAL TV MARKET – REGIONAL ANALYSIS

10.1.    Social TV Market Overview by Region Segment

10.1.1. Global Social TV Market Revenue Share By Region

10.1.2. Regions

10.1.3. Global Social TV Market Revenue By Region

10.1.4. Global Social TV Market Revenue By Region

10.1.5. Solution

10.1.6. Global Social TV Market Revenue By Solution

10.1.7. Global Social TV Market Revenue By Solution

10.1.8. Application

10.1.9. Global Social TV Market Revenue By Application

10.1.10.           Global Social TV Market Revenue By Application

CHAPTER NO. 11 : NORTH AMERICA SOCIAL TV MARKET – COUNTRY ANALYSIS   

11.1.    North America Social TV Market Overview by Country Segment

11.1.1. North America Social TV Market Revenue Share By Region

11.2.    North America

11.2.1. North America Social TV Market Revenue By Country

11.2.2. Solution

11.2.3. North America Social TV Market Revenue By Solution

11.2.4. Application

11.2.5. North America Social TV Market Revenue By Application

11.3.    U.S.

11.4.    Canada

11.5.    Mexico

CHAPTER NO. 12 : EUROPE SOCIAL TV MARKET – COUNTRY ANALYSIS   

12.1.    Europe Social TV Market Overview by Country Segment

12.1.1. Europe Social TV Market Revenue Share By Region

12.2.    Europe

12.2.1. Europe Social TV Market Revenue By Country

12.2.2. Solution

12.2.3. Europe Social TV Market Revenue By Solution

12.2.4. Application

12.2.5. Europe Social TV Market Revenue By Application

12.3.    UK

12.4.    France

12.5.    Germany

12.6.    Italy

12.7.    Spain

12.8.    Russia

12.9.   Rest of Europe

CHAPTER NO. 13 : ASIA PACIFIC SOCIAL TV MARKET – COUNTRY ANALYSIS

13.1.    Asia Pacific Social TV Market Overview by Country Segment

13.1.1. Asia Pacific Social TV Market Revenue Share By Region

13.2.    Asia Pacific

13.2.1. Asia Pacific Social TV Market Revenue By Country

13.2.2. Solution

13.2.3. Asia Pacific Social TV Market Revenue By Solution

13.2.4. Application

13.2.5. Asia Pacific Social TV Market Revenue By Application

13.3.    China

13.4.    Japan

13.5.    South Korea

13.6.    India

13.7.    Australia

13.8.    Southeast Asia

13.9.    Rest of Asia Pacific

CHAPTER NO. 14 : LATIN AMERICA SOCIAL TV MARKET – COUNTRY ANALYSIS

14.1.    Latin America Social TV Market Overview by Country Segment

14.1.1. Latin America Social TV Market Revenue Share By Region

14.2.    Latin America

14.2.1. Latin America Social TV Market Revenue By Country

14.2.2. Solution

14.2.3. Latin America Social TV Market Revenue By Solution

14.2.4. Application

14.2.5. Latin America Social TV Market Revenue By Application

14.3.    Brazil

14.4.    Argentina

14.5.    Rest of Latin America

CHAPTER NO. 15 : MIDDLE EAST SOCIAL TV MARKET – COUNTRY ANALYSIS

15.1.    Middle East Social TV Market Overview by Country Segment

15.1.1. Middle East Social TV Market Revenue Share By Region

15.2.    Middle East

15.2.1. Middle East Social TV Market Revenue By Country

15.2.2. Solution

15.2.3. Middle East Social TV Market Revenue By Solution

15.2.4. Application

15.2.5. Middle East Social TV Market Revenue By Application

15.3.    GCC Countries

15.4.    Israel

15.5.    Turkey

15.6.    Rest of Middle East

CHAPTER NO. 16 : AFRICA SOCIAL TV MARKET – COUNTRY ANALYSIS   

16.1.    Africa Social TV Market Overview by Country Segment

16.1.1. Africa Social TV Market Revenue Share By Region

16.2.    Africa

16.2.1. Africa Social TV Market Revenue By Country

16.2.2. Solution

16.2.3. Africa Social TV Market Revenue By Solution

16.2.4. Application

16.2.5. Africa Social TV Market Revenue By Application

16.3.    South Africa

16.4.    Egypt

16.5.    Rest of Africa

CHAPTER NO. 17 : COMPANY PROFILES     

17.1.    Talkwalker Inc.

17.1.1. Company Overview

17.1.2. Solution Portfolio

17.1.3. Financial Overview

17.1.4. Recent Developments

17.1.5. Growth Strategy

17.1.6. SWOT Analysis

17.2.    Flowics

17.3.    SentabTV

17.4.    Telescope

17.5.    Haier Group

17.6.    Hitachi, Ltd.

17.7.    iPowow Ltd

17.8.    Sharp Corporation

17.9.    Snipperwall

17.10.  Socialbakers Ltd.

Request Free Sample

We prioritize the confidentiality and security of your data. Our promise: your information remains private.

Ready to Transform Data into Decisions?

Request Your Sample Report and Start Your Journey of Informed Choices


Providing the strategic compass for industry titans.

cr-clients-logos

Frequently Asked Questions:

What is the current size of the Social TV Market?

The global Social TV Market was valued at USD 2,764.95 million in 2024 and is projected to reach USD 6,458.93 million by 2032.

At what Compound Annual Growth Rate is the Social TV Market projected to grow between 2025 and 2032?

The Social TV Market is expected to grow at a CAGR of 11.24% during the forecast period from 2025 to 2032.

What factors are driving the growth of the Social TV Market?

Key factors include rising social media integration with live broadcasts, growing adoption of connected devices, and increasing use of AI-driven audience analytics.

What are some challenges faced by the Social TV Market?

Challenges include ensuring data privacy and compliance with stringent regulations such as the GDPR, managing content moderation to prevent platform misuse, and maintaining reliable internet connectivity in certain regions. Additionally, resistance from traditional broadcasters to adopt interactive features and high costs of technology integration can impede market growth.

Who are the major players in the Social TV Market?

Major players include Facebook, Twitter, YouTube, Netflix, Hulu, Amazon Prime Video, Instagram, Snapchat, TikTok, and Reddit.

Which segment is leading the market share?

The software segment leads the market, driven by platforms and applications that enable interactive and personalized social TV experiences. These solutions facilitate real-time engagement, targeted advertising, and analytics-driven content strategies for enhanced user interaction.

About Author

Sushant Phapale

Sushant Phapale

ICT & Automation Expert

Sushant is an expert in ICT, automation, and electronics with a passion for innovation and market trends.

View Profile

Related Reports

Space Situational Awareness Market

The Space Situational Awareness Market size was valued at USD 1,730.88 Million in 2024 and is anticipated to reach USD 2,480.39 Million by 2032, at a CAGR of 4.6% during the forecast period.

Oil and Gas Accounting Software Market

The Oil And Gas Accounting Software Market size was valued USD  1,980.5  Million in 2024 and is anticipated to reach USD  3,327.29  Million by 2032, at a CAGR of 6.7 % during the forecast period.

North America Grid Modernization Market

The North America Grid Modernization Market size was valued at USD 9,658.6 Billion in 2018, and is projected to reach USD 15,225.5 Billion in 2024, growing at a Compound Annual Growth Rate (CAGR) of 9.89% during the forecast period. The market is expected to further expand to USD 32,020.2 Billion by 2032.

Quantum Computing-As-A-Service (QCaaS) Market

The Quantum Computing-As-A-Service (QCaaS) Market size was valued at USD 640.00 million in 2018, reaching USD 1,817.96 million in 2024 and is anticipated to reach USD 18,598.33 million by 2032, at a CAGR of 33.88% during the forecast period.

AI-Driven Personalized Nutrition and Wellness Solutions Market

The Global AI-Driven Personalized Nutrition and Wellness Solutions Market size was valued at USD 1,501.16 million in 2018 to USD 4,572.67 million in 2024 and is anticipated to reach USD 17,867.16 million by 2032, at a CAGR of 17.32% during the forecast period.  

Patient Registry Software Market

Patient Registry Software Market size was valued USD 2.08 billion in 2024 and is anticipated to reach USD 4.27 billion by 2032, at a CAGR of 9.41% during the forecast period.

Language Translation Devices Market

Language Translation Devices Market size was valued USD 2.29 billion in 2024 and is anticipated to reach USD 4.3 billion by 2032, at a CAGR of 8.19% during the forecast period.

Logistics Consulting Services Market

The Global Logistics Consulting Services Market was valued at USD 14,263.8 Billion in 2018, projected to reach USD 17,761.2 Billion by 2024, and is anticipated to grow to USD 26,214.9 Billion by 2032, at a CAGR of 5.07% during the forecast period.

Construction Robots Market

The Construction Robots Market is projected to grow from USD 1,410.5 million in 2024 to an estimated USD 4,737.01 million by 2032, with a compound annual growth rate (CAGR) of 16.35% from 2024 to 2032.

Cloud FinOps Market

The Cloud FinOps Market size was valued at USD 9,800.00 million in 2018 to USD 14,061.21 million in 2024 and is anticipated to reach USD 33,127.02 million by 2032, at a CAGR of 11.38% during the forecast period.

Casting Simulation Software Market

The Casting Simulation Software Market is projected to grow from USD 1,290.39 million in 2024 to an estimated USD 2,151.69 million by 2032, with a compound annual growth rate (CAGR) of 6.6% from 2024 to 2032.

2D Materials Market

2d Materials Market size was valued USD 2.39 billion in 2024 and is anticipated to reach USD 3.09 billion by 2032, at a CAGR of 3.26% during the forecast period.

Licence Option

The report comes as a view-only PDF document, optimized for individual clients. This version is recommended for personal digital use and does not allow printing. Use restricted to one purchaser only.
$4999

To meet the needs of modern corporate teams, our report comes in two formats: a printable PDF and a data-rich Excel sheet. This package is optimized for internal analysis. Unlimited users allowed within one corporate location (e.g., regional office).
$6999

The report will be delivered in printable PDF format along with the report’s data Excel sheet. This license offers 100 Free Analyst hours where the client can utilize Credence Research Inc. research team. Permitted for unlimited global use by all users within the purchasing corporation, such as all employees of a single company.
$12999

Report delivery within 24 to 48 hours

Credence Staff 3

WILLIAM, North America

Support Staff at Credence Research

KEITH PHILLIPS, Europe

Lee - CR Sales Staff

LEE VALLANCE, Asia Pacific

Kieran Jameson

KIERAN JAMESON, Australia

Smallform of Sample request
User Review

Thank you for the data! The numbers are exactly what we asked for and what we need to build our business case.

Materials Scientist
(privacy requested)

User Review

The report was an excellent overview of the Industrial Burners market. This report does a great job of breaking everything down into manageable chunks.

Imre Hof
Management Assistant, Bekaert

cr-clients-logos

Request Sample