Market Overview:
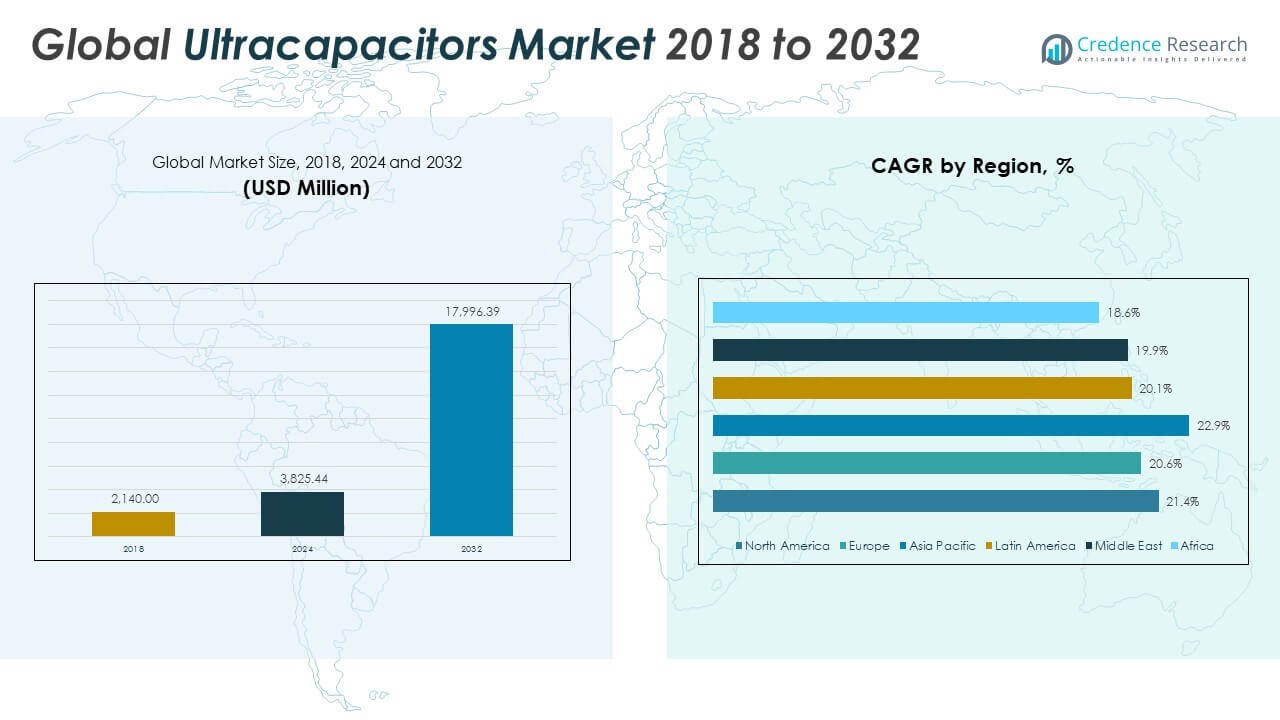
The Global Ultracapacitors Market size was valued at USD 2,140.00 million in 2018 to USD 3,825.44 million in 2024 and is anticipated to reach USD 17,996.39 million by 2032, at a CAGR of 21.42% during the forecast period.
| REPORT ATTRIBUTE |
DETAILS |
| Historical Period |
2020-2023 |
| Base Year |
2024 |
| Forecast Period |
2025-2032 |
| Ultracapacitors Market Size 2024 |
USD 3,825.44 Million |
| Ultracapacitors Market, CAGR |
21.42% |
| Ultracapacitors Market Size 2032 |
USD 17,996.39 Million |
Several key drivers are fueling the growth of the ultracapacitors market. The rapid electrification of transportation systems, particularly in electric vehicles (EVs) and hybrid electric vehicles (HEVs), is creating a significant demand for ultracapacitors due to their ability to support regenerative braking and quick acceleration. In renewable energy systems, ultracapacitors play a vital role in stabilizing power output from solar and wind sources, providing short-term storage and ensuring grid reliability. Additionally, advancements in materials science—such as the development of graphene-based electrodes—are enhancing the energy density and efficiency of ultracapacitor technologies. Their fast charging capability, low maintenance, and superior cycle life are particularly appealing in mission-critical sectors like aerospace, defense, and industrial automation. Furthermore, favorable government policies supporting clean energy, coupled with increasing investments in research and development, are driving the commercialization of ultracapacitor solutions across diverse applications.
Regionally, North America currently holds the largest share of the global ultracapacitors market, driven by strong investments in EV infrastructure, energy storage systems, and smart grid technologies. The United States leads the region with significant contributions from both public and private sectors toward electrification and renewable integration. Asia-Pacific is emerging as the fastest-growing region, led by China, Japan, South Korea, and India, where rising urbanization, industrial growth, and supportive regulatory frameworks are promoting the adoption of ultracapacitors in automotive, consumer electronics, and renewable energy segments. The region also benefits from a strong manufacturing base and substantial R&D efforts aimed at improving ultracapacitor performance and scalability. Europe, known for its focus on sustainability and clean technology, is also witnessing steady growth, with several countries investing in electric mobility and smart energy systems. Meanwhile, Latin America, the Middle East, and Africa are showing growing potential, supported by gradual infrastructure development and increasing energy access initiatives, positioning these regions as emerging markets for ultracapacitor deployment.
Access crucial information at unmatched prices!
Request your sample report today & start making informed decisions powered by Credence Research Inc.!
Download Sample
Market Insights:
- The Global Ultracapacitors Market was valued at USD 2,140.00 million in 2018 and is projected to reach USD 17,996.39 million by 2032, growing at a CAGR of 21.42% during the forecast period.
- Rapid electrification of transportation systems, especially in electric and hybrid vehicles, is driving demand for ultracapacitors due to their ability to support regenerative braking, fast acceleration, and battery performance enhancement.
- Ultracapacitors play a key role in renewable energy systems by providing short-duration storage to stabilize output from solar and wind sources and maintain grid reliability in both utility-scale and decentralized power applications.
- Technological advancements, including the development of graphene-based and hybrid electrodes, are improving energy density, scalability, and cost efficiency, expanding the use of ultracapacitors across aerospace, automation, and electronics.
- Government support through clean energy policies, emissions regulations, and funding initiatives is accelerating ultracapacitor adoption in grid modernization, sustainable transport, and industrial decarbonization projects.
- High production costs and limited energy density compared to traditional batteries remain significant challenges, restricting broader use in long-duration or budget-constrained applications.
- North America holds the largest market share, Asia-Pacific is witnessing the fastest growth, Europe is advancing sustainability-focused deployments, and Latin America, the Middle East, and Africa offer untapped opportunities as infrastructure expands.
Market Drivers:
Rising Demand for Energy Storage in Electric Mobility and Transportation:
Electric vehicles (EVs), hybrid electric vehicles (HEVs), and public transportation systems are significantly increasing the demand for fast-charging and high-performance energy storage solutions. Ultracapacitors are well-suited for automotive applications, offering superior power density, longer cycle life, and rapid charge-discharge capabilities. These characteristics make them ideal for supporting regenerative braking, engine start-stop systems, and short-term acceleration needs. The Global Ultracapacitors Market is benefiting from widespread electrification efforts across both passenger and commercial vehicle segments. Automakers and mobility service providers are incorporating ultracapacitors to enhance vehicle efficiency and battery lifespan. Rising government incentives and stricter emission regulations are further accelerating the deployment of ultracapacitor-based systems in transportation fleets.
- For instance, Continental AG supplies ultracapacitor-based voltage stabilization systems (VSS) for automotive start-stop applications. These systems, used in vehicles like the Peugeot 3008 and Cadillac ATS/CTS, enable engine restarts twice as fast as conventional systems (within 400 milliseconds), significantly extending battery life and improving fuel efficiency by up to 10%.
Increasing Integration of Renewable Energy Sources and Grid Stabilization Requirements:
The global transition toward renewable energy is intensifying the need for short-duration, high-power energy storage to stabilize fluctuating power outputs. Ultracapacitors support solar and wind energy systems by absorbing and releasing power instantly, enhancing grid stability and improving energy dispatch capabilities. Their reliability and fast response time make them suitable for frequency regulation, load leveling, and voltage support in utility-scale applications. The Global Ultracapacitors Market is witnessing strong interest from energy developers and utilities aiming to strengthen infrastructure resilience. Demand is particularly high in off-grid and microgrid systems that rely on intermittent renewable sources. It offers a reliable bridge between variable generation and end-use consumption, supporting uninterrupted and high-quality power supply.
- For instance, Siemens Energy was commissioned by TenneT to supply three grid stabilization systems for the German power grid, including the world’s first reactive power compensation system using supercapacitors (Static Var Compensator Frequency Stabilizer). This system can withdraw or feed up to 200 MW to the grid, responding to frequency fluctuations much faster than battery-based solutions. Commissioning is scheduled for 2025.
Technological Advancements in Materials and Manufacturing Processes:
Innovations in materials science, particularly the development of graphene-based and hybrid electrodes, are significantly enhancing the energy density and efficiency of ultracapacitors. These advancements are helping to overcome traditional limitations of energy storage capacity while preserving high cycle life and fast response characteristics. Manufacturers are adopting new production techniques to reduce cost, improve scalability, and enable customization for industry-specific applications. The Global Ultracapacitors Market is benefiting from ongoing R&D investments that are expanding application possibilities across industrial automation, aerospace, and consumer electronics. It is evolving rapidly with the integration of smart control systems, embedded sensors, and compact modular designs. These developments are positioning ultracapacitors as competitive alternatives in hybrid storage systems.
Favorable Policy Landscape and Sustainability-Focused Industry Initiatives:
Energy storage technologies are gaining strong policy support through national electrification strategies, emissions targets, and grid modernization programs. Ultracapacitors, as eco-friendly and recyclable storage components, align well with sustainability goals and green infrastructure mandates. Public funding and innovation grants are enabling pilot projects and commercial deployments across sectors. The Global Ultracapacitors Market is advancing in parallel with broader environmental and regulatory shifts promoting energy efficiency and carbon reduction. It is also supported by growing corporate commitments to decarbonization and electrified operations. The alignment between public policy and private investment continues to strengthen the case for ultracapacitor adoption on a global scale.
Market Trends:
Growing Adoption of Hybrid Energy Storage Systems Across Industries:
Organizations are increasingly adopting hybrid energy storage systems that combine ultracapacitors with batteries or fuel cells to leverage the strengths of both technologies. Ultracapacitors manage high power demands, while batteries supply sustained energy over longer periods. This combination enhances system performance, improves energy efficiency, and extends battery life in high-demand scenarios. The Global Ultracapacitors Market is benefiting from this trend as industries seek to optimize storage configurations for dynamic applications such as cranes, industrial forklifts, metro systems, and heavy-duty machinery. Manufacturers are designing integrated modules that support seamless energy transitions and real-time load balancing. These hybrid systems are gaining traction in sectors requiring peak power performance and reliability under cyclic loads.
- For instance, Hitachi developed stationary lithium-ion battery-driven energy storage systems for emergency train travel and regenerative braking in metro systems, field-tested with Tokyo Metro. Since 2007, ten such systems have been deployed globally, allowing trains to operate during power failures and enhancing energy savings by storing regenerative braking energy.
Miniaturization and Development of Flexible Ultracapacitors for Wearable Electronics:
Research initiatives are driving the miniaturization of ultracapacitors and enabling their use in flexible, lightweight form factors. These innovations are facilitating the integration of energy storage into wearable electronics, smart textiles, and compact medical devices. The Global Ultracapacitors Market is evolving to meet the growing need for compact and reliable power sources in emerging consumer electronics. It is seeing increased collaboration between material scientists and device manufacturers to develop ultrathin, bendable storage components. These ultracapacitors deliver short bursts of power for wireless communication, biometric sensors, and real-time monitoring in wearable technologies. This trend is expanding the market’s reach beyond industrial and automotive sectors into lifestyle and healthcare domains.
- For instance, Panasonic has commercialized advanced film and polymer capacitors for electronic equipment and medical devices, focusing on safety, reliability, and long life. Their JX series SP-Cap® capacitors achieve three times the lifespan of previous models (3,000 hours at 125°C) and high durability under humidity, but there is no verified public data on their use in wearable medical patches for continuous ECG monitoring.
Increased Focus on Sustainable and Biodegradable Materials in Ultracapacitor Design:
Environmental concerns are pushing researchers and manufacturers to explore sustainable materials for ultracapacitor components. New developments include the use of biodegradable polymers, organic electrolytes, and carbon derived from renewable sources such as coconut shells and algae. The Global Ultracapacitors Market is responding to the demand for greener solutions that reduce environmental impact without compromising performance. It is aligning with global initiatives targeting eco-friendly electronics and sustainable supply chains. Companies are integrating life cycle assessment into product development to ensure minimal waste and improved recyclability. This trend is expected to redefine material sourcing strategies and manufacturing practices in the energy storage sector.
Integration of AI and IoT Capabilities for Smart Energy Storage Management:
Ultracapacitor systems are increasingly incorporating artificial intelligence (AI) and Internet of Things (IoT) technologies to enable real-time performance monitoring and predictive maintenance. Embedded sensors and connected software platforms allow operators to track voltage levels, thermal conditions, and cycle counts remotely. The Global Ultracapacitors Market is experiencing a shift toward intelligent systems that optimize energy usage and reduce downtime in mission-critical applications. It is enhancing the appeal of ultracapacitors in smart infrastructure, autonomous systems, and industrial automation. AI-driven analytics are helping users extend device lifespans and improve operational efficiency across diverse environments. This digital integration is positioning ultracapacitors as part of the broader smart energy ecosystem.
Market Challenges Analysis:
High Production Costs and Limited Energy Density Continue to Restrict Broader Adoption:
Despite notable advancements, the cost of producing ultracapacitors remains significantly higher compared to traditional batteries, primarily due to the use of advanced materials and specialized manufacturing processes. This cost barrier limits their large-scale deployment in price-sensitive markets and low-margin applications. The energy density of ultracapacitors is still considerably lower than that of lithium-ion batteries, which restricts their suitability for long-duration energy storage. The Global Ultracapacitors Market faces challenges in balancing performance with affordability, especially when targeting mass-market automotive or consumer applications. It must address the trade-off between rapid power delivery and limited storage capacity to compete effectively. Manufacturers are under pressure to reduce unit costs through material innovation and production optimization without compromising product reliability.
Lack of Standardization and Infrastructure Hinders Market Scalability:
The absence of widely adopted technical standards across the ultracapacitor industry creates compatibility challenges in system design and integration. Different specifications in voltage ratings, charge protocols, and module configurations make it difficult to streamline adoption across industries. The Global Ultracapacitors Market must overcome the lack of standardized benchmarks to ensure interoperability and simplify product selection for end users. It also struggles with insufficient supporting infrastructure, especially in emerging markets where awareness and technical expertise are limited. These gaps hinder broader deployment, delay project timelines, and increase total implementation costs. Building a unified framework for testing, certification, and integration is critical to unlocking the market’s full potential.
Market Opportunities:
Expansion Potential in Emerging Markets and Decentralized Energy Systems:
Emerging economies offer substantial growth prospects for ultracapacitor technologies due to rising energy demand, infrastructure development, and increasing adoption of decentralized energy systems. These regions face grid instability and require reliable short-term storage solutions, where ultracapacitors can play a pivotal role. The Global Ultracapacitors Market can leverage this opportunity by targeting rural electrification projects, microgrids, and renewable energy integration initiatives. It can also benefit from local government programs promoting clean and resilient energy infrastructure. Partnerships with regional energy providers and distributors can accelerate market entry and deployment. Tailored, low-cost solutions suited for these environments will enhance accessibility and impact.
Opportunities in Next-Generation Consumer and Industrial Electronics:
The rise of compact, high-performance electronic devices across industrial, healthcare, and consumer sectors creates a growing need for efficient burst-power storage. Ultracapacitors offer a reliable solution for applications requiring quick energy discharge, such as power tools, wearable devices, and robotics. The Global Ultracapacitors Market is positioned to capitalize on this shift by offering miniaturized and application-specific components. It can collaborate with OEMs to embed ultracapacitors in next-generation electronics. Growing interest in smart devices and automation will expand demand for these components in both established and niche markets. This trend presents a scalable and innovation-driven growth avenue.
Market Segmentation Analysis:
By Type
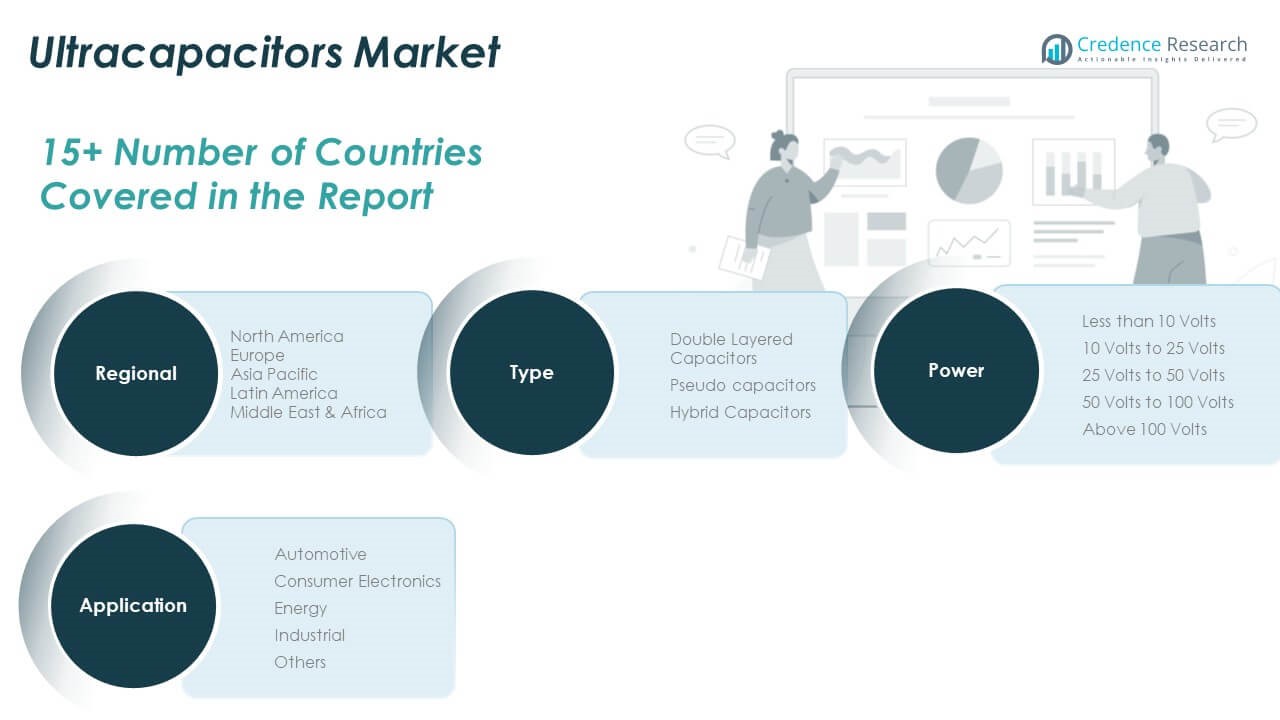
The Global Ultracapacitors Market includes three primary types: double layered capacitors, pseudo capacitors, and hybrid capacitors. Double layered capacitors hold the largest share due to their high capacitance and widespread adoption in consumer electronics and automotive systems. Pseudo capacitors, which use fast redox reactions to store energy, are gaining adoption in applications requiring higher energy density. Hybrid capacitors, combining the features of batteries and capacitors, are expanding rapidly in electric vehicles and industrial automation due to their enhanced performance profile.
- For instance, Nippon Chemi-Con‘s double layered capacitors are used in over 5 million automotive units annually, each with a rated capacitance of up to 3,000 Farads.
By Power
The market is segmented into five voltage categories: less than 10 volts, 10 volts to 25 volts, 25 volts to 50 volts, 50 volts to 100 volts, and above 100 volts. Ultracapacitors in the 10 to 50 volts range dominate due to their suitability for automotive electronics, power tools, and portable devices. The segments above 50 volts are essential in heavy-duty applications such as grid energy storage, transportation, and industrial machinery, where reliability and high-power bursts are required.
- For instance, Maxwell Technologies supplies 48V ultracapacitor modules for mild hybrid vehicles, enabling engine restart in less than 0.2 seconds and supporting more than 1 million cycles.
By Application
Key application areas include automotive, consumer electronics, energy, industrial, and others. Automotive leads the Global Ultracapacitors Market, driven by the rise of electric vehicles and energy recovery systems. Consumer electronics use ultracapacitors for rapid power support in wearables and small devices. The energy segment integrates them into renewable systems for grid stabilization, while the industrial sector applies them in backup power and equipment reliability. It continues to evolve with application-specific innovations.
Segmentation:
By Type Segment
- Double Layered Capacitors
- Pseudo Capacitors
- Hybrid Capacitors
By Power Segment
- Less than 10 Volts
- 10 Volts to 25 Volts
- 25 Volts to 50 Volts
- 50 Volts to 100 Volts
- Above 100 Volts
By Application Segment
- Automotive
- Consumer Electronics
- Energy
- Industrial
- Others
By Region
- North America
- Europe
- Germany
- France
- U.K.
- Italy
- Spain
- Rest of Europe
- Asia Pacific
- China
- Japan
- India
- South Korea
- South-east Asia
- Rest of Asia Pacific
- Latin America
- Brazil
- Argentina
- Rest of Latin America
- Middle East & Africa
- GCC Countries
- South Africa
- Rest of the Middle East and Africa
Regional Analysis:
North America
The North America Ultracapacitors Market size was valued at USD 793.94 million in 2018 to USD 1,402.38 million in 2024 and is anticipated to reach USD 6,588.51 million by 2032, at a CAGR of 21.4% during the forecast period. North America leads the Global Ultracapacitors Market in terms of revenue share. It benefits from strong investments in electric vehicle infrastructure, renewable energy storage, and grid modernization. The United States dominates the regional landscape, supported by active public and private sector collaboration on clean energy adoption. Extensive R&D initiatives and early adoption of advanced materials continue to support market expansion. Key players headquartered in the region are contributing to both innovation and commercialization of ultracapacitor technologies.
Europe
The Europe Ultracapacitors Market size was valued at USD 573.52 million in 2018 to USD 986.09 million in 2024 and is anticipated to reach USD 4,386.67 million by 2032, at a CAGR of 20.6% during the forecast period. Europe maintains a strong presence in the Global Ultracapacitors Market due to its focus on sustainability, emissions reduction, and electrification of public transport. Germany, France, and the UK are leading adopters of ultracapacitor systems across automotive and industrial sectors. The region is witnessing consistent demand growth for hybrid energy storage systems in smart grids and renewable power installations. Strong regulatory frameworks and climate goals are reinforcing long-term market development. It continues to attract strategic partnerships and research programs that enhance product efficiency and lifecycle.
Asia Pacific
The Asia Pacific Ultracapacitors Market size was valued at USD 528.15 million in 2018 to USD 985.61 million in 2024 and is anticipated to reach USD 5,112.79 million by 2032, at a CAGR of 22.9% during the forecast period. Asia Pacific is the fastest-growing region in the Global Ultracapacitors Market. It benefits from rapid industrialization, urbanization, and strong manufacturing capabilities, particularly in China, Japan, South Korea, and India. These countries are investing heavily in electric mobility, consumer electronics, and distributed energy storage solutions. High-volume production and favorable government incentives are encouraging broader adoption across applications. It holds significant potential for cost-effective scale-up and export-oriented growth.
Latin America
The Latin America Ultracapacitors Market size was valued at USD 117.27 million in 2018 to USD 207.30 million in 2024 and is anticipated to reach USD 893.88 million by 2032, at a CAGR of 20.1% during the forecast period. Latin America is gradually emerging as a promising market for ultracapacitor applications. Brazil and Argentina are spearheading developments in electric public transit and renewable energy integration. The region is showing rising interest in industrial automation and backup energy systems, where ultracapacitors provide operational efficiency. Infrastructure constraints and limited awareness remain barriers, but ongoing public investment in sustainable technologies is helping close the gap. It presents mid- to long-term opportunities for market expansion and technology partnerships.
Middle East
The Middle East Ultracapacitors Market size was valued at USD 83.25 million in 2018 to USD 139.60 million in 2024 and is anticipated to reach USD 593.98 million by 2032, at a CAGR of 19.9% during the forecast period. The Middle East is increasingly focusing on diversifying its energy mix through renewable integration and advanced storage technologies. Countries like the UAE and Saudi Arabia are piloting smart city initiatives and electrified transport systems, creating demand for ultracapacitors. Industrial sectors are adopting energy-efficient systems to optimize performance in harsh environments. The Global Ultracapacitors Market finds regional potential through policy shifts and large-scale infrastructure development. It is gaining attention from energy developers seeking to enhance grid stability and reduce carbon dependency.
Africa
The Africa Ultracapacitors Market size was valued at USD 43.87 million in 2018 to USD 104.45 million in 2024 and is anticipated to reach USD 420.56 million by 2032, at a CAGR of 18.6% during the forecast period. Africa remains an emerging frontier in the Global Ultracapacitors Market. Off-grid solar systems, rural electrification, and mobile telecommunications infrastructure are key areas of application. Countries like South Africa, Nigeria, and Kenya are gradually deploying energy storage technologies to improve energy access and reliability. Market growth is constrained by limited technical expertise and supply chain challenges. However, international collaborations and donor-funded projects are supporting early-stage deployment. It holds long-term potential for scalable, decentralized energy solutions.
Shape Your Report to Specific Countries or Regions & Enjoy 30% Off!
Key Player Analysis:
- CAP-XX
- Eaton Corporation
- KEMET Corporation (YAGEO Group)
- LS Mtron Co., Ltd.
- Maxwell Technologies
- NEC Corporation
- Nippon Chemi-Con Corporation
- Ness Electronics, Inc.
- Panasonic Corporation
- Skeleton Technologies
- KYOCERA AVX Corporation
- ELNA CO., LTD.
Competitive Analysis:
The Global Ultracapacitors Market features a competitive landscape marked by innovation, strategic partnerships, and product diversification. Key players include CAP-XX, Eaton Corporation, KEMET Corporation (YAGEO Group), Maxwell Technologies, LS Mtron, Panasonic Corporation, and Skeleton Technologies. These companies focus on enhancing energy density, reducing costs, and developing application-specific ultracapacitor solutions. The market is witnessing increased investment in R&D to improve electrode materials, particularly graphene and hybrid technologies. It remains highly dynamic, with companies expanding their presence through joint ventures, mergers, and capacity upgrades. Strong competition exists among manufacturers targeting sectors such as automotive, industrial automation, renewable energy, and consumer electronics. Asia-Pacific leads in production capabilities, while North America and Europe drive innovation and deployment. The Global Ultracapacitors Market is evolving rapidly as manufacturers align product offerings with global trends in electrification, sustainability, and smart energy infrastructure. Competitive differentiation depends on technological advancement, scalability, and the ability to meet industry-specific performance requirements.
Recent Developments:
- In June 2025, Nippon Chemi-Con Corporation announced the appointment of new board members at its 78th Ordinary General Meeting of Shareholders. While this is primarily a corporate governance update, it reflects ongoing efforts to strengthen the company’s leadership and business expansion in the electronic components sector, including ultracapacitors.
- In May 2025, Maxwell Technologies received an additional investment from Grantchester Group to accelerate its growth initiatives. The new funding will be used to expand market reach and enhance operational capabilities, reinforcing Maxwell’s position as a leader in ultracapacitor-based power solutions.
- In May 2025, CAP-XX secured a significant design win with a multinational conglomerate, resulting in the integration of its supercapacitors into a new headphone platform scheduled for launch in October 2025. This partnership highlights CAP-XX’s expanding influence in global supply chains for advanced energy storage solutions, particularly within the consumer electronics sector.
- In April 2025, Eaton Corporation completed the acquisition of Fibrebond Corporation for $1.4 billion. Fibrebond is recognized for its pre-integrated modular power enclosures serving data center, industrial, utility, and communications markets. This acquisition is expected to enhance Eaton’s ability to deliver rapid, engineered-to-order power infrastructure solutions, meeting the growing demand for reliable energy storage and management.
Market Concentration & Characteristics:
The Global Ultracapacitors Market is moderately concentrated, with a mix of established multinational corporations and emerging technology firms competing across key regions. It is characterized by a high level of technological innovation, with ongoing advancements in materials science, manufacturing processes, and energy storage integration. The market shows strong demand from sectors requiring rapid charge-discharge capabilities, such as automotive, renewable energy, industrial equipment, and consumer electronics. Barriers to entry include capital-intensive R&D, proprietary technologies, and performance validation standards. It demonstrates rapid adoption in developed economies and growing interest in emerging markets due to increasing electrification and infrastructure needs. Strategic collaborations, product customization, and geographic expansion remain critical to gaining market share.
Report Coverage:
The research report offers an in-depth analysis based on type, power range, and application. It details leading market players, providing an overview of their business, product offerings, investments, revenue streams, and key applications. Additionally, the report includes insights into the competitive environment, SWOT analysis, current market trends, as well as the primary drivers and constraints. Furthermore, it discusses various factors that have driven market expansion in recent years. The report also explores market dynamics, regulatory scenarios, and technological advancements that are shaping the industry. It assesses the impact of external factors and global economic changes on market growth. Lastly, it provides strategic recommendations for new entrants and established companies to navigate the complexities of the market.
Future Outlook:
- Demand for ultracapacitors will rise as electric vehicle adoption accelerates worldwide.
- Hybrid energy systems combining ultracapacitors with batteries will gain traction in industrial and renewable applications.
- Advancements in graphene and other nanomaterials will enhance energy density and scalability.
- Governments will expand incentives and policies to support ultracapacitor integration in clean energy infrastructure.
- Miniaturized ultracapacitors will enable growth in wearable tech, medical devices, and compact electronics.
- The Asia-Pacific region will strengthen its position as a global manufacturing hub for ultracapacitor components.
- Europe and North America will lead innovation through R&D investments and pilot projects.
- Emerging markets in Latin America, the Middle East, and Africa will see increasing deployment in off-grid and rural applications.
- Strategic partnerships and acquisitions will reshape the competitive landscape and accelerate commercialization.
- Rising energy storage needs across transportation, smart grids, and automation will expand the market’s long-term potential.


