Market Overview
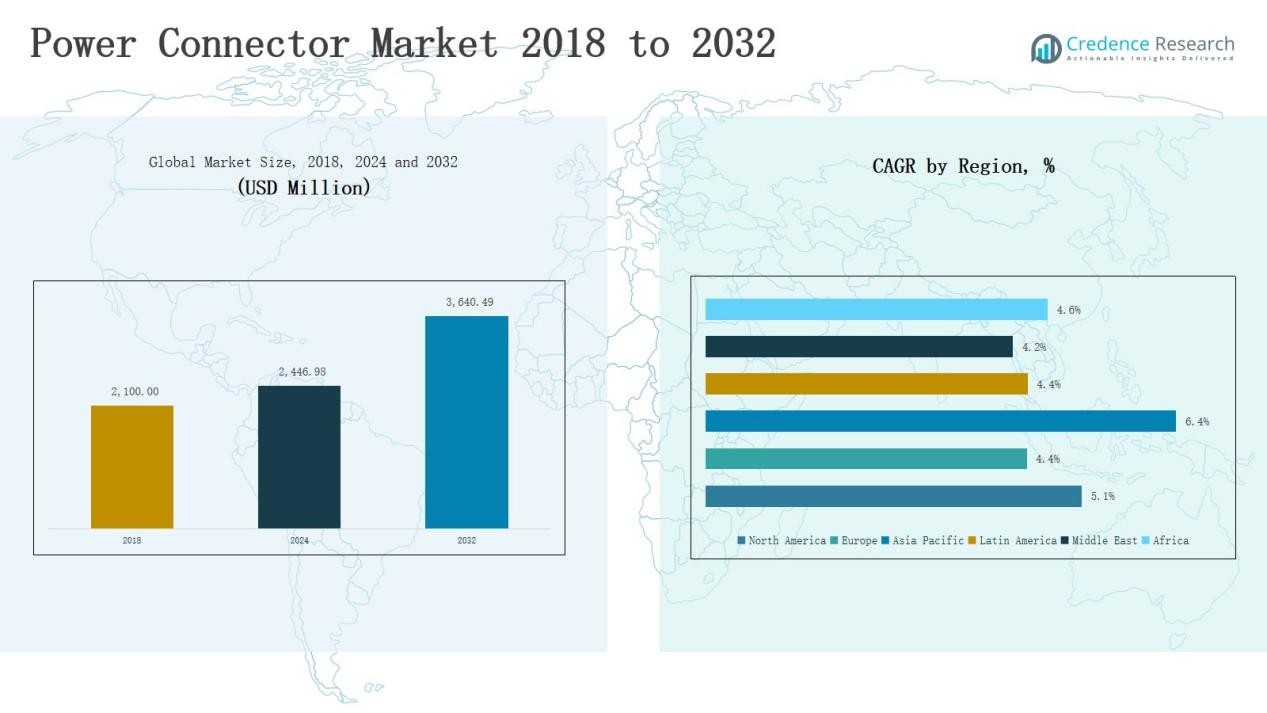
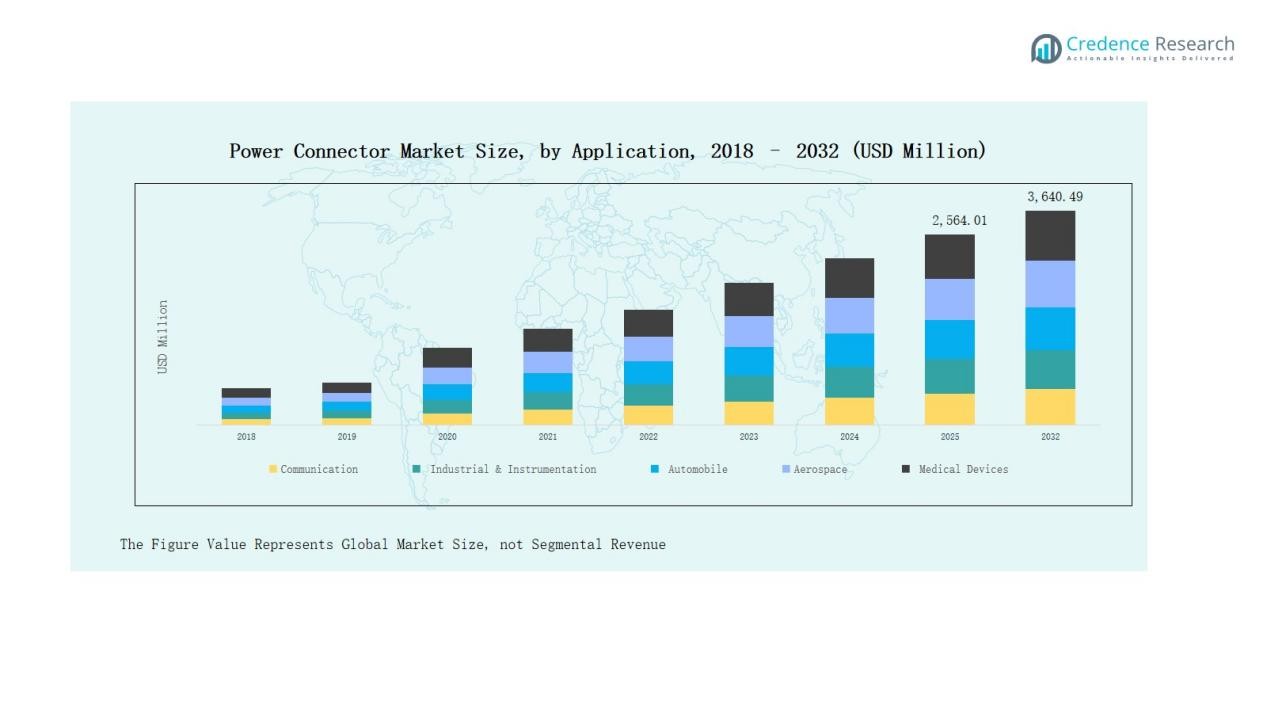
Power Connector Market size was valued at USD 2,100.00 million in 2018 to USD 2,446.98 million in 2024 and is anticipated to reach USD 3,640.49 million by 2032, at a CAGR of 5.14% during the forecast period.
| REPORT ATTRIBUTE |
DETAILS |
| Historical Period |
2020-2023 |
| Base Year |
2024 |
| Forecast Period |
2025-2032 |
| Power Connector Market Size 2024 |
USD 2,446.98 Million |
| Power Connector Market, CAGR |
5.14% |
| Power Connector Market Size 2032 |
USD 3,640.49 Million |
The Power Connector Market is shaped by leading companies such as Molex, TE Connectivity, Amphenol, Samtec, Foxconn, Hirose Electric, CLIFF Electronic Components, Igus, Harwin, Mouser Electronics, and NBC, each competing through product innovation, global distribution, and compliance with international standards. These players focus on delivering reliable solutions across industrial, automotive, communication, and medical applications, with strategies centered on miniaturization, durability, and safety compliance. Regionally, North America led the market in 2024 with a 34% share, driven by strong industrial automation, expanding data centers, and a well-established aerospace and automotive base supported by major manufacturers.
Access crucial information at unmatched prices!
Request your sample report today & start making informed decisions powered by Credence Research Inc.!
Download Sample
Market Insights
- The Power Connector Market grew from USD 2,100.00 million in 2018 to USD 2,446.98 million in 2024 and is projected to reach USD 3,640.49 million by 2032.
- The medium duty segment led with 46% share in 2024, followed by light duty at 32% and heavy duty at 22%, supported by industrial, telecom, and aerospace demand.
- By application, industrial and instrumentation dominated with 38%, while communication held 27%, automobiles 15%, aerospace 9%, medical devices 7%, and others 4%.
- By product type, IEC connectors led with 41%, US connectors followed at 25%, Schuko and AU/NZ held 15%, UK connectors 11%, and others 8%.
- Regionally, North America led with 34% in 2024, Europe followed with 23%, Asia Pacific with 22%, while Latin America, Middle East, and Africa held 7%, 6%, and 8% respectively.
Market Segment Insights
By Type
The medium duty segment accounted for the largest market share of 46% in 2024, driven by its extensive use across industrial machinery, telecom infrastructure, and consumer electronics. Light duty connectors held 32%, supported by growing demand in compact devices and medical equipment where low current transfer is critical. Heavy duty connectors captured 22%, primarily due to their role in aerospace, automotive, and energy sectors that require high durability and power handling capabilities. Increasing industrial automation and expanding telecom networks continue to strengthen the medium duty category’s dominance.
By Application
The industrial and instrumentation segment dominated with a 38% share in 2024, supported by the rising adoption of automation technologies and robust demand from factory equipment, sensors, and control systems. Communication followed with 27%, fueled by data center expansion and telecom upgrades. Automobile applications represented 15%, as electric vehicles and infotainment systems created demand for advanced connectors. Aerospace held 9%, while medical devices accounted for 7%, reflecting growing use in diagnostic and monitoring systems. The “others” category, with 4%, included niche uses across defense and consumer appliances.
- For instance, Molex partnered with Samtec to enhance next‑generation data center solutions with high‑speed cable assemblies aimed at communication and cloud infrastructure.
By Product Type
The IEC connector segment led the market with a 41% share in 2024, driven by wide adoption in consumer electronics, IT hardware, and power supplies due to its standardization and safety compliance. US connectors followed with 25%, supported by demand across North America’s electronics and appliance industry. Schuko and AU/NZ connectors collectively held 15%, mainly in Europe and Oceania. UK connectors represented 11%, while other regional designs captured the remaining 8%, reflecting diverse national standards. Growth in IEC connectors is fueled by their global compatibility and integration in high-volume consumer and industrial applications.
- For instance, Interpower launched its IEC 60320 rewirable Sheet E angled plug connector, approved by multiple safety agencies including Japan’s PSE, enhancing durability and compliance for appliance manufacturers worldwide.
Key Growth Drivers
Expanding Industrial Automation
The rapid adoption of industrial automation is a major driver of the power connector market. Automated production lines, robotics, and smart factories require reliable and durable connectors to ensure continuous power transfer and equipment uptime. Medium-duty and heavy-duty connectors are increasingly used in sensors, control systems, and industrial machinery. Rising investment in Industry 4.0 initiatives across manufacturing hubs in Asia-Pacific and Europe further accelerates this growth, as industries prioritize efficiency, predictive maintenance, and real-time monitoring.
- For instance, TE Connectivity launched its PowerTube connector system to support electrification and automation in heavy-duty industrial machinery, providing secure high-voltage connections for robotics and automated lines.
Rising Demand from Communication and Data Centers
Communication and data center infrastructure accounted for a strong demand push in the market. The global surge in internet usage, cloud computing, and 5G network deployment requires large-scale investments in servers, base stations, and networking hardware. These systems depend on power connectors that provide high reliability, low power loss, and scalable performance. With hyperscale data centers expanding rapidly in North America and Asia-Pacific, the demand for IEC and medium-duty connectors continues to rise, making this application segment one of the most promising.
- For instance, Microsoft announced plans to invest $2.1 billion over two years in expanding its hyperscale data center footprint in Spain, aimed at supporting cloud and AI workloads, significantly boosting demand for server power connectors.
Growth of Electric Vehicles and Automotive Electronics
The automotive sector is emerging as a critical driver, supported by rising adoption of electric vehicles (EVs) and advanced driver assistance systems (ADAS). Power connectors are vital for high-voltage battery systems, infotainment, and charging infrastructure. Automakers are shifting toward lightweight, compact, and heat-resistant connectors that ensure safety and efficiency. With EV sales accelerating in China, the U.S., and Europe, the automobile segment is forecast to record strong growth, pushing manufacturers to develop advanced connector designs tailored for high-performance mobility applications.
Key Trends & Opportunities
Standardization and Safety Compliance
One of the strongest trends in the power connector market is the push toward international standardization and safety compliance. IEC connectors dominate due to their universal compatibility and adherence to global safety norms. This trend presents opportunities for manufacturers to expand into multiple regions without redesigning products for specific markets. Demand for standardized connectors is also growing in the medical and aerospace industries, where regulatory compliance is stringent, thereby providing long-term growth potential.
- For instance, Schurter AG introduced its IEC 60320 C20 appliance inlet with V-Lock cord retention, designed to meet global safety standards for medical and industrial equipment.
Miniaturization and High-Density Designs
Miniaturization of electronic devices and rising demand for portable gadgets are fueling opportunities for high-density, compact connector solutions. Consumer electronics, wearables, and medical devices increasingly require connectors that handle power efficiently while occupying minimal space. This trend creates strong opportunities for light-duty connector manufacturers. Additionally, innovations in material science and design are enabling connectors with higher current capacity in smaller footprints, making miniaturization a critical opportunity for market expansion.
- For instance, TE Connectivity introduced its micro wire-to-board connector series designed for ultra-compact consumer devices, offering a 1.0 mm pitch and supporting up to 3 A current in medical wearables and IoT devices.
Key Challenges
High Cost of Advanced Connectors
The increasing complexity and technical demands of advanced connectors result in higher production costs. Heavy-duty connectors used in aerospace, defense, and automotive sectors require specialized materials, advanced design, and rigorous testing, which raises their overall cost. For small and medium enterprises, affordability becomes a barrier, limiting adoption in cost-sensitive markets. Price competition also pressures manufacturers to balance between performance and cost-effectiveness, posing a significant challenge to widespread deployment.
Compatibility and Regional Standards
Despite growing standardization, compatibility issues remain a significant challenge, especially in regions where unique power standards exist. Markets like Europe, the U.S., and Asia-Pacific follow different connector specifications, forcing manufacturers to produce varied product lines. This fragmentation increases operational costs and slows global expansion for suppliers. Inconsistent safety regulations and certification requirements also add complexity, creating barriers for companies aiming to scale across international markets with uniform solutions.
Supply Chain Disruptions and Raw Material Volatility
The power connector market is vulnerable to raw material price fluctuations, especially for metals such as copper and aluminum. Supply chain disruptions caused by geopolitical tensions, pandemics, or trade restrictions further exacerbate risks. Shortages in semiconductors and electronic components indirectly impact connector demand in automotive and communication industries. Manufacturers face difficulties in ensuring timely deliveries and maintaining stable pricing, making supply chain resilience and material sourcing critical challenges to overcome.
Regional Analysis
North America
North America led the global power connector market with revenues of USD 889.71 million in 2024, holding a 34% share. The market grew from USD 772.80 million in 2018 and is projected to reach USD 1,319.28 million by 2032, expanding at a CAGR of 5.1%. Growth is driven by strong demand from industrial automation, data centers, and aerospace applications. The U.S. remains the largest contributor, supported by advanced manufacturing infrastructure and the presence of leading connector manufacturers.
Europe
Europe accounted for 23% of the global market in 2024, with revenues of USD 589.17 million, up from USD 527.10 million in 2018. The region is expected to reach USD 825.49 million by 2032, growing at a CAGR of 4.4%. Germany, the UK, and France dominate demand, supported by robust automotive, renewable energy, and industrial sectors. Europe’s stringent safety standards and strong focus on eco-friendly technologies continue to drive adoption of advanced power connectors across industries.
Asia Pacific
Asia Pacific represented 22% of the global market in 2024, valued at USD 572.22 million, rising from USD 468.30 million in 2018. It is projected to reach USD 938.92 million by 2032, expanding at the fastest CAGR of 6.4%. Growth is fueled by large-scale electronics production, rapid expansion of communication networks, and accelerating electric vehicle adoption across China, Japan, South Korea, and India. Asia Pacific’s competitive manufacturing ecosystem and high consumer electronics exports strengthen its role as a critical growth hub.
Latin America
Latin America accounted for 7% of the market in 2024, with revenues of USD 191.57 million, up from USD 165.69 million in 2018. The market is projected to reach USD 268.56 million by 2032, growing at a CAGR of 4.4%. Brazil and Argentina lead demand, supported by growing automotive electronics, industrial applications, and telecom modernization. While adoption is slower compared to other regions, increasing infrastructure investment and gradual digital transformation provide opportunities for connector suppliers.
Middle East
The Middle East held a 6% share in 2024, valued at USD 118.91 million, increasing from USD 107.10 million in 2018. It is forecast to reach USD 164.21 million by 2032, expanding at a CAGR of 4.2%. Demand is driven by telecom expansion, defense programs, and industrial projects in GCC countries, Turkey, and Israel. Smart city initiatives and renewable energy investments further support adoption. However, geopolitical instability and regulatory fragmentation pose challenges to faster market penetration.
Africa
Africa represented the smallest share at 8% in 2024, generating USD 85.41 million, up from USD 59.01 million in 2018. The market is projected to reach USD 124.04 million by 2032, expanding at a CAGR of 4.6%. South Africa and Egypt dominate demand, supported by rising industrialization, energy infrastructure development, and communication upgrades. Electrification projects and renewable energy initiatives create growth potential, though limited local manufacturing and import dependency continue to restrict large-scale expansion in the region.
Market Segmentations:
By Type
- Light Duty
- Medium Duty
- Heavy Duty
By Application
- Communication
- Industrial & Instrumentation
- Automobile
- Aerospace
- Medical Devices
- Others
By Product Type
- IEC Connector
- US Connector
- AU/NZ Connector, Schuko
- UK Connector
- Others
By Region
- North America (U.S., Canada, Mexico)
- Europe (UK, France, Germany, Italy, Spain, Russia, Rest of Europe)
- Asia Pacific (China, Japan, South Korea, India, Australia, Southeast Asia, Rest of Asia Pacific)
- Latin America (Brazil, Argentina, Rest of Latin America)
- Middle East (GCC Countries, Israel, Turkey, Rest of Middle East)
- Africa (South Africa, Egypt, Rest of Africa)
Competitive Landscape
The power connector market is moderately fragmented, with global leaders and regional manufacturers competing on technology, product range, and pricing. Key players such as Molex, TE Connectivity, Amphenol, Samtec, Foxconn, and Hirose Electric dominate through strong distribution networks and broad portfolios spanning light, medium, and heavy-duty connectors. These companies emphasize product innovation, miniaturization, and compliance with international safety standards to meet rising demand in communication, automotive, industrial, and medical applications. Regional players, including CLIFF Electronic Components, Igus, Harwin, and NBC, focus on niche markets with customized solutions. Strategic partnerships, mergers, and acquisitions are common as firms expand into emerging economies with strong growth potential, particularly in Asia-Pacific. Investments in high-density, energy-efficient, and standardized connector designs remain central to strengthening market presence. Despite intense competition, differentiation is achieved through advanced design, material innovation, and value-added services, enabling leading companies to maintain a competitive edge while catering to evolving end-user needs.
Shape Your Report to Specific Countries or Regions & Enjoy 30% Off!
Key Players
- Molex
- Igus
- TE Connectivity
- CLIFF Electronic Components
- Mouser Electronics
- Amphenol
- Samtec
- Harwin
- Foxconn
- NBC
- Hirose Electric
Recent Developments
- On February 12, 2025, TE Connectivity declared it would acquire Richards Manufacturing Co. for about USD 2.3 billion in cash. This acquisition aims to boost TE’s position in the electrical utilities market.
- In August 12, 2025, Hubbell Inc. agreed to purchase DMC Power for USD 825 million in cash. The move enhances Hubbell’s offerings in high-voltage connector tech for substations and transmission systems.
- In September 2025, Nextracker introduced the NX PowerMerge DC power trunk connector, designed for eBOS installations to simplify assembly and enhance long-term reliability.
- In December 2024, Advanced Energy and Sager Electronics launched the 3×5 Program, a partnership to expedite the delivery of modular power supplies for design and testing applications.
Report Coverage
The research report offers an in-depth analysis based on Type, Application, Product Type and Region. It details leading market players, providing an overview of their business, product offerings, investments, revenue streams, and key applications. Additionally, the report includes insights into the competitive environment, SWOT analysis, current market trends, as well as the primary drivers and constraints. Furthermore, it discusses various factors that have driven market expansion in recent years. The report also explores market dynamics, regulatory scenarios, and technological advancements that are shaping the industry. It assesses the impact of external factors and global economic changes on market growth. Lastly, it provides strategic recommendations for new entrants and established companies to navigate the complexities of the market.
Future Outlook
- Demand for compact and high-density connectors will continue to rise with miniaturization of devices.
- Growth in electric vehicles will drive adoption of advanced automotive-grade power connectors.
- Data center expansion and 5G infrastructure will boost demand for reliable medium-duty connectors.
- Industrial automation and robotics will remain strong growth drivers for connector adoption.
- Standardization across regions will support global trade and reduce design complexity.
- Medical devices will increasingly rely on specialized connectors for precision and safety.
- Renewable energy projects will create opportunities for heavy-duty, durable connector solutions.
- Asia Pacific will strengthen its role as the leading manufacturing hub for connectors.
- Material innovations will enhance durability, heat resistance, and overall connector performance.
- Strategic partnerships and acquisitions will reshape the competitive landscape among leading players.


