
Backup Power Systems Market
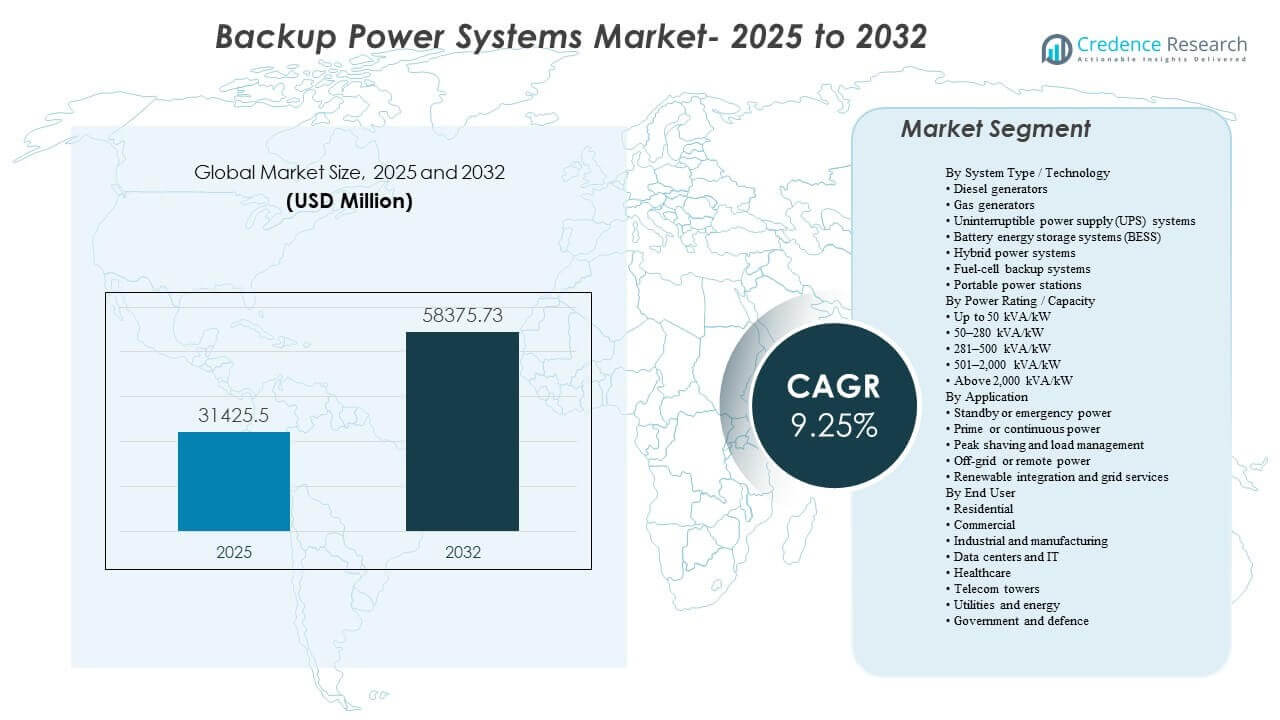
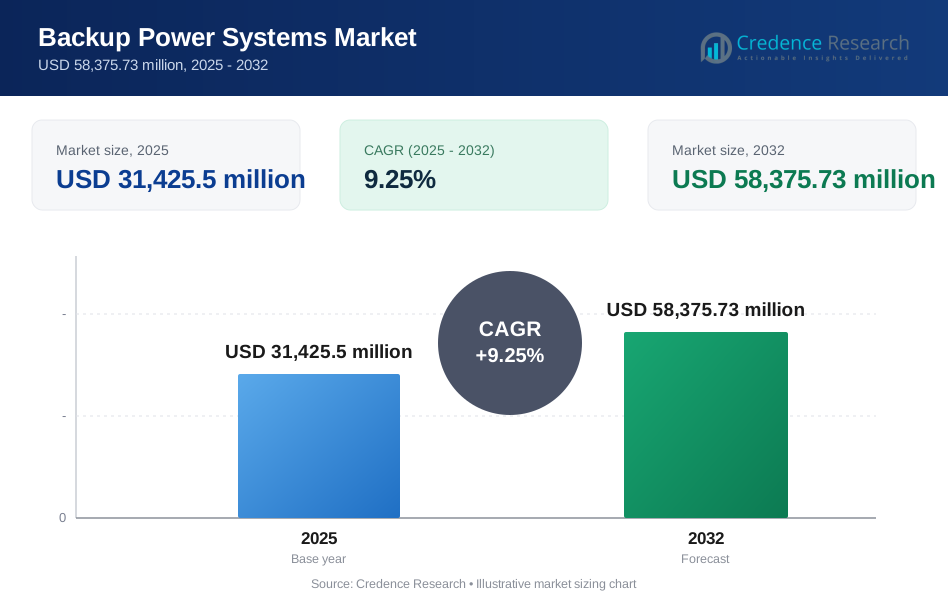
The global Backup Power Systems Market size was estimated at USD 31,425.5 million in 2025 and is expected to reach USD 58,375.73 million by 2032, growing at a CAGR of 9.25% from 2025 to 2032. Demand is being reinforced by higher uptime requirements across critical loads, where even short disruptions translate into operational losses, safety risks, and contractual penalties. Over the forecast period, investments are also supported by modernization of electrical infrastructure and the rising need for fast, reliable transfer solutions in commercial and industrial facilities, alongside expanding deployment of resilient power architectures across major regions.
| REPORT ATTRIBUTE | DETAILS |
|---|---|
| Historical Period | 2020-2024 |
| Base Year | 2025 |
| Forecast Period | 2026-2032 |
| Backup Power Systems Market Size 2025 | USD 31,425.5 million |
| Backup Power Systems Market, CAGR | 9.25% |
| Backup Power Systems Market Size 2032 | USD 58,375.73 million |
Key Market Trends & Insights
- Diesel generators accounted for the largest share of 9% in 2025, supported by mature supply chains, proven performance, and suitability for long-duration backup.
- Systems in the 501–2,000 kVA/kW band represented 6% share in 2025, reflecting common sizing needs for hospitals, campuses, and mid-scale mission-critical facilities.
- Standby/emergency power led application demand with a 8% share in 2025, driven by compliance requirements and business continuity programs.
- Industrial and manufacturing held 6% share in 2025, underpinned by high sensitivity to downtime in automated production environments.
- Asia Pacific captured 60% share in 2025, supported by rapid infrastructure expansion and higher backup penetration in fast-growing industrial and digital economies.
Segment Analysis
Backup power procurement is increasingly framed around resilience outcomes rather than equipment categories alone, especially for facilities with strict uptime targets and high outage costs. Buyers are prioritizing solutions that can deliver reliable transfer performance, predictable runtime, and simplified serviceability, which keeps incumbent technologies relevant while accelerating interest in integrated architectures. As monitoring and controls mature, backup systems are being specified with stronger requirements for remote diagnostics, automated testing, and fleet-level asset management to improve readiness and reduce maintenance risk.
At the same time, the market is steadily shifting toward hybridization, where systems combine multiple technologies to balance runtime, emissions, footprint, and response speed. UPS and battery-based systems are gaining traction in applications that need near-instantaneous ride-through and smoother load transitions, while engines continue to anchor long-duration backup requirements. These dynamics are strengthening demand for packaged solutions that combine power electronics, storage, controls, and service support, particularly in environments where compliance, space constraints, or noise limitations shape procurement decisions.
By System Type / Technology Insights
Diesel generators accounted for the largest share of 38.9% in 2025. They remain the default choice for long-duration backup and heavy-duty loads due to proven reliability, wide service availability, and established fuel logistics in most end markets. Diesel sets also integrate well into standardized standby architectures across industrial sites and critical facilities. While alternative solutions are expanding, diesel continues to dominate where runtime certainty, rapid deployment, and operational familiarity are decisive.
By Power Rating / Capacity Insights
The 501–2,000 kVA/kW segment accounted for the largest share of 30.6% in 2025. This band aligns with typical load profiles for healthcare facilities, commercial campuses, and mid-scale digital infrastructure that require robust backup without bespoke ultra-large engineering. Standardized configurations in this range support faster project execution, easier maintenance planning, and modular scalability. It also matches the market’s shift toward distributed critical loads across multiple sites rather than single mega-installations in many use cases.
By Application Insights
Standby or emergency power accounted for the largest share of 52.8% in 2025. Regulatory requirements, safety obligations, and business continuity policies make standby capability non-negotiable for many facilities, sustaining consistent demand across commercial and industrial categories. Buyers often specify standby systems with stringent reliability testing, fast transfer requirements, and service commitments to ensure readiness. These factors keep replacement demand steady and push upgrades toward systems with better monitoring, automation, and lifecycle support.
By End User Insights
Industrial and manufacturing accounted for the largest share of 22.6% in 2025. Downtime risks in automated production, process industries, and continuous operations elevate the value of dependable backup solutions and comprehensive service coverage. Facilities also require stable power quality to protect sensitive equipment and reduce restart losses, which strengthens demand for coordinated generator, UPS, and control configurations. As plants modernize and increase electrification, backup systems are being specified more strategically as part of operational resilience programs.
Backup Power Systems Market Drivers
Rising Critical-Load Density and Uptime Requirements
Mission-critical operations are expanding across sectors that cannot tolerate interruptions, including digital services, healthcare, and high-value manufacturing. Even brief outages can disrupt safety systems, invalidate processes, or cause data and equipment losses. This strengthens investment in standby architectures, redundancy, and faster transfer performance. Buyers also demand higher system readiness through automated testing, predictive maintenance, and service guarantees.
- For instance, Cummins states that its PowerCommand 550 remote monitoring system can monitor and control up to 12 on-site devices and allows operators to remotely start and stop generator and transfer-switch tests while sending power-system event alerts by email or text.
Grid Reliability Pressures and Extreme Weather Exposure
Grid disturbance risk is a central driver in many markets as weather volatility and load growth increase outage frequency and duration in certain regions. Organizations are treating backup power as risk mitigation to protect revenue continuity and service quality. This reinforces adoption in commercial buildings, industrial sites, and community infrastructure. It also supports demand for solutions that can be deployed quickly and maintained reliably.
- For instance, Caterpillar’s backup installation at the Piscataway Community Center uses two Cat G3512 gas generator sets in an N+1 configuration, and the system is designed to start and accept load within 10 seconds per NFPA 110, with EMCP 4.4 controllers managing paralleling and load-management sequences
Expansion of Digital Infrastructure and Distributed Power Needs
Digital infrastructure buildouts increase demand for layered power protection, from UPS ride-through to long-duration backup. Facilities are also becoming more distributed, requiring standardized, repeatable backup solutions that can scale across multiple sites. These shifts support modular architectures, better controls, and higher serviceability. Procurement increasingly emphasizes lifecycle performance, not just equipment purchase.
Technology Integration and Hybridization of Backup Architectures
The market is moving toward integrated solutions that combine engines, UPS, and storage with advanced control systems. Hybrid configurations can improve response speed, reduce fuel consumption in certain duty cycles, and support smoother load management. As control stacks mature, backup assets can be managed more intelligently across fleets and locations. This strengthens demand for vendors that offer both equipment breadth and strong software/service ecosystems.
Backup Power Systems Market Challenges
Supply-side volatility and project execution complexity can constrain timelines, particularly for large-capacity deployments that rely on specialized components and commissioning expertise. Lead times, installation constraints, and compliance requirements can add cost and coordination burden for buyers, especially in retrofits and space-constrained facilities. These factors increase the importance of experienced integrators and vendor support networks.
- For instance, Wärtsilä states that its Modular Block platform uses 34SG gas engines rated at approximately 6 MW to 10 MW each, and that a complete block can be assembled on site in around five weeks excluding foundation work, with only a relatively simple crane required for heavy lifting, which shows how modular design and experienced execution support can materially reduce installation complexity in constrained projects.
Emissions, noise, and permitting constraints remain key challenges, especially for engine-based systems in dense urban or regulated environments. Customers may need additional investments in aftertreatment, acoustic mitigation, fuel storage compliance, and monitoring to meet site requirements. This can raise total ownership costs and extend procurement cycles. As a result, buyers increasingly evaluate multi-technology alternatives and hybrid configurations to meet site constraints.
Backup Power Systems Market Trends and Opportunities
Hybrid power systems are emerging as a preferred configuration in applications that need both immediate response and extended runtime. Combining UPS, BESS, and engine backup can improve transfer performance, reduce transient risks, and provide more flexible operating modes. This creates opportunities for packaged solutions that simplify design and commissioning. Vendors that offer integrated controls and remote management are positioned to capture higher-value deployments.
- For instance, Aggreko’s fully integrated 500 kW/250 kWh BESS can run in island mode or as part of a hybrid solution with a generator, uses an ECO controller to monitor batteries and power electronics, supports overload capability of up to 10% of nominal value for up to 1 minute, and is backed by remote monitoring support.
Battery energy storage and advanced UPS platforms are gaining attention where fast ride-through, space efficiency, and lower noise are priorities. Beyond backup, organizations are exploring how storage can support load management strategies and operational optimization. This expands the addressable opportunity from pure backup into broader resilience and power quality programs. Solutions that combine service coverage with software-driven monitoring are likely to see rising adoption.
Regional Insights
North America
North America accounted for 27.10% share in 2025, supported by high backup penetration across commercial facilities and increasing investments in resilient power for critical infrastructure. Demand is reinforced by strong adoption of standby systems for business continuity and higher sensitivity to weather-related disruptions in several subregions. Procurement often emphasizes service coverage, rapid deployment, and dependable transfer performance. Upgrades also reflect stronger interest in modern UPS platforms and integrated monitoring.
Europe
Europe represented 22.80% share in 2025, shaped by modernization of electrical systems and stronger focus on compliant, space-efficient, and lower-noise backup solutions. Many buyers prioritize reliability, repeatability, and integration into facility management workflows. The region also shows steady replacement demand as older assets are upgraded for higher efficiency and better monitoring. Hybrid and battery-supported configurations are gaining relevance where site constraints and regulatory expectations are more stringent.
Asia Pacific
Asia Pacific led with 38.60% share in 2025, driven by rapid infrastructure buildouts, expanding industrial capacity, and rising deployment of digital services that require resilient power. Large-scale construction activity and growth in mission-critical facilities are supporting consistent demand for both engine-based and power-electronics-heavy architectures. In several markets, backup adoption is also reinforced by grid variability and the need for operational continuity. Regional scale and diversity continue to create strong opportunities for modular, standardized systems.
Latin America
Latin America accounted for 3.60% share in 2025, with demand concentrated in commercial hubs and industrial sites where outage risk and operational continuity requirements justify investment. The market is supported by infrastructure development and modernization of facility power systems. Buyers often prioritize cost-effective designs, ease of maintenance, and service availability. Growth opportunities remain tied to expansion of critical services and industrial resilience programs.
Middle East & Africa
Middle East & Africa contributed 7.90% share in 2025, supported by infrastructure investment, critical facility expansion, and higher reliance on backup solutions in specific submarkets. Large projects and mission-critical deployments favor robust, service-supported solutions that can operate reliably under challenging site conditions. The region also presents opportunities for packaged, scalable systems aligned with new developments in commercial and digital infrastructure. Service footprint and project execution capability remain key differentiators.
Competitive Landscape
Competition is characterized by a mix of global OEMs and power management specialists that differentiate through product breadth, reliability performance, integration capabilities, and service coverage. Vendors compete on total solution delivery, including controls, monitoring, installation support, and lifecycle services, rather than equipment pricing alone. Partnerships with integrators and facility operators are important for large deployments, especially in mission-critical environments. The ability to support hybrid architectures and standardized multi-site rollouts is increasingly shaping supplier selection.
Caterpillar Inc. remains a prominent supplier in high-reliability standby and prime power applications, supported by broad generator portfolios and strong global service coverage. The company’s positioning benefits from proven performance in heavy-duty duty cycles and the ability to support engineered systems for complex sites. Its ecosystem of dealers and service partners strengthens maintenance responsiveness and parts availability. This approach aligns with buyer priorities in industrial facilities and mission-critical installations where runtime certainty and serviceability are central.
The industry research and growth report includes detailed analyses of the competitive landscape of the market and information about key companies, including:
- Caterpillar Inc.
- Cummins Inc.
- Generac Holdings Inc.
- Generac Power Systems, Inc.
- Kohler Co.
- Eaton Corporation plc
- Schneider Electric SE
- Atlas Copco AB
- ABB Ltd.
- Vertiv Holdings Co.
- Mitsubishi Electric Corporation
- Mitsubishi Heavy Industries Ltd.
- Emerson Electric Co.
- CyberPower Systems, Inc.
Qualitative and quantitative analysis of companies has been conducted to help clients understand the wider business environment as well as the strengths and weaknesses of key industry players. Data is qualitatively analyzed to categorize companies as pure play, category-focused, industry-focused, and diversified; it is quantitatively analyzed to categorize companies as dominant, leading, strong, tentative, and weak.
Recent Developments
- In a January 2025 announcement, BLUETTI unveiled new backup power product lines at CES 2025, including the Apex 300 and the professional-grade EnergyPro 6K system. The company said these launches were designed to serve users ranging from entry-level homeowners seeking backup battery solutions to customers with more advanced home energy storage needs.
- In a July 2025 announcement, Eaton said it signed an agreement to acquire Resilient Power Systems Inc., a company that develops energy solutions based on solid-state transformer technology. Eaton said the acquisition would support future applications in battery energy storage and related power-distribution markets, helping expand its advanced backup and resilience offerings.
- In a September 2025 announcement, Jackery unveiled the HomePower 3600 Plus at RE+ 2025 as the lead product in its newly introduced Essential Home Backup lineup. The company also introduced additional models in the series, positioning them as flexible and more affordable automatic backup solutions for households facing grid instability and severe weather risks.
Report Scope
| Report Attribute | Details |
| Market size value in 2025 | USD 31,425.5 million |
| Revenue forecast in 2032 | USD 58,375.73 million |
| Growth rate (CAGR) | 9.25% (2025–2032) |
| Base year | 2025 |
| Forecast period | 2026–2032 |
| Quantitative units | USD million |
| Segments covered | By System Type / Technology Outlook; By Power Rating / Capacity Outlook; By Application Outlook; By End User Outlook |
| Regional scope | North America, Europe, Asia Pacific, Latin America, Middle East & Africa |
| Key companies profiled | Caterpillar Inc.; Cummins Inc.; Generac Holdings Inc.; Generac Power Systems, Inc.; Kohler Co.; Eaton Corporation plc; Schneider Electric SE; Atlas Copco AB; ABB Ltd.; Vertiv Holdings Co.; Mitsubishi Electric Corporation; Mitsubishi Heavy Industries Ltd.; Emerson Electric Co.; CyberPower Systems, Inc. |
| No. of Pages | 336 |
By Segmentation
By System Type / Technology
- Diesel generators
- Gas generators
- Uninterruptible power supply (UPS) systems
- Battery energy storage systems (BESS)
- Hybrid power systems
- Fuel-cell backup systems
- Portable power stations
By Power Rating / Capacity
- Up to 50 kVA/kW
- 50–280 kVA/kW
- 281–500 kVA/kW
- 501–2,000 kVA/kW
- Above 2,000 kVA/kW
By Application
- Standby or emergency power
- Prime or continuous power
- Peak shaving and load management
- Off-grid or remote power
- Renewable integration and grid services
By End User
- Residential
- Commercial
- Industrial and manufacturing
- Data centers and IT
- Healthcare
- Telecom towers
- Utilities and energy
- Government and defence
By Region
- North America
- U.S.
- Canada
- Mexico
- Europe
- Germany
- France
- U.K.
- Italy
- Spain
- Rest of Europe
- Asia Pacific
- China
- Japan
- India
- South Korea
- South-east Asia
- Rest of Asia Pacific
- Latin America
- Brazil
- Argentina
- Rest of Latin America
- Middle East & Africa
- GCC Countries
- South Africa
- Rest of the Middle East and Africa
Request a Free Sample
Fill in your details and we'll send you a free sample report.
- Sample data tables & charts
- Research methodology
Need a Custom Version of This Report?
Tailor the scope, geography, or segments to your exact requirements.
- Custom geography or segment scope
- Direct access to our analyst team
Frequently Asked Questions
What is the market size of the Backup Power Systems Market in 2025?
What is the expected market size by 2032?
What is the CAGR for 2025–2032?
Which system type leads the market in 2025?
Which application segment holds the largest share in 2025?
Which region leads the market in 2025 and what is its share?
Table of Content
Chapter 1. Report Introduction
- 1.1 Report Description & Purpose
- 1.1.1 Report Title & Market Definition
- 1.1.2 Unique Selling Propositions (USP) & Key Differentiators
- 1.1.3 Value Proposition for Stakeholders
- 1.2 Research Objectives
- 1.2.1 Market Sizing Objectives (Volume & Revenue)
- 1.2.2 Segmentation Objectives
- 1.2.3 Competitive Intelligence Objectives
- 1.2.4 Forecast & Scenario Objectives
- 1.3 Report Scope
- 1.3.1 Backup Power Systems Scope – Types & Subtypes Covered
- 1.3.2 Geographic Scope – Regions & Countries Covered
- 1.3.3 Historical Period, Base Year & Forecast Period (2025; forecast to 2032)
- 1.3.4 Inclusions & Exclusions
- 1.4 HS Code & Classification Framework
- 1.5 Currency, Units & Pricing Basis
- 1.6 Target Stakeholders
- 1.7 Limitations & Assumptions
Chapter 2. Executive Summary
- 2.1 Global Backup Power Systems Market Snapshot
- 2.1.1 Market Size – Historical (2025) & Forecast (2025-2032) (2025: USD 31,425.5 million → 2032: USD 58,375.73 million)
- 2.1.2 Volume & Revenue – Global Totals
- 2.1.3 Key Market Highlights – Top Five Facts
- 2.2 Backup Power Systems Market Segmentation Snapshot
- 2.2.1 Market Split by Region – 2025 vs. 2032
- 2.3 Competitive Snapshot
- 2.3.1 Top 10 Players by Revenue Share – 2025
- 2.3.2 Top 10 Players by Volume Share – 2025
- 2.3.3 Recent Strategic Developments (18-Month Summary)
- 2.4 Key Investment Highlights & Strategic Conclusions
Chapter 3. Backup Power Systems Market Dynamics & Industry Analysis
- 3.1 Market Overview & Context
- 3.1.1 Backup Power Systems Market Position in the Broader Automotive Value Chain
- 3.1.2 OEM vs. Replacement Market Dynamics
- 3.1.3 Market Maturity & Development Stage by Region
- 3.2 Backup Power Systems Market Drivers
- 3.3 Backup Power Systems Market Restraints & Challenges
- 3.4 Backup Power Systems Market Opportunities
- 3.5 Porter's Five Forces Analysis
- 3.5.1 Threat of New Entrants
- 3.5.2 Bargaining Power of Suppliers
- 3.5.3 Bargaining Power of Buyers
- 3.5.4 Threat of Substitutes
- 3.5.5 Competitive Rivalry – Intensity Assessment
- 3.6 Backup Power Systems Value Chain Analysis
- 3.6.1 Upstream – Raw Material/Input Suppliers
- 3.6.1.1 Raw Material/Input 1
- 3.6.1.2 Raw Material/Input 2
- 3.6.1.3 Raw Material/Input 3
- 3.6.2 Midstream – Production/Manufacturing/Service Delivery
- 3.6.2.1 Production/Process Overview
- 3.6.2.2 Key Facility Locations & Capacity by Manufacturer
- 3.6.3 Downstream – Distribution & End Consumer
- 3.6.3.1 Primary Channel – B2B/OEM
- 3.6.3.2 Secondary Channels – Dealer, Retail, Online, Direct
- 3.6.4 Value Chain Profitability Analysis
- 3.6.1 Upstream – Raw Material/Input Suppliers
- 3.7 PESTEL Analysis
- 3.7.1 Political Factors
- 3.7.2 Economic Factors
- 3.7.3 Social Factors
- 3.7.4 Technological Factors
- 3.7.5 Environmental Factors
- 3.7.6 Legal Factors
- 3.8 Backup Power Systems Supply Chain Analysis
- 3.8.1 Raw Material/Input Supply Risk Assessment
- 3.8.2 Manufacturing Concentration Risk (Geographic Exposure)
- 3.8.3 Trade Disruption Impact Analysis
- 3.9 Regulatory & Policy Landscape
Note: The regulatory and policy landscape section covers regulations based on their applicability to the market, Backup Power Systems category, geography, and scope of the study. Only regulatory frameworks with a material impact on operations, compliance, trade, sustainability, or market access are analyzed in detail.
Chapter 4. Key Investment Pockets & Opportunity Analysis
- 4.1 Backup Power Systems Market Attractiveness Analysis
- 4.1.1 By Region – Investment Attractiveness Matrix (Volume × CAGR)
- 4.2 Absolute Revenue Growth Opportunity
- 4.2.1 By Region – Absolute USD Growth Through 2032
- 4.3 Incremental Volume Opportunity
- 4.3.1 By Region – Incremental Volume Through 2032
- 4.3.2 Segment – Incremental Volume
- 4.4 Emerging Submarket Opportunity Deep Dive (Subject to Applicability)
- 4.5 Emerging Market Opportunity Scorecards
- 4.5.1 United States
- 4.5.2 Europe
- 4.5.3 Asia
- 4.5.4 Middle East & Africa
Note: Emerging Market Opportunity Scorecards will be included based on relevance and strategic importance. Regions listed are indicative and may vary depending on data availability and market dynamics.
Chapter 5. Backup Power Systems Import-Export Analysis & Trade Flows
- 5.1 Global Trade Overview
- 5.1.1 Global Export Value by Country (2025)
- 5.1.2 Global Export Volume by Country (2025)
- 5.1.3 Global Import Value by Country (2025)
- 5.1.4 Global Import Volume by Country (2025)
- 5.1.5 Net Trade Balance by Country (2025)
- 5.2 Export Analysis – Segment
- 5.2.1 Type 1 (HS Code)
- 5.2.2 Type 2 (HS Code)
- 5.2.3 Type 3 (HS Code)
- 5.2.4 Type 4 (HS Code)
- 5.2.5 Type 5 (HS Code)
- 5.3 Import Analysis – Segment
- 5.3.1 Type 1 (HS Code)
- 5.3.2 Type 2 (HS Code)
- 5.3.3 Type 3 (HS Code)
- 5.3.4 Type 4 (HS Code)
- 5.3.5 Type 5 (HS Code)
- 5.4 Average Unit Trade Prices
- 5.4.1 Average Export Price – Segment & Country
- 5.4.2 Average Import Price – Segment & Source Country
- 5.4.3 Price Trends (2025)
- 5.5 Key Trade Route Analysis
- 5.5.1 Trade Route 1
- 5.5.2 Trade Route 2
- 5.5.3 Trade Route 3
- 5.5.4 Trade Route 4
- 5.5.5 Trade Route 5
- 5.6 Trade Policy Impact Assessment
- 5.6.1 US Anti-Dumping & Section 301 Tariffs
- 5.6.2 EU Customs Union Impact
- 5.6.3 Major Free Trade Agreements
- 5.6.4 USMCA Rules of Origin
Note: Trade policy analysis will be included only where relevant to the Backup Power Systems market.
Chapter 6. Competitive Landscape & Company Benchmarking
- 6.1 Backup Power Systems Market Concentration & Structure
- 6.1.1 Herfindahl-Hirschman Index (HHI) – vs. 2025
- 6.1.2 Tier 1, Tier 2 & Tier 3 Market Structure
- 6.1.3 Global, Regional & Local Player Dynamics
- 6.2 Backup Power Systems Market Share Analysis – 2025
- 6.2.1 Global Revenue Share by Company
- 6.2.2 Global Volume Share by Company
- 6.2.3 Regional Revenue Share
- 6.2.4 Market Share Evolution ( vs. 2025)
- 6.2.5 OEM Segment Share by Company
- 6.2.6 Replacement Segment Share by Company
- 6.3 Production/Delivery Capacity & Facility Analysis
- 6.3.1 Global Installed Capacity
- 6.3.2 Capacity Utilization Rates
- 6.3.3 Production/Output Volume
- 6.3.4 Facility Locations & Capacity Map
- 6.3.5 Planned Capacity Additions
- 6.4 Backup Power Systems Competitive Benchmarking Matrix
- 6.4.1 Revenue, Volume, CAGR & Profitability Comparison
- 6.4.2 Channel Revenue Mix
- 6.4.3 Geographic Revenue Exposure
- 6.4.4 R&D Intensity
- 6.4.5 Sustainability Maturity
- 6.5 Strategic Developments in Backup Power Systems (Last 24 Months)
- 6.5.1 Mergers, Acquisitions & Divestments
- 6.5.2 New Backup Power Systems Launches
- 6.5.3 Facility Expansions
- 6.5.4 Strategic Alliances, Joint Ventures & Partnerships
- 6.5.5 Distribution Expansion & Market Entry
- 6.5.6 Sustainability & ESG Initiatives
- 6.6 Competitive Strategy Mapping
- 6.6.1 Leader, Challenger, Follower & Niche Classification
- 6.6.2 Pricing Strategy Comparison
- 6.6.3 Channel Strategy Matrix
Note: Strategic developments are included based on their materiality and the availability of reliable information.
Chapter 7. Global Backup Power Systems Market – By Distribution Channel
- 7.1 Segment Overview
- 7.1.1 Volume & Revenue Split by Channel (2025 & 2032)
- 7.1.2 Channel Mix Evolution (2025-2032)
Chapter 8. Regional Market Analysis – Global Overview
- 8.1 Global Regional Overview
- 8.1.1 Regional Volume Share
- 8.1.2 Regional Revenue Share
- 8.1.3 Regional Volume by Region
- 8.1.4 Regional Revenue by Region
- 8.1.5 Regional Forecast Through 2032
- 8.2 Cross-Regional Segment Analysis
- 8.2.1 By Distribution Channel
- 8.2.2 By Brand/Price Tier
Chapter 9. North America Backup Power Systems Market
- 9.1 United States
- 9.2 Canada
- 9.3 Mexico
Chapter 10. Europe Backup Power Systems Market
- 10.1 Germany
- 10.2 France
- 10.3 Italy
- 10.4 United Kingdom
- 10.5 Spain
- 10.6 Poland
- 10.7 Russia
- 10.8 Netherlands
- 10.9 Belgium
- 10.10 Sweden
- 10.11 Denmark
- 10.12 Norway
- 10.13 Rest of Europe
Chapter 11. Asia Pacific Backup Power Systems Market
- 11.1 China
- 11.2 India
- 11.3 Japan
- 11.4 South Korea
- 11.5 Thailand
- 11.6 Indonesia
- 11.7 Vietnam
- 11.8 Malaysia
- 11.9 Australia
- 11.10 Rest of Asia Pacific
Chapter 12. Latin America Backup Power Systems Market
- 12.1 Brazil
- 12.2 Argentina
- 12.3 Colombia
- 12.4 Chile
- 12.5 Rest of Latin America
Chapter 13. Middle East Backup Power Systems Market
- 13.1 Saudi Arabia
- 13.2 United Arab Emirates
- 13.3 Turkey
- 13.4 Israel
- 13.5 Iran
- 13.6 Rest of the Middle East
Chapter 14. Africa Backup Power Systems Market
- 14.1 South Africa
- 14.2 Egypt
- 14.3 Nigeria
- 14.4 Morocco
- 14.5 Rest of Africa
Chapter 15. Backup Power Systems Company Profiles
- 15.1 [Company 01]
- 15.1.1 Company Overview
- 15.1.2 Key Management Personnel
- 15.1.3 Products & Services Portfolio
- 15.1.4 Financial Performance
- 15.1.5 Key Market Focus & Geographic Presence
- 15.1.6 Recent Developments & Strategic Initiatives
Note: The company profile list is preliminary and may change based on research findings, market developments, data availability, and client requirements.
Chapter 16. Appendices
- Appendix A – List of Abbreviations & Acronyms
- Appendix B – Industry Classification Code Reference – Full Series
- Appendix C – Production & Capacity Data Tables
- Appendix D – End-Use & Demand Base Tables
- Appendix E – Consumption & Replacement Rate Assumptions
- Appendix F – ASP Reference Tables
- Appendix G – Manufacturing & Facility Database
- Appendix H – Import-Export Data Tables
- Appendix I – Regulatory Summary Tables
- Appendix J – Primary Research Participant List (Anonymized)
- Appendix K – Primary Research Questionnaire Framework
- Appendix L – Data Sources & Bibliography
- Appendix M – Market Size Divergence & Source Comparison
Chapter 17. Research Methodology
- 17.1 Research Framework & Philosophy
- 17.2 Secondary Research – Sources, Hierarchy & Data Extraction
- 17.3 Data Modeling – Bottom-Up & Top-Down Market Sizing
- 17.4 Primary Research – Stakeholder Framework, LOI & Sample Sizes
- 17.5 Forecast Methodology – Regression, Scenario & Sensitivity Analysis
- 17.6 Quality Control – Four-Layer Validation Framework
- 17.7 Limitations & Standard Assumptions
- 17.8 Disclaimer
