Home » Packaging » Thin Wall Packaging Market

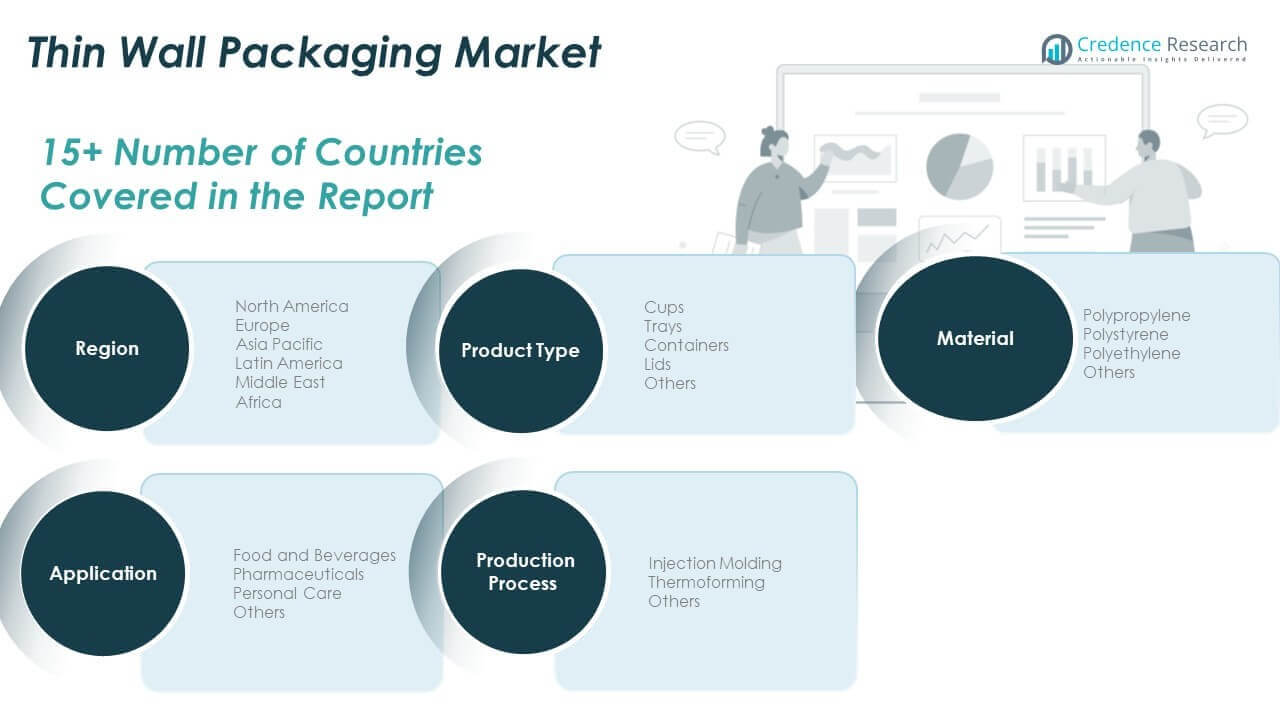
Thin Wall Packaging Market By Material (Polypropylene [PP], Polyethylene [PE], Polystyrene [PS], Polyethylene Terephthalate [PET], Others); By Product Type (Boxes, Tubs, Jars, Cups, Trays, Bowls, Lids); By Production Process (Injection Molding, Thermoforming, Others); By Application (Food & Beverages, Electronics, Cosmetics, Others) – Growth, Share, Opportunities & Competitive Analysis, 2024 – 2032

Report ID: 11245 | Report Format : Excel, PDF

Market Overview:

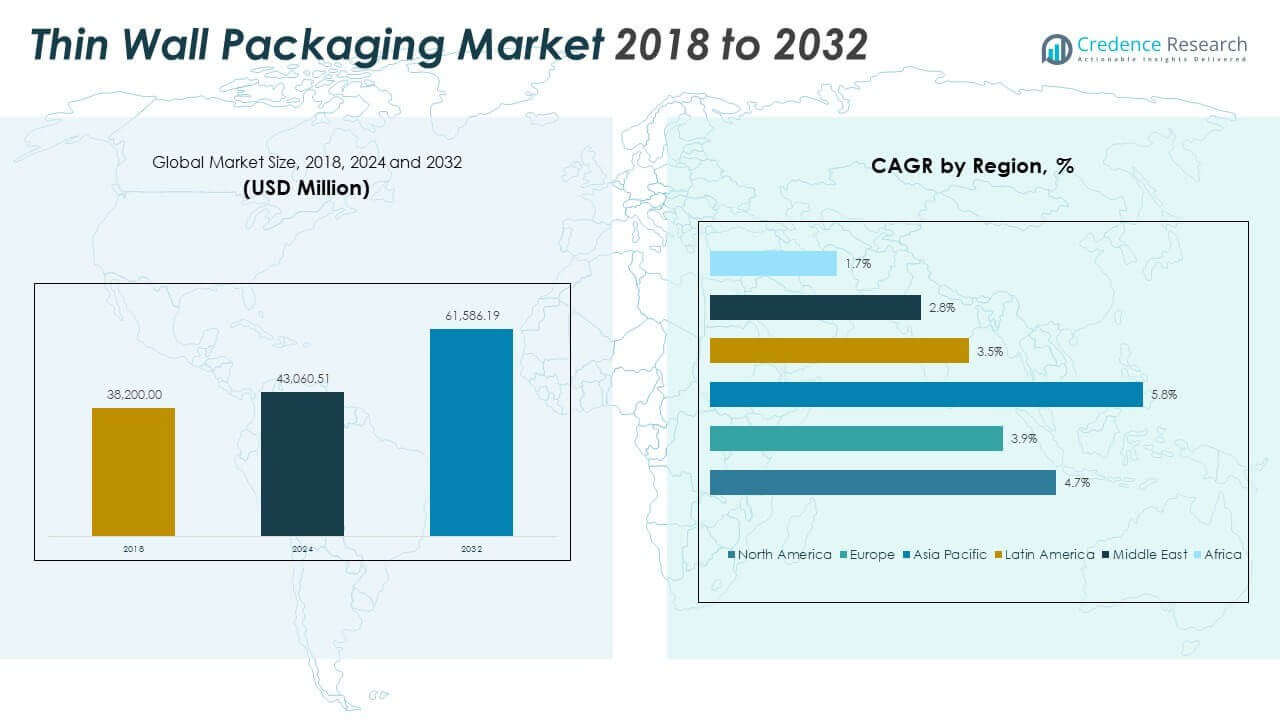
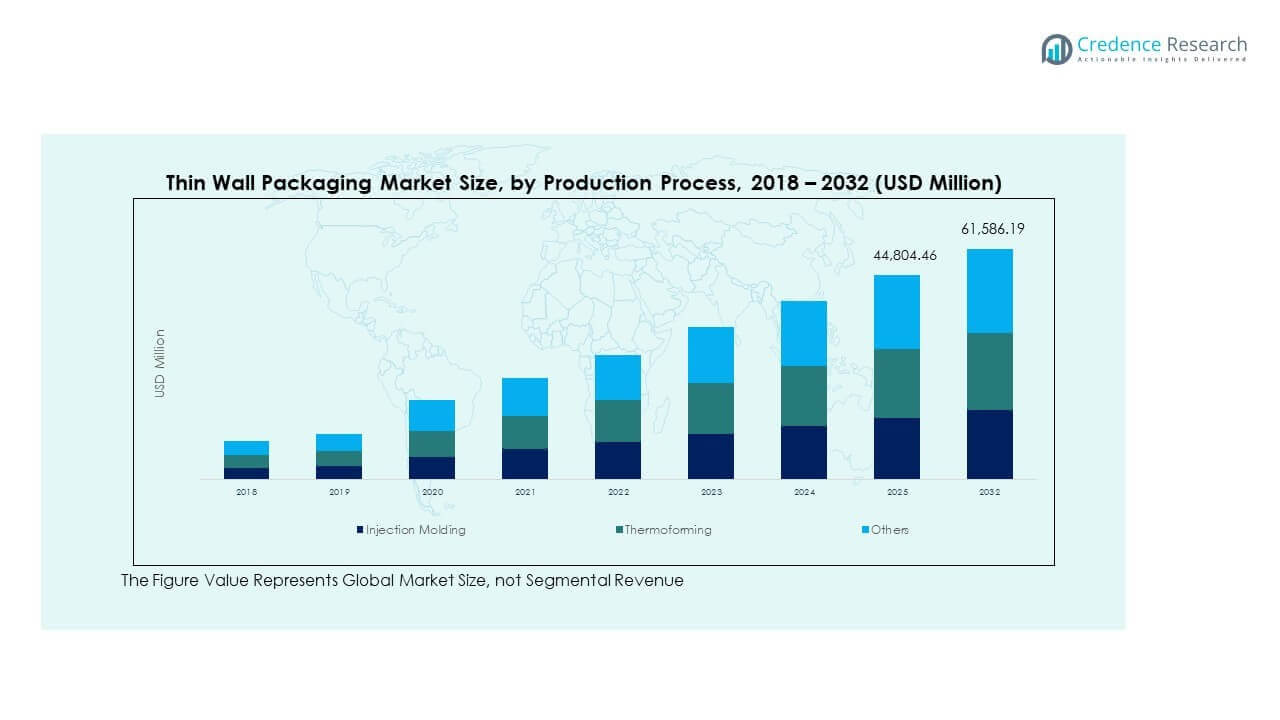
The Thin Wall Packaging Market is projected to grow from USD 41,282.76 million in 2024 to an estimated USD 70,524.33 million by 2032, with a compound annual growth rate (CAGR) of 6.1% from 2024 to 2032.

REPORT ATTRIBUTE DETAILS
Historical Period 2020-2023
Base Year 2024
Forecast Period 2025-2032
Thin Wall Packaging Market Size 2024 USD 41,282.76 million
Thin Wall Packaging Market, CAGR 6.1%
Thin Wall Packaging Market Size 2032 USD 70,524.33 million


The thin wall packaging market benefits from several key growth drivers. First, the rising demand for convenience foods and beverages, especially in urban areas, has propelled the adoption of thin wall packaging due to its durability, ease of handling, and lightweight nature. The growing emphasis on sustainability and reducing plastic waste also drives the market, as manufacturers turn to recyclable and biodegradable materials for packaging. Furthermore, advances in injection molding and other production technologies have improved the efficiency and quality of thin wall packaging, making it more appealing to industries seeking cost-effective solutions. With consumers demanding more environmentally friendly and user-friendly packaging solutions, companies are increasingly investing in R&D to innovate new materials and designs that support this trend, contributing significantly to market growth.

Regionally, the thin wall packaging market shows strong growth in Asia-Pacific, which leads due to the high population density, rapid urbanization, and expanding food and beverage sector. China and India are key contributors in this region, driven by an increasing demand for packaged foods and rising disposable incomes. Europe follows, with a focus on sustainable packaging solutions that align with stringent regulations on plastic usage, particularly in countries like Germany, France, and the UK. North America also demonstrates steady growth due to technological advancements in packaging and high demand from the food and beverage industry. In Latin America and the Middle East & Africa, the market is gradually expanding, propelled by emerging economies and changing consumer preferences, marking a global trend toward sustainability and convenience in packaging.

Access crucial information at unmatched prices!

Request your sample report today & start making informed decisions powered by Credence Research Inc.!

Download Sample

Market Drivers:

Growing Demand for Sustainable Packaging:

The shift towards sustainable and environmentally friendly packaging solutions is a major driver of the thin wall packaging market. Governments and regulatory bodies across the globe are imposing stringent regulations on single-use plastics, pushing manufacturers to adopt recyclable and biodegradable alternatives. For instance, companies like Unilever and Nestlé have committed to making 100% of their packaging recyclable or reusable by 2025. Thin wall packaging is gaining traction due to its lightweight and recyclable nature, which reduces plastic consumption and aligns with sustainability goals. As consumers become more environmentally conscious, companies are adapting by offering eco-friendly packaging options, further driving the demand for thin wall packaging solutions that meet both regulatory standards and consumer expectations.

Rising Popularity of Convenience Foods:

The increasing preference for convenience foods, particularly in urban areas, is significantly boosting the thin wall packaging market. As more people seek quick, ready-to-eat meals due to busy lifestyles, demand for lightweight, durable, and easily transportable packaging options has risen. Thin wall packaging offers a practical solution by providing secure and efficient packaging for various food products, from ready-made meals to dairy products. Its stackable design and durability make it ideal for both on-the-go consumers and retail distribution, enhancing product shelf life while maintaining quality. This trend is further supported by the rapid expansion of supermarkets, hypermarkets, and e-commerce platforms, which rely on efficient packaging for food safety and preservation.

Technological Advancements in Packaging Solutions:

Technological innovation in packaging is another significant factor propelling the thin wall packaging market. The adoption of advanced manufacturing techniques, such as injection molding, has improved the efficiency and quality of thin wall packaging. These technologies allow for faster production cycles, reducing costs and enabling large-scale production, which appeals to businesses seeking economical packaging solutions. Additionally, developments in material science have introduced high-performance polymers that enhance the durability and recyclability of thin wall packaging, creating lighter and stronger packaging that meets diverse consumer needs. For instance, ITC Packaging has developed a single-step injection molding technology for thin-wall PET containers, reducing wall thickness by 15% and optimizing raw material use. As technology continues to advance, it allows manufacturers to develop innovative packaging designs that are both functional and eco-friendly, catering to evolving market demands.

Shift Toward Customization and Product Differentiation:

Another driving force behind the growth of the thin wall packaging market is the demand for customized packaging solutions. As brands seek ways to stand out on store shelves and in e-commerce, there is a growing need for unique, customized packaging designs that offer a memorable unboxing experience for consumers. Thin wall packaging, with its versatility in design, printing, and coloring, allows brands to differentiate their products effectively. This trend is especially strong in sectors such as food and beverages, cosmetics, and personal care, where packaging plays a crucial role in product appeal and consumer decision-making. The ability to customize shapes, colors, and labeling enables brands to reinforce their identity and attract a broader audience, boosting the thin wall packaging market’s growth as companies continue to innovate and appeal to consumers’ desire for personalized experiences.

Market Trends:

Increasing Adoption of Recyclable and Biodegradable Materials:

A notable trend in the thin wall packaging market is the growing adoption of recyclable and biodegradable materials. With consumer preference shifting towards eco-friendly options, manufacturers are increasingly exploring materials such as compostable bioplastics and paper-based alternatives for thin wall packaging. According to recent industry reports, the demand for biodegradable thin wall packaging is expected to grow in the next five years. This trend is especially strong in the European and North American markets, where stringent regulations and high environmental awareness are driving companies to invest in sustainable packaging innovations. As new materials enter the market, thin wall packaging continues to evolve to meet these sustainability goals while maintaining durability and functionality.

Expansion of Thin Wall Packaging in the Non-Food Sector:

While traditionally associated with the food and beverage industry, thin wall packaging is now expanding into non-food sectors, including pharmaceuticals, personal care, and household products. As companies in these industries seek lightweight and durable packaging solutions, thin wall packaging is increasingly recognized for its efficiency and design versatility. For example, SABIC has developed thin wall packaging solutions for personal care and household products. Thin wall packaging’s appeal stems from its ability to preserve product integrity, extend shelf life, and provide aesthetic appeal, meeting the diverse requirements of non-food industries and broadening the market’s scope.

Rising Focus on Light weighting and Cost Reduction:

Another significant trend in the thin wall packaging market is the push towards lightweighting, driven by the need for cost-effective and resource-efficient solutions. Manufacturers are prioritizing thinner and lighter packaging without compromising product protection, thereby reducing material usage and production costs. Recent innovations in injection molding and material engineering have enabled the production of ultra-thin packaging that maintains high performance and structural integrity. For instance, Cosmo Films has developed thin wall containers that reduce material usage and transportation costs. Lightweight packaging solutions also align with the goal of reducing transportation costs and carbon emissions, as lighter loads lead to fuel savings in distribution. As more brands look to optimize their supply chains and reduce costs, lightweight thin wall packaging is becoming a preferred choice, adding momentum to this trend.

Growth in Demand for Customized Packaging Solutions:

The demand for customized and visually appealing packaging is steadily rising, influencing trends in the thin wall packaging market. Companies are focusing on creating unique packaging designs that enhance brand identity and consumer experience. Customization options, such as digital printing and embossing, are becoming more accessible and affordable, allowing brands to create packaging that reflects their brand values and engages consumers more effectively. The personalized packaging trend is expected to witness growth over the next few years, driven by consumer demand for unique, memorable products and unboxing experiences. This trend is particularly prominent in the food, personal care, and retail sectors, where brand differentiation through packaging has become an essential marketing tool.

Market Restraints and Challenges:

High Raw Material Costs:

One of the primary restraints in the thin wall packaging market is the fluctuating cost of raw materials, particularly polymers and resins used in plastic production. Prices for these materials are closely tied to crude oil, making the industry vulnerable to price volatility. High costs of raw materials increase the overall production costs, limiting manufacturers’ profit margins and, in some cases, making thin wall packaging less competitive compared to other packaging options. For companies focusing on cost efficiency, this poses a significant challenge in scaling up production without passing on costs to end consumers.

Stringent Environmental Regulations:

Strict environmental regulations surrounding plastic usage and disposal are another key challenge for the thin wall packaging market. As governments and regulatory bodies globally implement bans and restrictions on single-use plastics, companies in the thin wall packaging sector must invest in sustainable alternatives or risk non-compliance. This transition often requires significant R&D investment and restructuring of production processes, which can be costly and time-consuming. For smaller companies, meeting regulatory requirements while maintaining profitability can be particularly challenging, posing a barrier to market entry and growth.

Limited Recycling Infrastructure:

The lack of adequate recycling infrastructure in several regions hampers the growth of the thin wall packaging market. While recyclable thin wall packaging options exist, limited recycling facilities mean that a significant portion of this packaging ends up in landfills. In developing regions, where waste management systems are often underdeveloped, this issue is especially pronounced, impacting the market’s sustainability objectives and reputation. Without improvements in global recycling infrastructure, the market faces obstacles in achieving widespread adoption of environmentally friendly thin wall packaging solutions.

Intense Competition and Substitution Threat:

The thin wall packaging market faces intense competition from alternative packaging solutions, such as flexible packaging and rigid containers, which are often preferred for specific applications. Additionally, advancements in alternative materials like glass, metal, and bio-based plastics provide further substitution options. This competition requires thin wall packaging manufacturers to continuously innovate to retain market share, adding pressure on resources and increasing the cost of staying competitive in a crowded market.

Market Segmentation Analysis:

By material type plays a key role in determining product properties and application suitability. Polypropylene (PP) dominates the market due to its lightweight, cost-effective, and recyclable qualities, making it ideal for food and beverage packaging. Polyethylene (PE) is also popular for its durability and flexibility, while Polystyrene (PS) and Polyethylene Terephthalate (PET) are valued for their clarity and rigidity, especially in products requiring visibility. Other materials, including biodegradable options, are gaining traction as sustainability becomes a greater focus for manufacturers and consumers.

By product type, the market encompasses boxes, tubs, jars, cups, trays, bowls, and lids. Tubs, cups, and trays represent significant portions of this segment, particularly for food packaging, where they serve as convenient, stackable options for both fresh and processed foods. Boxes and lids are also widely used in the food service sector and increasingly in personal care and cosmetics due to their protective and aesthetic qualities.

By application, the food and beverages sector is the largest market, driven by demand for lightweight, hygienic packaging. Other segments like electronics and cosmetics are expanding as they adopt thin wall packaging for protection and consumer appeal, reflecting the versatility and growing adoption of these materials across industries.

Segmentation:

By Material

  • Polypropylene (PP)
  • Polyethylene Terephthalate (PET)
  • Polystyrene (PS)
  • Polyethylene (PE)
  • Polyvinyl Chloride (PVC)
  • Others

By Product Type

  • Tubs
  • Cups
  • Jars
  • Trays
  • Pots
  • Others

By Application 

  • Food & Beverages
  • Pharmaceutical
  • Cosmetics
  • Others

By Region

  • North America
    • U.S.
    • Canada
    • Mexico
  • Europe
    • Germany
    • France
    • U.K.
    • Italy
    • Spain
    • Rest of Europe
  • Asia Pacific
    • China
    • Japan
    • India
    • South Korea
    • South-east Asia
    • Rest of Asia Pacific
  • Latin America
    • Brazil
    • Argentina
    • Rest of Latin America
  • Middle East & Africa
    • GCC Countries
    • South Africa
    • Rest of the Middle East and Africa

Regional Analysis:

The thin wall packaging market exhibits notable growth across various regions, each driven by unique factors such as population density, industry demands, and regulatory conditions. The primary regions analyzed include Asia-Pacific, North America, Europe, Latin America, and the Middle East & Africa, each contributing to the overall market dynamics with different levels of demand and growth potential.

Asia-Pacific holds the largest share of the thin wall packaging market, accounting for around 35% of the global market share. The region’s dominance is primarily attributed to its high population density, rapid urbanization, and expanding food and beverage industry, particularly in countries like China, India, and Japan. The demand for packaged food has surged with rising disposable incomes and changing lifestyles, pushing manufacturers to adopt thin wall packaging solutions that cater to these needs. Additionally, Asia-Pacific’s robust manufacturing base and advancements in packaging technology support the production and adoption of thin wall packaging, especially for cost-sensitive markets.

Europe represents the second-largest market, with a market share of approximately 25%. The European market is heavily influenced by stringent environmental regulations and consumer preference for sustainable packaging options. Countries like Germany, France, and the United Kingdom lead in adopting recyclable and biodegradable packaging materials, driving the demand for eco-friendly thin wall packaging. The food and beverage industry, coupled with the cosmetics sector, is a major contributor to the demand for thin wall packaging in Europe. The regulatory emphasis on reducing single-use plastics has encouraged manufacturers to innovate with sustainable materials and processes, strengthening the thin wall packaging market in this region.

North America holds close to 20% of the market share, with the United States and Canada being the main contributors. The region’s market is driven by high consumption of convenience foods, beverages, and ready-to-eat meals, all of which benefit from the lightweight and protective qualities of thin wall packaging. Technological advancements in packaging and consumer demand for eco-friendly products also play a significant role. The North American market is seeing increased investment in R&D for sustainable materials and customization in packaging, especially for the retail and food service sectors.

Latin America and the Middle East & Africa collectively account for around 20% of the global market share, though they are emerging markets with high growth potential. In Latin America, countries like Brazil and Mexico are experiencing growth in the food and beverage sector, spurred by an expanding middle class and rising demand for packaged goods. The Middle East & Africa, although currently limited by economic constraints and lower infrastructure levels, is witnessing steady demand growth for thin wall packaging in the food and retail sectors. As disposable incomes and consumer awareness rise in these regions, the adoption of thin wall packaging is expected to grow, with a focus on convenience and food safety.

Shape Your Report to Specific Countries or Regions & Enjoy 30% Off!

Key Player Analysis:

  • Greiner
  • Amcor
  • Silgan Holdings Inc.
  • Groupe Guillin SA
  • Faerch Plast A/S
  • Takween Advanced Industries
  • DOUBLE H PLASTICS, INC
  • Mold-Tek Packaging Ltd
  • Others

Competitive Analysis:

The thin wall packaging market is highly competitive, with key players focusing on innovation, sustainability, and cost-efficiency to differentiate themselves. Major companies such as Amcor Plc, Berry Global Inc., Paccor GmbH, Huhtamaki Oyj, and Greiner Packaging dominate the market, leveraging their established infrastructure and global reach. These players invest heavily in research and development to create lightweight, recyclable, and biodegradable packaging solutions, aligning with the increasing demand for sustainable packaging. Smaller and regional players, however, maintain competitive advantages through localized production, catering to specific regional demands and adhering to local regulatory requirements. Intense competition drives companies to adopt advanced production technologies like injection molding and thermoforming to enhance quality and reduce costs. Strategic partnerships, acquisitions, and collaborations also characterize the competitive landscape as companies aim to expand their market presence, improve their product portfolios, and meet evolving consumer expectations.

Recent Developments:

  • In October 2023, Skanem AS acquired full ownership of packaging manufacturers Bergen Plastics AS and Heger AS. Bergen Plastics has a diverse portfolio of thin-wall plastic packaging products, including containers, lids, and closures, primarily catering to the home care and food sectors.
  • In September 2023, SABIC announced a strategic partnership with three in-mold labeling (IML) experts to explore the use of certified renewable polypropylene (PP) resins in mono-PP thin-wall containers. This partnership aims to ensure high-quality, processable, and sustainable packaging solutions.
  • In May 2023, ITC launched a range of barrier packaging for Sarasa’s olives and pickles. Using minimal raw material, ITC developed a thin-wall format made from 100% recyclable polypropylene, aligning with sustainability goals.
  • In February 2022, Hébert Group, known for expertise in thin-wall packaging and in-mold labeling, became a PulPac licensee and established a Dry Molded Fiber production facility in France to expand its eco-friendly offerings.
  • In June 2022, Heinz and Tesco collaborated with Berry Global, Plastic Energy, and SABIC to improve the recycling of soft plastics collected at Tesco’s in-store stations.
  • In September 2022, Borealis and Trexel developed a new container using polyolefins from the Bornewables™ portfolio, produced entirely from waste and residual streams.

Market Concentration & Characteristics:

The thin wall packaging market is moderately concentrated, with a mix of large multinational corporations and smaller regional players. Dominant companies, such as Amcor Plc, Berry Global Inc., Huhtamaki Oyj, and Greiner Packaging, hold substantial market shares due to their extensive distribution networks, advanced technological capabilities, and consistent investments in sustainable packaging solutions. This concentration provides these major players with a competitive edge in production scale, R&D, and market reach. Market characteristics include a strong focus on sustainability, innovation, and customization, as companies strive to meet consumer demands for eco-friendly and efficient packaging. Advanced production methods, such as injection molding and thermoforming, are key in maintaining high-quality standards and reducing costs. The market is further characterized by strategic partnerships, acquisitions, and collaborations as companies look to expand their portfolios, enhance sustainability, and improve operational efficiency in a competitive landscape.

Report Coverage:

The research report offers an in-depth analysis based on By Material, By Product Type, By Production Process and By Application. It details leading market players, providing an overview of their business, product offerings, investments, revenue streams, and key applications. Additionally, the report includes insights into the competitive environment, SWOT analysis, current market trends, as well as the primary drivers and constraints. Furthermore, it discusses various factors that have driven market expansion in recent years. The report also explores market dynamics, regulatory scenarios, and technological advancements that are shaping the industry. It assesses the impact of external factors and global economic changes on market growth. Lastly, it provides strategic recommendations for new entrants and established companies to navigate the complexities of the market.

Future Outlook:

  1. Increasing demand for sustainable packaging materials will drive innovation in recyclable and biodegradable thin wall solutions.
  2. Advancements in injection molding and thermoforming technology will enhance production efficiency and reduce costs.
  3. Rising urbanization and busy lifestyles will continue to boost demand for convenient, lightweight food and beverage packaging.
  4. Expansion into non-food sectors, like pharmaceuticals and cosmetics, will open new growth opportunities.
  5. Asia-Pacific will lead market growth due to population density, rising disposable incomes, and a growing packaged food sector.
  6. Regulatory pressures on plastic waste reduction will push companies to invest in eco-friendly alternatives.
  7. Increased investment in research and development will accelerate the adoption of advanced materials, such as compostable bioplastics.
  8. Customized packaging solutions will grow as brands seek to enhance consumer engagement and brand differentiation.
  9. Partnerships and acquisitions among major players will shape the competitive landscape and drive market consolidation.
  10. Improved recycling infrastructure worldwide will facilitate greater adoption of thin wall packaging across regions.

Table of Content
CHAPTER NO. 1 : INTRODUCTION………………………………. 42
1.1. Report Description ……………………………………………………. 42
Purpose of the Report…………………………………………..42
USP & Key Offerings……………………………………………..42
1.2. Key Benefits for Stakeholders……………………………………… 43
1.3. Target Audience ……………………………………………………….. 43
CHAPTER NO. 2 : EXECUTIVE SUMMARY……………………… 44
CHAPTER NO. 3 : THIN WALL PACKAGING MARKET FORCES
& INDUSTRY PULSE………………………….. 46
3.1. Foundations of Change – Market Overview……………………. 46
3.2. Rising Demand for Ready-to-Eat and Ready-to-Cook Meals . 49
3.3. Growing Demand for Sustainable Packaging…………………… 51
3.4. Rise in E-commerce Logistics……………………………………….. 53
3.5. Resin Price Volatility…………………………………………………. 55
3.6. Stringent Environmental Regulations and Plastic Bans……… 56
3.8. Untapped Horizons – Growth Potential & Opportunities and
Strategic Navigation – Industry Frameworks ………………….. 58
3.9. Market Equilibrium – Porter’s Five Forces……………………… 60
3.10. Ecosystem Dynamics – Value Chain Analysis…………………… 63
3.11. Macro Forces – PESTEL Breakdown………………………………. 64
CHAPTER NO. 4 : COMPETITION ANALYSIS ………………….. 68
4.1. Company Market Share Analysis………………………………….. 68
4.1.1. Global Thin Wall Packaging Market Company Revenue Market
Share 68
4.1. Strategic Developments …………………………………………….. 70
4.1.1. Acquisitions & Mergers ……………………………………………… 70
4.1.2. New Product Type Launch ………………………………………….. 71
4.1.3. Partnerships 72
4.1.4. Expansion 73
4.1.5. Investment & Recognition ………………………………………….. 74
4.2. Competitive Dashboard……………………………………………… 75
4.3. Company Assessment Metrics, 2024 …………………………….. 76
CHAPTER NO. 5 : GLOBAL MARKET ANALYSIS, INSIGHTS &
FORECAST, BY PRODUCT TYPE …………… 77
CHAPTER NO. 6 : GLOBAL MARKET ANALYSIS, INSIGHTS &
FORECAST, BY MATERIAL TYPE ………….. 84
CHAPTER NO. 7 : GLOBAL MARKET ANALYSIS, INSIGHTS &
FORECAST, BY END-USE INDUSTRY …….. 91
CHAPTER NO. 8 : GLOBAL MARKET ANALYSIS, INSIGHTS &
FORECAST, BY REGION …………………….. 96
GLOBAL THIN WALL PACKAGING MARKET, 2018 – 2032
20 | P a g e
CHAPTER NO. 9 : NORTH AMERICA MARKET ANALYSIS,
INSIGHTS & FORECAST, BY COUNTRY… 103
9.1. North America Market Analysis, Insights & Forecast, by
Product Type 106
9.2. North America Market Analysis, Insights & Forecast, by
Material Type 110
9.3. North America Market Analysis, Insights & Forecast, by Enduse Industry 113
9.4. U.S. Market Analysis, Insights & Forecast, by Product Type 115
9.5. U.S. Market Analysis, Insights & Forecast, by Material
Type 119
9.6. U.S. Market Analysis, Insights & Forecast, by End-use
Industry 122
9.7. Canada Market Analysis, Insights & Forecast, by Product
Type 124
9.8. Canada Market Analysis, Insights & Forecast, by Material
Type 128
9.9. Canada Market Analysis, Insights & Forecast, by End-use
Industry 131
9.10. Mexico Market Analysis, Insights & Forecast, by Product
Type 133
9.11. Mexico Market Analysis, Insights & Forecast, by Material
Type 137
9.12. Mexico Market Analysis, Insights & Forecast, by End-use
Industry 140
CHAPTER NO. 10 : EUROPE MARKET ANALYSIS, INSIGHTS &
FORECAST, BY COUNTRY ………………… 142
10.1. Europe Market Analysis, Insights & Forecast, by Product
Type 147
10.2. Europe Market Analysis, Insights & Forecast, by Material
Type 151
10.3. Europe Market Analysis, Insights & Forecast, by End-use
Industry 154
10.4. UK Market Analysis, Insights & Forecast, by Product Type ..156
10.5. UK Market Analysis, Insights & Forecast, by Material Type.160
10.6. UK Market Analysis, Insights & Forecast, by End-use
Industry 163
10.7. France Market Analysis, Insights & Forecast, by Product
Type 165
10.8. France Market Analysis, Insights & Forecast, by Material
Type 169
10.9. France Market Analysis, Insights & Forecast, by End-use
Industry 172
10.10. Germany Market Analysis, Insights & Forecast, by Product
Type 174
10.11. Germany Market Analysis, Insights & Forecast, by Material
Type 178
10.12. Germany Market Analysis, Insights & Forecast, by End-use
Industry 181
10.13. Italy Market Analysis, Insights & Forecast, by Product Type183
10.14. Italy Market Analysis, Insights & Forecast, by Material
Type 187
10.15. Italy Market Analysis, Insights & Forecast, by End-use
Industry 190
10.16. Spain Market Analysis, Insights & Forecast, by Product
Type 192
10.17. Spain Market Analysis, Insights & Forecast, by Material
Type 196
10.18. Spain Market Analysis, Insights & Forecast, by End-use
Industry 199
10.19. Russia Market Analysis, Insights & Forecast, by Product
Type 201
10.20. Russia Market Analysis, Insights & Forecast, by Material
Type 205
10.21. Russia Market Analysis, Insights & Forecast, by End-use
Industry 208
10.22. Poland Market Analysis, Insights & Forecast, by Product
Type 210
10.23. Poland Market Analysis, Insights & Forecast, by Material
Type 214
10.24. Poland Market Analysis, Insights & Forecast, by End-use
Industry 217
10.25. Rest of Europe Market Analysis, Insights & Forecast, by
Product Type 219
10.26. Rest of Europe Market Analysis, Insights & Forecast, by
Material Type 223
10.27. Rest of Europe Market Analysis, Insights & Forecast, by Enduse Industry 226
CHAPTER NO. 11 : ASIA PACIFIC MARKET ANALYSIS, INSIGHTS
& FORECAST, BY COUNTRY……………… 228
11.1. China Market Analysis, Insights & Forecast, by Product
Type 233
11.2. China Market Analysis, Insights & Forecast, by Material
Type 237
11.3. China Market Analysis, Insights & Forecast, by End-use
Industry 240
11.4. Japan Market Analysis, Insights & Forecast, by Product
Type 242
11.5. Japan Market Analysis, Insights & Forecast, by Material
Type 246
11.6. Japan Market Analysis, Insights & Forecast, by End-use
Industry 249
11.7. South Korea Market Analysis, Insights & Forecast, by Product
Type 251
11.8. South Korea Market Analysis, Insights & Forecast, by Material
Type 255
11.9. South Korea Market Analysis, Insights & Forecast, by End-use
Industry 258
11.10. India Market Analysis, Insights & Forecast, by Product
Type 260
11.11. India Market Analysis, Insights & Forecast, by Material
Type 264
GLOBAL THIN WALL PACKAGING MARKET, 2018 – 2032
22 | P a g e
11.12. India Market Analysis, Insights & Forecast, by End-use
Industry 267
11.13. Australia Market Analysis, Insights & Forecast, by Product
Type 269
11.14. Australia Market Analysis, Insights & Forecast, by Material
Type 273
11.15. Australia Market Analysis, Insights & Forecast, by End-use
Industry 276
11.16. Southeast Asia Market Analysis, Insights & Forecast, by
Product Type 278
11.17. Southeast Asia Market Analysis, Insights & Forecast, by
Material Type 282
11.18. Southeast Asia Market Analysis, Insights & Forecast, by Enduse Industry 285
11.19. Rest of Asia Pacific Market Analysis, Insights & Forecast, by
Product Type 287
11.20. Rest of Asia Pacific Market Analysis, Insights & Forecast, by
Material Type 291
11.21. Rest of Asia Pacific Market Analysis, Insights & Forecast, by
End-use Industry …………………………………………………….. 294
CHAPTER NO. 12 : LATIN AMERICA MARKET ANALYSIS,
INSIGHTS & FORECAST, BY COUNTRY… 296
12.1. Latin America Market Analysis, Insights & Forecast, by
Product Type 303
12.2. Latin America Market Analysis, Insights & Forecast, by
Material Type 305
12.3. Latin America Market Analysis, Insights & Forecast, by Enduse Industry 308
12.4. Brazil Market Analysis, Insights & Forecast, by Product
Type 310
12.5. Brazil Market Analysis, Insights & Forecast, by Material
Type 314
12.6. Brazil Market Analysis, Insights & Forecast, by End-use
Industry 317
12.7. Argentina Market Analysis, Insights & Forecast, by Product
Type 319
12.8. Argentina Market Analysis, Insights & Forecast, by Material
Type 323
12.9. Argentina Market Analysis, Insights & Forecast, by End-use
Industry 326
12.10. Rest of Latin America Market Analysis, Insights & Forecast, by
Product Type 328
12.11. Rest of Latin America Market Analysis, Insights & Forecast, by
Material Type 332
12.12. Rest of Latin America Market Analysis, Insights & Forecast, by
End-use Industry ………………………………………………………335
CHAPTER NO. 13 : MIDDLE EAST MARKET ANALYSIS,
INSIGHTS & FORECAST, BY COUNTRY… 337
13.1. Middle East Market Analysis, Insights & Forecast, by Product
Type 342
13.2. Middle East Market Analysis, Insights & Forecast, by Material
Type 346
13.3. Middle East Market Analysis, Insights & Forecast, by End-use
Industry 349
13.4. GCC Market Analysis, Insights & Forecast, by Product Type 351
13.5. GCC Market Analysis, Insights & Forecast, by Material
Type 355
13.6. GCC Market Analysis, Insights & Forecast, by End-use
Industry 358
13.7. Israel Market Analysis, Insights & Forecast, by Product
Type 360
13.8. Israel Market Analysis, Insights & Forecast, by Material
Type 364
13.9. Israel Market Analysis, Insights & Forecast, by End-use
Industry 367
13.10. Turkey Market Analysis, Insights & Forecast, by Product
Type 369
13.11. Turkey Market Analysis, Insights & Forecast, by Material
Type 373
13.12. Turkey Market Analysis, Insights & Forecast, by End-use
Industry 376
13.13. Rest of Middle East Market Analysis, Insights & Forecast, by
Product Type 378
13.14. Rest of Middle East Market Analysis, Insights & Forecast, by
Material Type 382
13.15. Rest of Middle East Market Analysis, Insights & Forecast, by
End-use Industry …………………………………………………….. 385
CHAPTER NO. 14 : AFRICA MARKET ANALYSIS, INSIGHTS &
FORECAST, BY COUNTRY ………………… 387
14.1. Africa Market Analysis, Insights & Forecast, by Product
Type 392
14.2. Africa Market Analysis, Insights & Forecast, by Material
Type 396
14.3. Africa Market Analysis, Insights & Forecast, by End-use
Industry 399
14.4. South Africa Market Analysis, Insights & Forecast, by Product
Type 401
14.5. South Africa Market Analysis, Insights & Forecast, by Material
Type 405
14.6. South Africa Market Analysis, Insights & Forecast, by End-use
Industry 408
14.7. Egypt Market Analysis, Insights & Forecast, by Product
Type 410
14.8. Egypt Market Analysis, Insights & Forecast, by Material
Type 414
14.9. Egypt Market Analysis, Insights & Forecast, by End-use
Industry 417
14.10. Rest of Africa Market Analysis, Insights & Forecast, by Product
Type 419
14.11. Rest of Africa Market Analysis, Insights & Forecast, by
Material Type 423
14.12. Rest of Africa Market Analysis, Insights & Forecast, by End-use
Industry 426
CHAPTER NO. 15 : COMPANY PROFILE ……………………….. 428
15.1. Amcor plc 428
15.2. Greiner Packaging …………………………………………………… 432
15.3. Silgan Holdings Inc…………………………………………………… 436
15.4. Groupe Guillin SA ……………………………………………………. 440
15.5. Faerch Plast A/S ……………………………………………………… 443
15.6. Takween Advanced Industries …………………………………… 446
15.7. Plastipak Industries Inc…………………………………………….. 449
15.8. Double H Plastics, Inc……………………………………………….. 452
15.9. Mold-Tek Packaging Ltd……………………………………………. 454
15.10. Otto Männer GmbH ………………………………………………… 458

List of Figures
FIG NO. 1. Thin Wall Packaging Market Revenue Share, By Product
Type, 2024 & 2032 ……………………………………………………..77
FIG NO. 2. Market Attractiveness Analysis, By Product Type……………78
FIG NO. 3. Incremental Revenue Growth Opportunity by Product
Type, 2024 – 2032……………………………………………………….79
FIG NO. 4. Thin Wall Packaging Market Revenue Share, By Material
Type, 2024 & 2032 ……………………………………………………..84
FIG NO. 5. Incremental Revenue Growth Opportunity by Material
Type, 2024 – 2032……………………………………………………….85
FIG NO. 6. Incremental Revenue Growth Opportunity by Material
Type, 2024 – 2032……………………………………………………….86
FIG NO. 7. Thin Wall Packaging Market Revenue Share, By End-use
Industry, 2024 & 2032…………………………………………………91
FIG NO. 8. Market Attractiveness Analysis, By End-use Industry………92
FIG NO. 9. Incremental Revenue Growth Opportunity by End-use
Industry, 2024 – 2032 ………………………………………………….93
FIG NO. 10. Thin Wall Packaging Market Revenue Share, By Region,
2024 & 2032………………………………………………………………96
FIG NO. 11. Market Attractiveness Analysis, By Region…………………….97
FIG NO. 12. Incremental Revenue Growth Opportunity by Region, 2024
– 2032 ……………………………………………………………………….98
FIG NO. 13. Thin Wall Packaging Market Revenue Share, By Country,
2024 & 2032…………………………………………………………….103
FIG NO. 14. Thin Wall Packaging Market Revenue Share, By Country,
2024 & 2032…………………………………………………………….142
FIG NO. 15. Thin Wall Packaging Market Revenue Share, By Country,
2024 & 2032…………………………………………………………….228
FIG NO. 16. Thin Wall Packaging Market Revenue Share, By Country,
2024 & 2032 …………………………………………………………… 296
FIG NO. 17. Thin Wall Packaging Market Revenue Share, By Country,
2024 & 2032 …………………………………………………………… 337
FIG NO. 18. Thin Wall Packaging Market Revenue Share, By Country,
2024 & 2032 …………………………………………………………… 387
GLOBAL THIN WALL PACKAGING MARKET, 2018 – 2032
26 | P a g e

List of Tables
TABLE NO. 1. : Global Thin Wall Packaging Market Revenue, By Product
Type, 2018 – 2024 (Kilo Tons)………………………………………80
TABLE NO. 2. : Global Thin Wall Packaging Market Revenue, By Product
Type, 2025 – 2032 (Kilo Tons)………………………………………81
TABLE NO. 3. : Global Thin Wall Packaging Market Revenue, By Product
Type, 2018 – 2024 (USD Million)…………………………………..82
TABLE NO. 4. : Global Thin Wall Packaging Market Revenue, By Product
Type, 2025 – 2032 (USD Million)…………………………………..83
TABLE NO. 5. : Global Thin Wall Packaging Market Revenue, By Material
Type, 2018 – 2024 (Kilo Tons)………………………………………87
TABLE NO. 6. : Global Thin Wall Packaging Market Revenue, By Material
Type, 2025 – 2032 (Kilo Tons)………………………………………88
TABLE NO. 7. : Global Thin Wall Packaging Market Revenue, By Material
Type, 2018 – 2024 (USD Million)…………………………………..89
TABLE NO. 8. : Global Thin Wall Packaging Market Revenue, By Material
Type, 2025 – 2032 (USD Million)…………………………………..90
TABLE NO. 9. : Global Thin Wall Packaging Market Revenue, By End-use
Industry, 2018 – 2024 (Kilo Tons) …………………………………94
TABLE NO. 10. : Global Thin Wall Packaging Market Revenue, By End-use
Industry, 2025 – 2032 (Kilo Tons) …………………………………94
TABLE NO. 11. : Global Thin Wall Packaging Market Revenue, By End-use
Industry, 2018 – 2024 (USD Million)……………………………..95
TABLE NO. 12. : Global Thin Wall Packaging Market Revenue, By End-use
Industry, 2025 – 2032 (USD Million)……………………………..95
TABLE NO. 13. : Global Thin Wall Packaging Market Revenue, By Region,
2018 – 2024 (Kilo Tons)……………………………………………….99
TABLE NO. 14. : Global Thin Wall Packaging Market Revenue, By Region,
2025– 2032 (Kilo Tons) …………………………………………….. 100
TABLE NO. 15. : Global Thin Wall Packaging Market Revenue, By Region,
2018 – 2024 (USD Million)………………………………………… 101
TABLE NO. 16. : Global Thin Wall Packaging Market Revenue, By Region,
2025– 2032 (USD Million)…………………………………………. 102
TABLE NO. 17. : North America Thin Wall Packaging Market Revenue, By
Country, 2018 – 2024 (Kilo Tons) ………………………………. 104
TABLE NO. 18. : North America Thin Wall Packaging Market Revenue, By
Country, 2025– 2032 (Kilo Tons) ……………………………….. 104
TABLE NO. 19. : North America Thin Wall Packaging Market Revenue, By
Country, 2018 – 2024 (USD Million)…………………………… 105
TABLE NO. 20. : North America Thin Wall Packaging Market Revenue, By
Country, 2025– 2032 (USD Million)……………………………. 105
TABLE NO. 21. : North America Thin Wall Packaging Market Revenue, By
Product Type, 2018 – 2024 (Kilo Tons)……………………….. 106
TABLE NO. 22. : North America Thin Wall Packaging Market Revenue, By
Product Type, 2025 – 2032 (Kilo Tons)……………………….. 107
TABLE NO. 23. : North America Thin Wall Packaging Market Revenue, By
Product Type, 2018 – 2024 (USD Million)……………………. 108
TABLE NO. 24. : North America Thin Wall Packaging Market Revenue, By
Product Type, 2025 – 2032 (USD Million)……………………. 109
TABLE NO. 25. : North America Thin Wall Packaging Market Revenue, By
Material Type, 2018 – 2024 (Kilo Tons)………………………. 110
TABLE NO. 26. : North America Thin Wall Packaging Market Revenue, By
Material Type, 2025 – 2032 (Kilo Tons)………………………. 111
TABLE NO. 27. : North America Thin Wall Packaging Market Revenue, By
Material Type, 2025 – 2032 (USD Million)…………………… 112
GLOBAL THIN WALL PACKAGING MARKET, 2018 – 2032
27 | P a g e
TABLE NO. 28. : North America Thin Wall Packaging Market Revenue, By
Material Type, 2018 – 2024 (USD Million)……………………112
TABLE NO. 29. : North America Thin Wall Packaging Market Revenue, By
End Use Industry, 2018 – 2024 (Kilo Tons) …………………..113
TABLE NO. 30. : North America Thin Wall Packaging Market Revenue, By
End Use Industry, 2025 – 2032 (Kilo Tons) …………………..113
TABLE NO. 31. : North America Thin Wall Packaging Market Revenue, By
End Use Industry, 2018 – 2024 (USD Million) ……………….114
TABLE NO. 32. : North America Thin Wall Packaging Market Revenue, By
End Use Industry, 2025 – 2032 (USD Million) ……………….114
TABLE NO. 33. : U.S. Thin Wall Packaging Market Revenue, By Product Type,
2018 – 2024 (Kilo Tons)……………………………………………..115
TABLE NO. 34. : U.S. Thin Wall Packaging Market Revenue, By Product Type,
2025 – 2032 (Kilo Tons)……………………………………………..116
TABLE NO. 35. : U.S. Thin Wall Packaging Market Revenue, By Product Type,
2018 – 2024 (USD Million) …………………………………………117
TABLE NO. 36. : U.S. Thin Wall Packaging Market Revenue, By Product Type,
2025 – 2032 (USD Million) …………………………………………118
TABLE NO. 37. : U.S. Thin Wall Packaging Market Revenue, By Material
Type, 2018 – 2024 (Kilo Tons)…………………………………….119
TABLE NO. 38. : U.S. Thin Wall Packaging Market Revenue, By Material
Type, 2025 – 2032 (Kilo Tons)…………………………………….120
TABLE NO. 39. : U.S. Thin Wall Packaging Market Revenue, By Material
Type, 2025 – 2032 (USD Million)…………………………………121
TABLE NO. 40. : U.S. Thin Wall Packaging Market Revenue, By Material
Type, 2018 – 2024 (USD Million)…………………………………121
TABLE NO. 41. : U.S. Thin Wall Packaging Market Revenue, By End Use
Industry, 2018 – 2024 (Kilo Tons) ……………………………….122
TABLE NO. 42. : U.S. Thin Wall Packaging Market Revenue, By End Use
Industry, 2025 – 2032 (Kilo Tons)………………………………. 122
TABLE NO. 43. : U.S. Thin Wall Packaging Market Revenue, By End Use
Industry, 2018 – 2024 (USD Million)…………………………… 123
TABLE NO. 44. : U.S. Thin Wall Packaging Market Revenue, By End Use
Industry, 2025 – 2032 (USD Million)…………………………… 123
TABLE NO. 45. : Canada Thin Wall Packaging Market Revenue, By Product
Type, 2018 – 2024 (Kilo Tons)……………………………………. 124
TABLE NO. 46. : Canada Thin Wall Packaging Market Revenue, By Product
Type, 2025 – 2032 (Kilo Tons)……………………………………. 125
TABLE NO. 47. : Canada Thin Wall Packaging Market Revenue, By Product
Type, 2018 – 2024 (USD Million) ……………………………….. 126
TABLE NO. 48. : Canada Thin Wall Packaging Market Revenue, By Product
Type, 2025 – 2032 (USD Million) ……………………………….. 127
TABLE NO. 49. : Canada Thin Wall Packaging Market Revenue, By Material
Type, 2018 – 2024 (Kilo Tons)……………………………………. 128
TABLE NO. 50. : Canada Thin Wall Packaging Market Revenue, By Material
Type, 2025 – 2032 (Kilo Tons)……………………………………. 129
TABLE NO. 51. : Canada Thin Wall Packaging Market Revenue, By Material
Type, 2025 – 2032 (USD Million) ……………………………….. 130
TABLE NO. 52. : Canada Thin Wall Packaging Market Revenue, By Material
Type, 2018 – 2024 (USD Million) ……………………………….. 130
TABLE NO. 53. : Canada Thin Wall Packaging Market Revenue, By End Use
Industry, 2018 – 2024 (Kilo Tons)………………………………. 131
TABLE NO. 54. : Canada Thin Wall Packaging Market Revenue, By End Use
Industry, 2025 – 2032 (Kilo Tons)………………………………. 131
TABLE NO. 55. : Canada Thin Wall Packaging Market Revenue, By End Use
Industry, 2018 – 2024 (USD Million)…………………………… 132
GLOBAL THIN WALL PACKAGING MARKET, 2018 – 2032
28 | P a g e
TABLE NO. 56. : Canada Thin Wall Packaging Market Revenue, By End Use
Industry, 2025 – 2032 (USD Million)……………………………132
TABLE NO. 57. : Mexico Thin Wall Packaging Market Revenue, By Product
Type, 2018 – 2024 (Kilo Tons)…………………………………….133
TABLE NO. 58. : Mexico Thin Wall Packaging Market Revenue, By Product
Type, 2025 – 2032 (Kilo Tons)…………………………………….134
TABLE NO. 59. : Mexico Thin Wall Packaging Market Revenue, By Product
Type, 2018 – 2024 (USD Million)…………………………………135
TABLE NO. 60. : Mexico Thin Wall Packaging Market Revenue, By Product
Type, 2025 – 2032 (USD Million)…………………………………136
TABLE NO. 61. : Mexico Thin Wall Packaging Market Revenue, By Material
Type, 2018 – 2024 (Kilo Tons)…………………………………….137
TABLE NO. 62. : Mexico Thin Wall Packaging Market Revenue, By Material
Type, 2025 – 2032 (Kilo Tons)…………………………………….138
TABLE NO. 63. : Mexico Thin Wall Packaging Market Revenue, By Material
Type, 2025 – 2032 (USD Million)…………………………………139
TABLE NO. 64. : Mexico Thin Wall Packaging Market Revenue, By Material
Type, 2018 – 2024 (USD Million)…………………………………139
TABLE NO. 65. : Mexico Thin Wall Packaging Market Revenue, By End Use
Industry, 2018 – 2024 (Kilo Tons) ……………………………….140
TABLE NO. 66. : Mexico Thin Wall Packaging Market Revenue, By End Use
Industry, 2025 – 2032 (Kilo Tons) ……………………………….140
TABLE NO. 67. : Mexico Thin Wall Packaging Market Revenue, By End Use
Industry, 2018 – 2024 (USD Million)……………………………141
TABLE NO. 68. : Mexico Thin Wall Packaging Market Revenue, By End Use
Industry, 2025 – 2032 (USD Million)……………………………141
TABLE NO. 69. : Europe Thin Wall Packaging Market Revenue, By Country,
2018 – 2024 (Kilo Tons)……………………………………………..143
TABLE NO. 70. : Europe Thin Wall Packaging Market Revenue, By Country,
2025– 2032 (Kilo Tons) …………………………………………….. 144
TABLE NO. 71. : Europe Thin Wall Packaging Market Revenue, By Country,
2018 – 2024 (USD Million)………………………………………… 145
TABLE NO. 72. : Europe Thin Wall Packaging Market Revenue, By Country,
2025– 2032 (USD Million)…………………………………………. 146
TABLE NO. 73. : Europe Thin Wall Packaging Market Revenue, By Product
Type, 2018 – 2024 (Kilo Tons)……………………………………. 147
TABLE NO. 74. : Europe Thin Wall Packaging Market Revenue, By Product
Type, 2025 – 2032 (Units)…………………………………………. 148
TABLE NO. 75. : Europe Thin Wall Packaging Market Revenue, By Product
Type, 2018 – 2024 (USD Million) ……………………………….. 149
TABLE NO. 76. : Europe Thin Wall Packaging Market Revenue, By Product
Type, 2025 – 2032 (USD Million) ……………………………….. 150
TABLE NO. 77. : Europe Thin Wall Packaging Market Revenue, By Material
Type, 2018 – 2024 (Kilo Tons)……………………………………. 151
TABLE NO. 78. : Europe Thin Wall Packaging Market Revenue, By Material
Type, 2025 – 2032 (Kilo Tons)……………………………………. 152
TABLE NO. 79. : Europe Thin Wall Packaging Market Revenue, By Material
Type, 2025 – 2032 (USD Million) ……………………………….. 153
TABLE NO. 80. : Europe Thin Wall Packaging Market Revenue, By Material
Type, 2018 – 2024 (USD Million) ……………………………….. 153
TABLE NO. 81. : Europe Thin Wall Packaging Market Revenue, By End Use
Industry, 2018 – 2024 (Kilo Tons)………………………………. 154
TABLE NO. 82. : Europe Thin Wall Packaging Market Revenue, By End Use
Industry, 2025 – 2032 (Kilo Tons)………………………………. 154
TABLE NO. 83. : Europe Thin Wall Packaging Market Revenue, By End Use
Industry, 2018 – 2024 (USD Million)…………………………… 155
GLOBAL THIN WALL PACKAGING MARKET, 2018 – 2032
29 | P a g e
TABLE NO. 84. : Europe Thin Wall Packaging Market Revenue, By End Use
Industry, 2025 – 2032 (USD Million)……………………………155
TABLE NO. 85. : UK Thin Wall Packaging Market Revenue, By Product Type,
2018 – 2024 (Kilo Tons)……………………………………………..156
TABLE NO. 86. : UK Thin Wall Packaging Market Revenue, By Product Type,
2025 – 2032 (Kilo Tons)……………………………………………..157
TABLE NO. 87. : UK Thin Wall Packaging Market Revenue, By Product Type,
2018 – 2024 (USD Million) …………………………………………158
TABLE NO. 88. : UK Thin Wall Packaging Market Revenue, By Product Type,
2025 – 2032 (USD Million) …………………………………………159
TABLE NO. 89. : UK Thin Wall Packaging Market Revenue, By Material Type,
2018 – 2024 (Kilo Tons)……………………………………………..160
TABLE NO. 90. : UK Thin Wall Packaging Market Revenue, By Material Type,
2025 – 2032 (Kilo Tons)……………………………………………..161
TABLE NO. 91. : UK Thin Wall Packaging Market Revenue, By Material Type,
2025 – 2032 (USD Million) …………………………………………162
TABLE NO. 92. : UK Thin Wall Packaging Market Revenue, By Material Type,
2018 – 2024 (USD Million) …………………………………………162
TABLE NO. 93. : UK Thin Wall Packaging Market Revenue, By End Use
Industry, 2018 – 2024 (Kilo Tons) ……………………………….163
TABLE NO. 94. : UK Thin Wall Packaging Market Revenue, By End Use
Industry, 2025 – 2032 (Kilo Tons) ……………………………….163
TABLE NO. 95. : UK Thin Wall Packaging Market Revenue, By End Use
Industry, 2018 – 2024 (USD Million)……………………………164
TABLE NO. 96. : UK Thin Wall Packaging Market Revenue, By End Use
Industry, 2025 – 2032 (USD Million)……………………………164
TABLE NO. 97. : France Thin Wall Packaging Market Revenue, By Product
Type, 2018 – 2024 (Kilo Tons)…………………………………….165
TABLE NO. 98. : France Thin Wall Packaging Market Revenue, By Product
Type, 2025 – 2032 (Kilo Tons)……………………………………. 166
TABLE NO. 99. : France Thin Wall Packaging Market Revenue, By Product
Type, 2018 – 2024 (USD Million) ……………………………….. 167
TABLE NO. 100. : France Thin Wall Packaging Market Revenue, By Product
Type, 2025 – 2032 (USD Million) ……………………………….. 168
TABLE NO. 101. : France Thin Wall Packaging Market Revenue, By Material
Type, 2018 – 2024 (Kilo Tons)……………………………………. 169
TABLE NO. 102. : France Thin Wall Packaging Market Revenue, By Material
Type, 2025 – 2032 (Kilo Tons)……………………………………. 170
TABLE NO. 103. : France Thin Wall Packaging Market Revenue, By Material
Type, 2025 – 2032 (USD Million) ……………………………….. 171
TABLE NO. 104. : France Thin Wall Packaging Market Revenue, By Material
Type, 2018 – 2024 (USD Million) ……………………………….. 171
TABLE NO. 105. : France Thin Wall Packaging Market Revenue, By End Use
Industry, 2018 – 2024 (Kilo Tons)………………………………. 172
TABLE NO. 106. : France Thin Wall Packaging Market Revenue, By End Use
Industry, 2025 – 2032 (Kilo Tons)………………………………. 172
TABLE NO. 107. : France Thin Wall Packaging Market Revenue, By End Use
Industry, 2018 – 2024 (USD Million)…………………………… 173
TABLE NO. 108. : France Thin Wall Packaging Market Revenue, By End Use
Industry, 2025 – 2032 (USD Million)…………………………… 173
TABLE NO. 109. : Germany Thin Wall Packaging Market Revenue, By Product
Type, 2018 – 2024 (Kilo Tons)……………………………………. 174
TABLE NO. 110. : Germany Thin Wall Packaging Market Revenue, By Product
Type, 2025 – 2032 (Kilo Tons)……………………………………. 175
TABLE NO. 111. : Germany Thin Wall Packaging Market Revenue, By Product
Type, 2018 – 2024 (USD Million) ……………………………….. 176
GLOBAL THIN WALL PACKAGING MARKET, 2018 – 2032
30 | P a g e
TABLE NO. 112. : Germany Thin Wall Packaging Market Revenue, By Product
Type, 2025 – 2032 (USD Million)…………………………………177
TABLE NO. 113. : Germany Thin Wall Packaging Market Revenue, By Material
Type, 2018 – 2024 (Kilo Tons)…………………………………….178
TABLE NO. 114. : Germany Thin Wall Packaging Market Revenue, By Material
Type, 2025 – 2032 (Kilo Tons)…………………………………….179
TABLE NO. 115. : Germany Thin Wall Packaging Market Revenue, By Material
Type, 2025 – 2032 (USD Million)…………………………………180
TABLE NO. 116. : Germany Thin Wall Packaging Market Revenue, By Material
Type, 2018 – 2024 (USD Million)…………………………………180
TABLE NO. 117. : Germany Thin Wall Packaging Market Revenue, By End Use
Industry, 2018 – 2024 (Kilo Tons) ……………………………….181
TABLE NO. 118. : Germany Thin Wall Packaging Market Revenue, By End Use
Industry, 2025 – 2032 (Kilo Tons) ……………………………….181
TABLE NO. 119. : Germany Thin Wall Packaging Market Revenue, By End Use
Industry, 2018 – 2024 (USD Million)……………………………182
TABLE NO. 120. : Germany Thin Wall Packaging Market Revenue, By End Use
Industry, 2025 – 2032 (USD Million)……………………………182
TABLE NO. 121. : Italy Thin Wall Packaging Market Revenue, By Product Type,
2018 – 2024 (Kilo Tons)……………………………………………..183
TABLE NO. 122. : Italy Thin Wall Packaging Market Revenue, By Product Type,
2025 – 2032 (Kilo Tons)……………………………………………..184
TABLE NO. 123. : Italy Thin Wall Packaging Market Revenue, By Product Type,
2018 – 2024 (USD Million) …………………………………………185
TABLE NO. 124. : Italy Thin Wall Packaging Market Revenue, By Product Type,
2025 – 2032 (USD Million) …………………………………………186
TABLE NO. 125. : Italy Thin Wall Packaging Market Revenue, By Material
Type, 2018 – 2024 (Kilo Tons)…………………………………….187
TABLE NO. 126. : Italy Thin Wall Packaging Market Revenue, By Material
Type, 2025 – 2032 (Kilo Tons)……………………………………. 188
TABLE NO. 127. : Italy Thin Wall Packaging Market Revenue, By Material
Type, 2025 – 2032 (USD Million) ……………………………….. 189
TABLE NO. 128. : Italy Thin Wall Packaging Market Revenue, By Material
Type, 2018 – 2024 (USD Million) ……………………………….. 189
TABLE NO. 129. : Italy Thin Wall Packaging Market Revenue, By End Use
Industry, 2018 – 2024 (Kilo Tons)………………………………. 190
TABLE NO. 130. : Italy Thin Wall Packaging Market Revenue, By End Use
Industry, 2025 – 2032 (Kilo Tons)………………………………. 190
TABLE NO. 131. : Italy Thin Wall Packaging Market Revenue, By End Use
Industry, 2018 – 2024 (USD Million)…………………………… 191
TABLE NO. 132. : Italy Thin Wall Packaging Market Revenue, By End Use
Industry, 2025 – 2032 (USD Million)…………………………… 191
TABLE NO. 133. : Spain Thin Wall Packaging Market Revenue, By Product
Type, 2018 – 2024 (Kilo Tons)……………………………………. 192
TABLE NO. 134. : Spain Thin Wall Packaging Market Revenue, By Product
Type, 2025 – 2032 (Kilo Tons)……………………………………. 193
TABLE NO. 135. : Spain Thin Wall Packaging Market Revenue, By Product
Type, 2018 – 2024 (USD Million) ……………………………….. 194
TABLE NO. 136. : Spain Thin Wall Packaging Market Revenue, By Product
Type, 2025 – 2032 (USD Million) ……………………………….. 195
TABLE NO. 137. : Spain Thin Wall Packaging Market Revenue, By Material
Type, 2018 – 2024 (Kilo Tons)……………………………………. 196
TABLE NO. 138. : Spain Thin Wall Packaging Market Revenue, By Material
Type, 2025 – 2032 (Kilo Tons)……………………………………. 197
TABLE NO. 139. : Spain Thin Wall Packaging Market Revenue, By Material
Type, 2025 – 2032 (USD Million) ……………………………….. 198
GLOBAL THIN WALL PACKAGING MARKET, 2018 – 2032
31 | P a g e
TABLE NO. 140. : Spain Thin Wall Packaging Market Revenue, By Material
Type, 2018 – 2024 (USD Million)…………………………………198
TABLE NO. 141. : Spain Thin Wall Packaging Market Revenue, By End Use
Industry, 2018 – 2024 (Kilo Tons) ……………………………….199
TABLE NO. 142. : Spain Thin Wall Packaging Market Revenue, By End Use
Industry, 2025 – 2032 (Kilo Tons) ……………………………….199
TABLE NO. 143. : Spain Thin Wall Packaging Market Revenue, By End Use
Industry, 2018 – 2024 (USD Million)……………………………200
TABLE NO. 144. : Spain Thin Wall Packaging Market Revenue, By End Use
Industry, 2025 – 2032 (USD Million)……………………………200
TABLE NO. 145. : Russia Thin Wall Packaging Market Revenue, By Product
Type, 2018 – 2024 (Kilo Tons)…………………………………….201
TABLE NO. 146. : Russia Thin Wall Packaging Market Revenue, By Product
Type, 2025 – 2032 (Kilo Tons)…………………………………….202
TABLE NO. 147. : Russia Thin Wall Packaging Market Revenue, By Product
Type, 2018 – 2024 (USD Million)…………………………………203
TABLE NO. 148. : Russia Thin Wall Packaging Market Revenue, By Product
Type, 2025 – 2032 (USD Million)…………………………………204
TABLE NO. 149. : Russia Thin Wall Packaging Market Revenue, By Material
Type, 2018 – 2024 (Kilo Tons)…………………………………….205
TABLE NO. 150. : Russia Thin Wall Packaging Market Revenue, By Material
Type, 2025 – 2032 (Kilo Tons)…………………………………….206
TABLE NO. 151. : Russia Thin Wall Packaging Market Revenue, By Material
Type, 2025 – 2032 (USD Million)…………………………………207
TABLE NO. 152. : Russia Thin Wall Packaging Market Revenue, By Material
Type, 2018 – 2024 (USD Million)…………………………………207
TABLE NO. 153. : Russia Thin Wall Packaging Market Revenue, By End Use
Industry, 2018 – 2024 (Kilo Tons) ……………………………….208
TABLE NO. 154. : Russia Thin Wall Packaging Market Revenue, By End Use
Industry, 2025 – 2032 (Kilo Tons)………………………………. 208
TABLE NO. 155. : Russia Thin Wall Packaging Market Revenue, By End Use
Industry, 2018 – 2024 (USD Million)…………………………… 209
TABLE NO. 156. : Russia Thin Wall Packaging Market Revenue, By End Use
Industry, 2025 – 2032 (USD Million)…………………………… 209
TABLE NO. 157. : Poland Thin Wall Packaging Market Revenue, By Product
Type, 2018 – 2024 (Kilo Tons)……………………………………. 210
TABLE NO. 158. : Poland Thin Wall Packaging Market Revenue, By Product
Type, 2025 – 2032 (Kilo Tons)……………………………………. 211
TABLE NO. 159. : Poland Thin Wall Packaging Market Revenue, By Product
Type, 2018 – 2024 (USD Million) ……………………………….. 212
TABLE NO. 160. : Poland Thin Wall Packaging Market Revenue, By Product
Type, 2025 – 2032 (USD Million) ……………………………….. 213
TABLE NO. 161. : Poland Thin Wall Packaging Market Revenue, By Material
Type, 2018 – 2024 (Kilo Tons)……………………………………. 214
TABLE NO. 162. : Poland Thin Wall Packaging Market Revenue, By Material
Type, 2025 – 2032 (Kilo Tons)……………………………………. 215
TABLE NO. 163. : Poland Thin Wall Packaging Market Revenue, By Material
Type, 2025 – 2032 (USD Million) ……………………………….. 216
TABLE NO. 164. : Poland Thin Wall Packaging Market Revenue, By Material
Type, 2018 – 2024 (USD Million) ……………………………….. 216
TABLE NO. 165. : Poland Thin Wall Packaging Market Revenue, By End Use
Industry, 2018 – 2024 (Kilo Tons)………………………………. 217
TABLE NO. 166. : Poland Thin Wall Packaging Market Revenue, By End Use
Industry, 2025 – 2032 (Kilo Tons)………………………………. 217
TABLE NO. 167. : Poland Thin Wall Packaging Market Revenue, By End Use
Industry, 2018 – 2024 (USD Million)…………………………… 218
GLOBAL THIN WALL PACKAGING MARKET, 2018 – 2032
32 | P a g e
TABLE NO. 168. : Poland Thin Wall Packaging Market Revenue, By End Use
Industry, 2025 – 2032 (USD Million)……………………………218
TABLE NO. 169. : Rest of Europe Thin Wall Packaging Market Revenue, By
Product Type, 2018 – 2024 (Kilo Tons) ………………………..219
TABLE NO. 170. : Rest of Europe Thin Wall Packaging Market Revenue, By
Product Type, 2025 – 2032 (Kilo Tons) ………………………..220
TABLE NO. 171. : Rest of Europe Thin Wall Packaging Market Revenue, By
Product Type, 2018 – 2024 (USD Million)…………………….221
TABLE NO. 172. : Rest of Europe Thin Wall Packaging Market Revenue, By
Product Type, 2025 – 2032 (USD Million)…………………….222
TABLE NO. 173. : Rest of Europe Thin Wall Packaging Market Revenue, By
Material Type, 2018 – 2024 (Kilo Tons) ……………………….223
TABLE NO. 174. : Rest of Europe Thin Wall Packaging Market Revenue, By
Material Type, 2025 – 2032 (Kilo Tons) ……………………….224
TABLE NO. 175. : Rest of Europe Thin Wall Packaging Market Revenue, By
Material Type, 2025 – 2032 (USD Million)……………………225
TABLE NO. 176. : Rest of Europe Thin Wall Packaging Market Revenue, By
Material Type, 2018 – 2024 (USD Million)……………………225
TABLE NO. 177. : Rest of Europe Thin Wall Packaging Market Revenue, By
End Use Industry, 2018 – 2024 (Kilo Tons) …………………..226
TABLE NO. 178. : Rest of Europe Thin Wall Packaging Market Revenue, By
End Use Industry, 2025 – 2032 (Kilo Tons) …………………..226
TABLE NO. 179. : Rest of Europe Thin Wall Packaging Market Revenue, By
End Use Industry, 2018 – 2024 (USD Million) ……………….227
TABLE NO. 180. : Rest of Europe Thin Wall Packaging Market Revenue, By
End Use Industry, 2025 – 2032 (USD Million) ……………….227
TABLE NO. 181. : Asia Pacific Thin Wall Packaging Market Revenue, By
Country, 2018 – 2024 (Kilo Tons)………………………………..229
TABLE NO. 182. : Asia Pacific Thin Wall Packaging Market Revenue, By
Country, 2025– 2032 (Kilo Tons) ……………………………….. 230
TABLE NO. 183. : Asia Pacific Thin Wall Packaging Market Revenue, By
Country, 2018 – 2024 (USD Million)…………………………… 231
TABLE NO. 184. : Asia Pacific Thin Wall Packaging Market Revenue, By
Country, 2025– 2032 (USD Million)……………………………. 232
TABLE NO. 185. : China Thin Wall Packaging Market Revenue, By Product
Type, 2018 – 2024 (Kilo Tons)……………………………………. 233
TABLE NO. 186. : China Thin Wall Packaging Market Revenue, By Product
Type, 2025 – 2032 (Kilo Tons)……………………………………. 234
TABLE NO. 187. : China Thin Wall Packaging Market Revenue, By Product
Type, 2018 – 2024 (USD Million) ……………………………….. 235
TABLE NO. 188. : China Thin Wall Packaging Market Revenue, By Product
Type, 2025 – 2032 (USD Million) ……………………………….. 236
TABLE NO. 189. : China Thin Wall Packaging Market Revenue, By Material
Type, 2018 – 2024 (Kilo Tons)……………………………………. 237
TABLE NO. 190. : China Thin Wall Packaging Market Revenue, By Material
Type, 2025 – 2032 (Kilo Tons)……………………………………. 238
TABLE NO. 191. : China Thin Wall Packaging Market Revenue, By Material
Type, 2025 – 2032 (USD Million) ……………………………….. 239
TABLE NO. 192. : China Thin Wall Packaging Market Revenue, By Material
Type, 2018 – 2024 (USD Million) ……………………………….. 239
TABLE NO. 193. : China Thin Wall Packaging Market Revenue, By End Use
Industry, 2018 – 2024 (Kilo Tons)………………………………. 240
TABLE NO. 194. : China Thin Wall Packaging Market Revenue, By End Use
Industry, 2025 – 2032 (Kilo Tons)………………………………. 240
TABLE NO. 195. : China Thin Wall Packaging Market Revenue, By End Use
Industry, 2018 – 2024 (USD Million)…………………………… 241
GLOBAL THIN WALL PACKAGING MARKET, 2018 – 2032
33 | P a g e
TABLE NO. 196. : China Thin Wall Packaging Market Revenue, By End Use
Industry, 2025 – 2032 (USD Million)……………………………241
TABLE NO. 197. : Japan Thin Wall Packaging Market Revenue, By Product
Type, 2018 – 2024 (Kilo Tons)…………………………………….242
TABLE NO. 198. : Japan Thin Wall Packaging Market Revenue, By Product
Type, 2025 – 2032 (Kilo Tons)…………………………………….243
TABLE NO. 199. : Japan Thin Wall Packaging Market Revenue, By Product
Type, 2018 – 2024 (USD Million)…………………………………244
TABLE NO. 200. : Japan Thin Wall Packaging Market Revenue, By Product
Type, 2025 – 2032 (USD Million)…………………………………245
TABLE NO. 201. : Japan Thin Wall Packaging Market Revenue, By Material
Type, 2018 – 2024 (Kilo Tons)…………………………………….246
TABLE NO. 202. : Japan Thin Wall Packaging Market Revenue, By Material
Type, 2025 – 2032 (Kilo Tons)…………………………………….247
TABLE NO. 203. : Japan Thin Wall Packaging Market Revenue, By Material
Type, 2025 – 2032 (USD Million)…………………………………248
TABLE NO. 204. : Japan Thin Wall Packaging Market Revenue, By Material
Type, 2018 – 2024 (USD Million)…………………………………248
TABLE NO. 205. : Japan Thin Wall Packaging Market Revenue, By End Use
Industry, 2018 – 2024 (Kilo Tons) ……………………………….249
TABLE NO. 206. : Japan Thin Wall Packaging Market Revenue, By End Use
Industry, 2025 – 2032 (Kilo Tons) ……………………………….249
TABLE NO. 207. : Japan Thin Wall Packaging Market Revenue, By End Use
Industry, 2018 – 2024 (USD Million)……………………………250
TABLE NO. 208. : Japan Thin Wall Packaging Market Revenue, By End Use
Industry, 2025 – 2032 (USD Million)……………………………250
TABLE NO. 209. : South Korea Thin Wall Packaging Market Revenue, By
Product Type, 2018 – 2024 (Kilo Tons) ………………………..251
TABLE NO. 210. : South Korea Thin Wall Packaging Market Revenue, By
Product Type, 2025 – 2032 (Kilo Tons)……………………….. 252
TABLE NO. 211. : South Korea Thin Wall Packaging Market Revenue, By
Product Type, 2018 – 2024 (USD Million)……………………. 253
TABLE NO. 212. : South Korea Thin Wall Packaging Market Revenue, By
Product Type, 2025 – 2032 (USD Million)……………………. 254
TABLE NO. 213. : South Korea Thin Wall Packaging Market Revenue, By
Material Type, 2018 – 2024 (Kilo Tons)………………………. 255
TABLE NO. 214. : South Korea Thin Wall Packaging Market Revenue, By
Material Type, 2025 – 2032 (Kilo Tons)………………………. 256
TABLE NO. 215. : South Korea Thin Wall Packaging Market Revenue, By
Material Type, 2025 – 2032 (USD Million)…………………… 257
TABLE NO. 216. : South Korea Thin Wall Packaging Market Revenue, By
Material Type, 2018 – 2024 (USD Million)…………………… 257
TABLE NO. 217. : South Korea Thin Wall Packaging Market Revenue, By End
Use Industry, 2018 – 2024 (Kilo Tons)………………………… 258
TABLE NO. 218. : South Korea Thin Wall Packaging Market Revenue, By End
Use Industry, 2025 – 2032 (Kilo Tons)………………………… 258
TABLE NO. 219. : South Korea Thin Wall Packaging Market Revenue, By End
Use Industry, 2018 – 2024 (USD Million)…………………….. 259
TABLE NO. 220. : South Korea Thin Wall Packaging Market Revenue, By End
Use Industry, 2025 – 2032 (USD Million)…………………….. 259
TABLE NO. 221. : India Thin Wall Packaging Market Revenue, By Product
Type, 2018 – 2024 (Kilo Tons)……………………………………. 260
TABLE NO. 222. : India Thin Wall Packaging Market Revenue, By Product
Type, 2025 – 2032 (Kilo Tons)……………………………………. 261
TABLE NO. 223. : India Thin Wall Packaging Market Revenue, By Product
Type, 2018 – 2024 (USD Million) ……………………………….. 262
GLOBAL THIN WALL PACKAGING MARKET, 2018 – 2032
34 | P a g e
TABLE NO. 224. : India Thin Wall Packaging Market Revenue, By Product
Type, 2025 – 2032 (USD Million)…………………………………263
TABLE NO. 225. : India Thin Wall Packaging Market Revenue, By Material
Type, 2018 – 2024 (Kilo Tons)…………………………………….264
TABLE NO. 226. : India Thin Wall Packaging Market Revenue, By Material
Type, 2025 – 2032 (Kilo Tons)…………………………………….265
TABLE NO. 227. : India Thin Wall Packaging Market Revenue, By Material
Type, 2025 – 2032 (USD Million)…………………………………266
TABLE NO. 228. : India Thin Wall Packaging Market Revenue, By Material
Type, 2018 – 2024 (USD Million)…………………………………266
TABLE NO. 229. : India Thin Wall Packaging Market Revenue, By End Use
Industry, 2018 – 2024 (Kilo Tons) ……………………………….267
TABLE NO. 230. : India Thin Wall Packaging Market Revenue, By End Use
Industry, 2025 – 2032 (Kilo Tons) ……………………………….267
TABLE NO. 231. : India Thin Wall Packaging Market Revenue, By End Use
Industry, 2018 – 2024 (USD Million)……………………………268
TABLE NO. 232. : India Thin Wall Packaging Market Revenue, By End Use
Industry, 2025 – 2032 (USD Million)……………………………268
TABLE NO. 233. : Australia Thin Wall Packaging Market Revenue, By Product
Type, 2018 – 2024 (Kilo Tons)…………………………………….269
TABLE NO. 234. : Australia Thin Wall Packaging Market Revenue, By Product
Type, 2025 – 2032 (Kilo Tons)…………………………………….270
TABLE NO. 235. : Australia Thin Wall Packaging Market Revenue, By Product
Type, 2018 – 2024 (USD Million)…………………………………271
TABLE NO. 236. : Australia Thin Wall Packaging Market Revenue, By Product
Type, 2025 – 2032 (USD Million)…………………………………272
TABLE NO. 237. : Australia Thin Wall Packaging Market Revenue, By Material
Type, 2018 – 2024 (Kilo Tons)…………………………………….273
TABLE NO. 238. : Australia Thin Wall Packaging Market Revenue, By Material
Type, 2025 – 2032 (Kilo Tons)……………………………………. 274
TABLE NO. 239. : Australia Thin Wall Packaging Market Revenue, By Material
Type, 2025 – 2032 (USD Million) ……………………………….. 275
TABLE NO. 240. : Australia Thin Wall Packaging Market Revenue, By Material
Type, 2018 – 2024 (USD Million) ……………………………….. 275
TABLE NO. 241. : Australia Thin Wall Packaging Market Revenue, By End Use
Industry, 2018 – 2024 (Kilo Tons)………………………………. 276
TABLE NO. 242. : Australia Thin Wall Packaging Market Revenue, By End Use
Industry, 2025 – 2032 (Kilo Tons)………………………………. 276
TABLE NO. 243. : Australia Thin Wall Packaging Market Revenue, By End Use
Industry, 2018 – 2024 (USD Million)…………………………… 277
TABLE NO. 244. : Australia Thin Wall Packaging Market Revenue, By End Use
Industry, 2025 – 2032 (USD Million)…………………………… 277
TABLE NO. 245. : Southeast Asia Thin Wall Packaging Market Revenue, By
Product Type, 2018 – 2024 (Kilo Tons)……………………….. 278
TABLE NO. 246. : Southeast Asia Thin Wall Packaging Market Revenue, By
Product Type, 2025 – 2032 (Kilo Tons)……………………….. 279
TABLE NO. 247. : Southeast Asia Thin Wall Packaging Market Revenue, By
Product Type, 2018 – 2024 (USD Million)……………………. 280
TABLE NO. 248. : Southeast Asia Thin Wall Packaging Market Revenue, By
Product Type, 2025 – 2032 (USD Million)……………………. 281
TABLE NO. 249. : Southeast Asia Thin Wall Packaging Market Revenue, By
Material Type, 2018 – 2024 (Kilo Tons)………………………. 282
TABLE NO. 250. : Southeast Asia Thin Wall Packaging Market Revenue, By
Material Type, 2025 – 2032 (Kilo Tons)………………………. 283
TABLE NO. 251. : Southeast Asia Thin Wall Packaging Market Revenue, By
Material Type, 2025 – 2032 (USD Million)…………………… 284
GLOBAL THIN WALL PACKAGING MARKET, 2018 – 2032
35 | P a g e
TABLE NO. 252. : Southeast Asia Thin Wall Packaging Market Revenue, By
Material Type, 2018 – 2024 (USD Million)……………………284
TABLE NO. 253. : Southeast Asia Thin Wall Packaging Market Revenue, By
End Use Industry, 2018 – 2024 (Kilo Tons) …………………..285
TABLE NO. 254. : Southeast Asia Thin Wall Packaging Market Revenue, By
End Use Industry, 2025 – 2032 (Kilo Tons) …………………..285
TABLE NO. 255. : Southeast Asia Thin Wall Packaging Market Revenue, By
End Use Industry, 2018 – 2024 (USD Million) ……………….286
TABLE NO. 256. : Southeast Asia Thin Wall Packaging Market Revenue, By
End Use Industry, 2025 – 2032 (USD Million) ……………….286
TABLE NO. 257. : Rest of Asia Pacific Thin Wall Packaging Market Revenue, By
Product Type, 2018 – 2024 (Kilo Tons) ………………………..287
TABLE NO. 258. : Rest of Asia Pacific Thin Wall Packaging Market Revenue, By
Product Type, 2025 – 2032 (Kilo Tons) ………………………..288
TABLE NO. 259. : Rest of Asia Pacific Thin Wall Packaging Market Revenue, By
Product Type, 2018 – 2024 (USD Million)…………………….289
TABLE NO. 260. : Rest of Asia Pacific Thin Wall Packaging Market Revenue, By
Product Type, 2025 – 2032 (USD Million)…………………….290
TABLE NO. 261. : Rest of Asia Pacific Thin Wall Packaging Market Revenue, By
Material Type, 2018 – 2024 (Kilo Tons) ……………………….291
TABLE NO. 262. : Rest of Asia Pacific Thin Wall Packaging Market Revenue, By
Material Type, 2025 – 2032 (Kilo Tons) ……………………….292
TABLE NO. 263. : Rest of Asia Pacific Thin Wall Packaging Market Revenue, By
Material Type, 2025 – 2032 (USD Million)……………………293
TABLE NO. 264. : Rest of Asia Pacific Thin Wall Packaging Market Revenue, By
Material Type, 2018 – 2024 (USD Million)……………………293
TABLE NO. 265. : Rest of Asia Pacific Thin Wall Packaging Market Revenue, By
End Use Industry, 2018 – 2024 (Kilo Tons) …………………..294
TABLE NO. 266. : Rest of Asia Pacific Thin Wall Packaging Market Revenue, By
End Use Industry, 2025 – 2032 (Kilo Tons)………………….. 294
TABLE NO. 267. : Rest of Asia Pacific Thin Wall Packaging Market Revenue, By
End Use Industry, 2018 – 2024 (USD Million)………………. 295
TABLE NO. 268. : Rest of Asia Pacific Thin Wall Packaging Market Revenue, By
End Use Industry, 2025 – 2032 (USD Million)………………. 295
TABLE NO. 269. : Latin America Thin Wall Packaging Market Revenue, By
Country, 2018 – 2024 (Kilo Tons) ………………………………. 297
TABLE NO. 270. : Latin America Thin Wall Packaging Market Revenue, By
Country, 2025– 2032 (Kilo Tons) ……………………………….. 298
TABLE NO. 271. : Latin America Thin Wall Packaging Market Revenue, By
Country, 2018 – 2024 (USD Million)…………………………… 299
TABLE NO. 272. : Latin America Thin Wall Packaging Market Revenue, By
Country, 2025– 2032 (USD Million)……………………………. 300
TABLE NO. 273. : Latin America Thin Wall Packaging Market Revenue, By
Product Type, 2018 – 2024 (Kilo Tons)……………………….. 301
TABLE NO. 274. : Latin America Thin Wall Packaging Market Revenue, By
Product Type, 2025 – 2032 (Kilo Tons)……………………….. 302
TABLE NO. 275. : Latin America Thin Wall Packaging Market Revenue, By
Product Type, 2018 – 2024 (USD Million)……………………. 303
TABLE NO. 276. : Latin America Thin Wall Packaging Market Revenue, By
Product Type, 2025 – 2032 (USD Million)……………………. 304
TABLE NO. 277. : Latin America Thin Wall Packaging Market Revenue, By
Material Type, 2018 – 2024 (Kilo Tons)………………………. 305
TABLE NO. 278. : Latin America Thin Wall Packaging Market Revenue, By
Material Type, 2025 – 2032 (Kilo Tons)………………………. 306
TABLE NO. 279. : Latin America Thin Wall Packaging Market Revenue, By
Material Type, 2025 – 2032 (USD Million)…………………… 307
GLOBAL THIN WALL PACKAGING MARKET, 2018 – 2032
36 | P a g e
TABLE NO. 280. : Latin America Thin Wall Packaging Market Revenue, By
Material Type, 2018 – 2024 (USD Million)……………………307
TABLE NO. 281. : Latin America Thin Wall Packaging Market Revenue, By End
Use Industry, 2018 – 2024 (Kilo Tons)………………………….308
TABLE NO. 282. : Latin America Thin Wall Packaging Market Revenue, By End
Use Industry, 2025 – 2032 (Kilo Tons)………………………….308
TABLE NO. 283. : Latin America Thin Wall Packaging Market Revenue, By End
Use Industry, 2018 – 2024 (USD Million) ……………………..309
TABLE NO. 284. : Latin America Thin Wall Packaging Market Revenue, By End
Use Industry, 2025 – 2032 (USD Million) ……………………..309
TABLE NO. 285. : Brazil Thin Wall Packaging Market Revenue, By Product
Type, 2018 – 2024 (Kilo Tons)…………………………………….310
TABLE NO. 286. : Brazil Thin Wall Packaging Market Revenue, By Product
Type, 2025 – 2032 (Kilo Tons)…………………………………….311
TABLE NO. 287. : Brazil Thin Wall Packaging Market Revenue, By Product
Type, 2018 – 2024 (USD Million)…………………………………312
TABLE NO. 288. : Brazil Thin Wall Packaging Market Revenue, By Product
Type, 2025 – 2032 (USD Million)…………………………………313
TABLE NO. 289. : Brazil Thin Wall Packaging Market Revenue, By Material
Type, 2018 – 2024 (Kilo Tons)…………………………………….314
TABLE NO. 290. : Brazil Thin Wall Packaging Market Revenue, By Material
Type, 2025 – 2032 (Kilo Tons)…………………………………….315
TABLE NO. 291. : Brazil Thin Wall Packaging Market Revenue, By Material
Type, 2025 – 2032 (USD Million)…………………………………316
TABLE NO. 292. : Brazil Thin Wall Packaging Market Revenue, By Material
Type, 2018 – 2024 (USD Million)…………………………………316
TABLE NO. 293. : Brazil Thin Wall Packaging Market Revenue, By End Use
Industry, 2018 – 2024 (Kilo Tons) ……………………………….317
TABLE NO. 294. : Brazil Thin Wall Packaging Market Revenue, By End Use
Industry, 2025 – 2032 (Kilo Tons)………………………………. 317
TABLE NO. 295. : Brazil Thin Wall Packaging Market Revenue, By End Use
Industry, 2018 – 2024 (USD Million)…………………………… 318
TABLE NO. 296. : Brazil Thin Wall Packaging Market Revenue, By End Use
Industry, 2025 – 2032 (USD Million)…………………………… 318
TABLE NO. 297. : Argentina Thin Wall Packaging Market Revenue, By Product
Type, 2018 – 2024 (Kilo Tons)……………………………………. 319
TABLE NO. 298. : Argentina Thin Wall Packaging Market Revenue, By Product
Type, 2025 – 2032 (Kilo Tons)……………………………………. 320
TABLE NO. 299. : Argentina Thin Wall Packaging Market Revenue, By Product
Type, 2018 – 2024 (USD Million) ……………………………….. 321
TABLE NO. 300. : Argentina Thin Wall Packaging Market Revenue, By Product
Type, 2025 – 2032 (USD Million) ……………………………….. 322
TABLE NO. 301. : Argentina Thin Wall Packaging Market Revenue, By Material
Type, 2018 – 2024 (Kilo Tons)……………………………………. 323
TABLE NO. 302. : Argentina Thin Wall Packaging Market Revenue, By Material
Type, 2025 – 2032 (Kilo Tons)……………………………………. 324
TABLE NO. 303. : Argentina Thin Wall Packaging Market Revenue, By Material
Type, 2025 – 2032 (USD Million) ……………………………….. 325
TABLE NO. 304. : Argentina Thin Wall Packaging Market Revenue, By Material
Type, 2018 – 2024 (USD Million) ……………………………….. 325
TABLE NO. 305. : Argentina Thin Wall Packaging Market Revenue, By End Use
Industry, 2018 – 2024 (Kilo Tons)………………………………. 326
TABLE NO. 306. : Argentina Thin Wall Packaging Market Revenue, By End Use
Industry, 2025 – 2032 (Kilo Tons)………………………………. 326
TABLE NO. 307. : Argentina Thin Wall Packaging Market Revenue, By End Use
Industry, 2018 – 2024 (USD Million)…………………………… 327
GLOBAL THIN WALL PACKAGING MARKET, 2018 – 2032
37 | P a g e
TABLE NO. 308. : Argentina Thin Wall Packaging Market Revenue, By End Use
Industry, 2025 – 2032 (USD Million)……………………………327
TABLE NO. 309. : Rest of Latin America Thin Wall Packaging Market Revenue,
By Product Type, 2018 – 2024 (Kilo Tons)…………………….328
TABLE NO. 310. : Rest of Latin America Thin Wall Packaging Market Revenue,
By Product Type, 2025 – 2032 (Kilo Tons)…………………….329
TABLE NO. 311. : Rest of Latin America Thin Wall Packaging Market Revenue,
By Product Type, 2018 – 2024 (USD Million) ………………..330
TABLE NO. 312. : Rest of Latin America Thin Wall Packaging Market Revenue,
By Product Type, 2025 – 2032 (USD Million) ………………..331
TABLE NO. 313. : Rest of Latin America Thin Wall Packaging Market Revenue,
By Material Type, 2018 – 2024 (Kilo Tons)……………………332
TABLE NO. 314. : Rest of Latin America Thin Wall Packaging Market Revenue,
By Material Type, 2025 – 2032 (Kilo Tons)……………………333
TABLE NO. 315. : Rest of Latin America Thin Wall Packaging Market Revenue,
By Material Type, 2025 – 2032 (USD Million) ……………….334
TABLE NO. 316. : Rest of Latin America Thin Wall Packaging Market Revenue,
By Material Type, 2018 – 2024 (USD Million) ……………….334
TABLE NO. 317. : Rest of Latin America Thin Wall Packaging Market Revenue,
By End Use Industry, 2018 – 2024 (Kilo Tons)……………….335
TABLE NO. 318. : Rest of Latin America Thin Wall Packaging Market Revenue,
By End Use Industry, 2025 – 2032 (Kilo Tons)……………….335
TABLE NO. 319. : Rest of Latin America Thin Wall Packaging Market Revenue,
By End Use Industry, 2018 – 2024 (USD Million) …………..336
TABLE NO. 320. : Rest of Latin America Thin Wall Packaging Market Revenue,
By End Use Industry, 2025 – 2032 (USD Million) …………..336
TABLE NO. 321. : Middle East Thin Wall Packaging Market Revenue, By
Country, 2018 – 2024 (Kilo Tons)………………………………..338
TABLE NO. 322. : Middle East Thin Wall Packaging Market Revenue, By
Country, 2025– 2032 (Kilo Tons) ……………………………….. 339
TABLE NO. 323. : Middle East Thin Wall Packaging Market Revenue, By
Country, 2018 – 2024 (USD Million)…………………………… 340
TABLE NO. 324. : Middle East Thin Wall Packaging Market Revenue, By
Country, 2025– 2032 (USD Million)……………………………. 341
TABLE NO. 325. : Middle East Thin Wall Packaging Market Revenue, By
Product Type, 2018 – 2024 (Kilo Tons)……………………….. 342
TABLE NO. 326. : Middle East Thin Wall Packaging Market Revenue, By
Product Type, 2025 – 2032 (Kilo Tons)……………………….. 343
TABLE NO. 327. : Middle East Thin Wall Packaging Market Revenue, By
Product Type, 2018 – 2024 (USD Million)……………………. 344
TABLE NO. 328. : Middle East Thin Wall Packaging Market Revenue, By
Product Type, 2025 – 2032 (USD Million)……………………. 345
TABLE NO. 329. : Middle East Thin Wall Packaging Market Revenue, By
Material Type, 2018 – 2024 (Kilo Tons)………………………. 346
TABLE NO. 330. : Middle East Thin Wall Packaging Market Revenue, By
Material Type, 2025 – 2032 (Kilo Tons)………………………. 347
TABLE NO. 331. : Middle East Thin Wall Packaging Market Revenue, By
Material Type, 2025 – 2032 (USD Million)…………………… 348
TABLE NO. 332. : Middle East Thin Wall Packaging Market Revenue, By
Material Type, 2018 – 2024 (USD Million)…………………… 348
TABLE NO. 333. : Middle East Thin Wall Packaging Market Revenue, By End
Use Industry, 2018 – 2024 (Kilo Tons)………………………… 349
TABLE NO. 334. : Middle East Thin Wall Packaging Market Revenue, By End
Use Industry, 2025 – 2032 (Kilo Tons)………………………… 349
TABLE NO. 335. : Middle East Thin Wall Packaging Market Revenue, By End
Use Industry, 2018 – 2024 (USD Million)…………………….. 350
GLOBAL THIN WALL PACKAGING MARKET, 2018 – 2032
38 | P a g e
TABLE NO. 336. : Middle East Thin Wall Packaging Market Revenue, By End
Use Industry, 2025 – 2032 (USD Million) ……………………..350
TABLE NO. 337. : GCC Thin Wall Packaging Market Revenue, By Product Type,
2018 – 2024 (Kilo Tons)……………………………………………..351
TABLE NO. 338. : GCC Thin Wall Packaging Market Revenue, By Product Type,
2025 – 2032 (Kilo Tons)……………………………………………..352
TABLE NO. 339. : GCC Thin Wall Packaging Market Revenue, By Product Type,
2018 – 2024 (USD Million) …………………………………………353
TABLE NO. 340. : GCC Thin Wall Packaging Market Revenue, By Product Type,
2025 – 2032 (USD Million) …………………………………………354
TABLE NO. 341. : GCC Thin Wall Packaging Market Revenue, By Material
Type, 2018 – 2024 (Kilo Tons)…………………………………….355
TABLE NO. 342. : GCC Thin Wall Packaging Market Revenue, By Material
Type, 2025 – 2032 (Kilo Tons)…………………………………….356
TABLE NO. 343. : GCC Thin Wall Packaging Market Revenue, By Material
Type, 2025 – 2032 (USD Million)…………………………………357
TABLE NO. 344. : GCC Thin Wall Packaging Market Revenue, By Material
Type, 2018 – 2024 (USD Million)…………………………………357
TABLE NO. 345. : GCC Thin Wall Packaging Market Revenue, By End Use
Industry, 2018 – 2024 (Kilo Tons) ……………………………….358
TABLE NO. 346. : GCC Thin Wall Packaging Market Revenue, By End Use
Industry, 2025 – 2032 (Kilo Tons) ……………………………….358
TABLE NO. 347. : GCC Thin Wall Packaging Market Revenue, By End Use
Industry, 2018 – 2024 (USD Million)……………………………359
TABLE NO. 348. : GCC Thin Wall Packaging Market Revenue, By End Use
Industry, 2025 – 2032 (USD Million)……………………………359
TABLE NO. 349. : Israel Thin Wall Packaging Market Revenue, By Product
Type, 2018 – 2024 (Kilo Tons)…………………………………….360
TABLE NO. 350. : Israel Thin Wall Packaging Market Revenue, By Product
Type, 2025 – 2032 (Kilo Tons)……………………………………. 361
TABLE NO. 351. : Israel Thin Wall Packaging Market Revenue, By Product
Type, 2018 – 2024 (USD Million) ……………………………….. 362
TABLE NO. 352. : Israel Thin Wall Packaging Market Revenue, By Product
Type, 2025 – 2032 (USD Million) ……………………………….. 363
TABLE NO. 353. : Israel Thin Wall Packaging Market Revenue, By Material
Type, 2018 – 2024 (Kilo Tons)……………………………………. 364
TABLE NO. 354. : Israel Thin Wall Packaging Market Revenue, By Material
Type, 2025 – 2032 (Kilo Tons)……………………………………. 365
TABLE NO. 355. : Israel Thin Wall Packaging Market Revenue, By Material
Type, 2025 – 2032 (USD Million) ……………………………….. 366
TABLE NO. 356. : Israel Thin Wall Packaging Market Revenue, By Material
Type, 2018 – 2024 (USD Million) ……………………………….. 366
TABLE NO. 357. : Israel Thin Wall Packaging Market Revenue, By End Use
Industry, 2018 – 2024 (Kilo Tons)………………………………. 367
TABLE NO. 358. : Israel Thin Wall Packaging Market Revenue, By End Use
Industry, 2025 – 2032 (Kilo Tons)………………………………. 367
TABLE NO. 359. : Israel Thin Wall Packaging Market Revenue, By End Use
Industry, 2018 – 2024 (USD Million)…………………………… 368
TABLE NO. 360. : Israel Thin Wall Packaging Market Revenue, By End Use
Industry, 2025 – 2032 (USD Million)…………………………… 368
TABLE NO. 361. : Turkey Thin Wall Packaging Market Revenue, By Product
Type, 2018 – 2024 (Kilo Tons)……………………………………. 369
TABLE NO. 362. : Turkey Thin Wall Packaging Market Revenue, By Product
Type, 2025 – 2032 (Kilo Tons)……………………………………. 370
TABLE NO. 363. : Turkey Thin Wall Packaging Market Revenue, By Product
Type, 2018 – 2024 (USD Million) ……………………………….. 371
GLOBAL THIN WALL PACKAGING MARKET, 2018 – 2032
39 | P a g e
TABLE NO. 364. : Turkey Thin Wall Packaging Market Revenue, By Product
Type, 2025 – 2032 (USD Million)…………………………………372
TABLE NO. 365. : Turkey Thin Wall Packaging Market Revenue, By Material
Type, 2018 – 2024 (Kilo Tons)…………………………………….373
TABLE NO. 366. : Turkey Thin Wall Packaging Market Revenue, By Material
Type, 2025 – 2032 (Kilo Tons)…………………………………….374
TABLE NO. 367. : Turkey Thin Wall Packaging Market Revenue, By Material
Type, 2025 – 2032 (USD Million)…………………………………375
TABLE NO. 368. : Turkey Thin Wall Packaging Market Revenue, By Material
Type, 2018 – 2024 (USD Million)…………………………………375
TABLE NO. 369. : Turkey Thin Wall Packaging Market Revenue, By End Use
Industry, 2018 – 2024 (Kilo Tons) ……………………………….376
TABLE NO. 370. : Turkey Thin Wall Packaging Market Revenue, By End Use
Industry, 2025 – 2032 (Kilo Tons) ……………………………….376
TABLE NO. 371. : Turkey Thin Wall Packaging Market Revenue, By End Use
Industry, 2018 – 2024 (USD Million)……………………………377
TABLE NO. 372. : Turkey Thin Wall Packaging Market Revenue, By End Use
Industry, 2025 – 2032 (USD Million)……………………………377
TABLE NO. 373. : Rest of Middle East Thin Wall Packaging Market Revenue,
By Product Type, 2018 – 2024 (Kilo Tons)…………………….378
TABLE NO. 374. : Rest of Middle East Thin Wall Packaging Market Revenue,
By Product Type, 2025 – 2032 (Kilo Tons)…………………….379
TABLE NO. 375. : Rest of Middle East Thin Wall Packaging Market Revenue,
By Product Type, 2018 – 2024 (USD Million) ………………..380
TABLE NO. 376. : Rest of Middle East Thin Wall Packaging Market Revenue,
By Product Type, 2025 – 2032 (USD Million) ………………..381
TABLE NO. 377. : Rest of Middle East Thin Wall Packaging Market Revenue,
By Material Type, 2018 – 2024 (Kilo Tons)……………………382
TABLE NO. 378. : Rest of Middle East Thin Wall Packaging Market Revenue,
By Material Type, 2025 – 2032 (Kilo Tons)………………….. 383
TABLE NO. 379. : Rest of Middle East Thin Wall Packaging Market Revenue,
By Material Type, 2025 – 2032 (USD Million)………………. 384
TABLE NO. 380. : Rest of Middle East Thin Wall Packaging Market Revenue,
By Material Type, 2018 – 2024 (USD Million)………………. 384
TABLE NO. 381. : Rest of Middle East Thin Wall Packaging Market Revenue,
By End Use Industry, 2018 – 2024 (Kilo Tons) ……………… 385
TABLE NO. 382. : Rest of Middle East Thin Wall Packaging Market Revenue,
By End Use Industry, 2025 – 2032 (Kilo Tons) ……………… 385
TABLE NO. 383. : Rest of Middle East Thin Wall Packaging Market Revenue,
By End Use Industry, 2018 – 2024 (USD Million)………….. 386
TABLE NO. 384. : Rest of Middle East Thin Wall Packaging Market Revenue,
By End Use Industry, 2025 – 2032 (USD Million)………….. 386
TABLE NO. 385. : Africa Thin Wall Packaging Market Revenue, By Country,
2018 – 2024 (Kilo Tons) ……………………………………………. 388
TABLE NO. 386. : Africa Thin Wall Packaging Market Revenue, By Country,
2025– 2032 (Kilo Tons) …………………………………………….. 389
TABLE NO. 387. : Africa Thin Wall Packaging Market Revenue, By Country,
2018 – 2024 (USD Million)………………………………………… 390
TABLE NO. 388. : Africa Thin Wall Packaging Market Revenue, By Country,
2025– 2032 (USD Million)…………………………………………. 391
TABLE NO. 389. : Africa Thin Wall Packaging Market Revenue, By Product
Type, 2018 – 2024 (Kilo Tons)……………………………………. 392
TABLE NO. 390. : Africa Thin Wall Packaging Market Revenue, By Product
Type, 2025 – 2032 (Kilo Tons)……………………………………. 393
TABLE NO. 391. : Africa Thin Wall Packaging Market Revenue, By Product
Type, 2018 – 2024 (USD Million) ……………………………….. 394
GLOBAL THIN WALL PACKAGING MARKET, 2018 – 2032
40 | P a g e
TABLE NO. 392. : Africa Thin Wall Packaging Market Revenue, By Product
Type, 2025 – 2032 (USD Million)…………………………………395
TABLE NO. 393. : Africa Thin Wall Packaging Market Revenue, By Material
Type, 2018 – 2024 (Kilo Tons)…………………………………….396
TABLE NO. 394. : Africa Thin Wall Packaging Market Revenue, By Material
Type, 2025 – 2032 (Kilo Tons)…………………………………….397
TABLE NO. 395. : Africa Thin Wall Packaging Market Revenue, By Material
Type, 2025 – 2032 (USD Million)…………………………………398
TABLE NO. 396. : Africa Thin Wall Packaging Market Revenue, By Material
Type, 2018 – 2024 (USD Million)…………………………………398
TABLE NO. 397. : Africa Thin Wall Packaging Market Revenue, By End Use
Industry, 2018 – 2024 (Kilo Tons) ……………………………….399
TABLE NO. 398. : Africa Thin Wall Packaging Market Revenue, By End Use
Industry, 2025 – 2032 (Kilo Tons) ……………………………….399
TABLE NO. 399. : Africa Thin Wall Packaging Market Revenue, By End Use
Industry, 2018 – 2024 (USD Million)……………………………400
TABLE NO. 400. : Africa Thin Wall Packaging Market Revenue, By End Use
Industry, 2025 – 2032 (USD Million)……………………………400
TABLE NO. 401. : South Africa Thin Wall Packaging Market Revenue, By
Product Type, 2018 – 2024 (Kilo Tons) ………………………..401
TABLE NO. 402. : South Africa Thin Wall Packaging Market Revenue, By
Product Type, 2025 – 2032 (Kilo Tons) ………………………..402
TABLE NO. 403. : South Africa Thin Wall Packaging Market Revenue, By
Product Type, 2018 – 2024 (USD Million)…………………….403
TABLE NO. 404. : South Africa Thin Wall Packaging Market Revenue, By
Product Type, 2025 – 2032 (USD Million)…………………….404
TABLE NO. 405. : South Africa Thin Wall Packaging Market Revenue, By
Material Type, 2018 – 2024 (Kilo Tons) ……………………….405
TABLE NO. 406. : South Africa Thin Wall Packaging Market Revenue, By
Material Type, 2025 – 2032 (Kilo Tons)………………………. 406
TABLE NO. 407. : South Africa Thin Wall Packaging Market Revenue, By
Material Type, 2025 – 2032 (USD Million)…………………… 407
TABLE NO. 408. : South Africa Thin Wall Packaging Market Revenue, By
Material Type, 2018 – 2024 (USD Million)…………………… 407
TABLE NO. 409. : South Africa Thin Wall Packaging Market Revenue, By End
Use Industry, 2018 – 2024 (Kilo Tons)………………………… 408
TABLE NO. 410. : South Africa Thin Wall Packaging Market Revenue, By End
Use Industry, 2025 – 2032 (Kilo Tons)………………………… 408
TABLE NO. 411. : South Africa Thin Wall Packaging Market Revenue, By End
Use Industry, 2018 – 2024 (USD Million)…………………….. 409
TABLE NO. 412. : South Africa Thin Wall Packaging Market Revenue, By End
Use Industry, 2025 – 2032 (USD Million)…………………….. 409
TABLE NO. 413. : Egypt Thin Wall Packaging Market Revenue, By Product
Type, 2018 – 2024 (Kilo Tons)……………………………………. 410
TABLE NO. 414. : Egypt Thin Wall Packaging Market Revenue, By Product
Type, 2025 – 2032 (Kilo Tons)……………………………………. 411
TABLE NO. 415. : Egypt Thin Wall Packaging Market Revenue, By Product
Type, 2018 – 2024 (USD Million) ……………………………….. 412
TABLE NO. 416. : Egypt Thin Wall Packaging Market Revenue, By Product
Type, 2025 – 2032 (USD Million) ……………………………….. 413
TABLE NO. 417. : Egypt Thin Wall Packaging Market Revenue, By Material
Type, 2018 – 2024 (Kilo Tons)……………………………………. 414
TABLE NO. 418. : Egypt Thin Wall Packaging Market Revenue, By Material
Type, 2025 – 2032 (Kilo Tons)……………………………………. 415
TABLE NO. 419. : Egypt Thin Wall Packaging Market Revenue, By Material
Type, 2025 – 2032 (USD Million) ……………………………….. 416
GLOBAL THIN WALL PACKAGING MARKET, 2018 – 2032
41 | P a g e
TABLE NO. 420. : Egypt Thin Wall Packaging Market Revenue, By Material
Type, 2018 – 2024 (USD Million)…………………………………416
TABLE NO. 421. : Egypt Thin Wall Packaging Market Revenue, By End Use
Industry, 2018 – 2024 (Kilo Tons) ……………………………….417
TABLE NO. 422. : Egypt Thin Wall Packaging Market Revenue, By End Use
Industry, 2025 – 2032 (Kilo Tons) ……………………………….417
TABLE NO. 423. : Egypt Thin Wall Packaging Market Revenue, By End Use
Industry, 2018 – 2024 (USD Million)……………………………418
TABLE NO. 424. : Egypt Thin Wall Packaging Market Revenue, By End Use
Industry, 2025 – 2032 (USD Million)……………………………418
TABLE NO. 425. : Rest of Africa Thin Wall Packaging Market Revenue, By
Product Type, 2018 – 2024 (Kilo Tons) ………………………..419
TABLE NO. 426. : Rest of Africa Thin Wall Packaging Market Revenue, By
Product Type, 2025 – 2032 (Kilo Tons) ………………………..420
TABLE NO. 427. : Rest of Africa Thin Wall Packaging Market Revenue, By
Product Type, 2018 – 2024 (USD Million)…………………….421
TABLE NO. 428. : Rest of Africa Thin Wall Packaging Market Revenue, By
Product Type, 2025 – 2032 (USD Million)…………………….422
TABLE NO. 429. : Rest of Africa Thin Wall Packaging Market Revenue, By
Material Type, 2018 – 2024 (Kilo Tons)………………………. 423
TABLE NO. 430. : Rest of Africa Thin Wall Packaging Market Revenue, By
Material Type, 2025 – 2032 (Kilo Tons)………………………. 424
TABLE NO. 431. : Rest of Africa Thin Wall Packaging Market Revenue, By
Material Type, 2025 – 2032 (USD Million)…………………… 425
TABLE NO. 432. : Rest of Africa Thin Wall Packaging Market Revenue, By
Material Type, 2018 – 2024 (USD Million)…………………… 425
TABLE NO. 433. : Rest of Africa Thin Wall Packaging Market Revenue, By End
Use Industry, 2018 – 2024 (Kilo Tons)………………………… 426
TABLE NO. 434. : Rest of Africa Thin Wall Packaging Market Revenue, By End
Use Industry, 2025 – 2032 (Kilo Tons)………………………… 426
TABLE NO. 435. : Rest of Africa Thin Wall Packaging Market Revenue, By End
Use Industry, 2018 – 2024 (USD Million)…………………….. 427
TABLE NO. 436. : Rest of Africa Thin Wall Packaging Market Revenue, By End
Use Industry, 2025 – 2032 (USD Million)…………………….. 427

Request Free Sample

Ready to Transform Data into Decisions?

Request Your Sample Report and Start Your Journey of Informed Choices


Providing the strategic compass for industry titans.

cr-clients-logos

Frequently Asked Question:

What is the projected growth rate of the thin wall packaging market?

The market is projected to grow at a CAGR of 6.1% from 2024 to 2032.

What will the market size be in 2032?

The market is expected to reach USD 70,524.33 million by 2032.

Which regions are leading in thin wall packaging market growth?

Asia-Pacific leads due to population density and urbanization, followed by Europe with its focus on sustainable packaging solutions.

What challenges does the thin wall packaging market face?

High raw material costs, stringent environmental regulations, and limited recycling infrastructure are significant challenges.

About Author

Rajdeep Kumar Deb

Rajdeep Kumar Deb

Lead Analyst – Consumer & Finance

Rajdeep brings a decade of consumer goods and financial services insight to strategic market analysis.

View Profile

Related Reports

Second-Hand Fashion Market

The Second-Hand Fashion Market was valued at USD 190 billion in 2024 and is projected to reach USD 422.3 billion by 2032, expanding at a CAGR of 10.5% during the forecast period.

Passenger Tire Market

The Passenger Tire Market was valued at USD 156.1 billion in 2024 and is projected to reach USD 210.3 billion by 2032, expanding at a CAGR of 3.8% during the forecast period.

Passenger Vehicles Market

The Passenger Vehicles Market was valued at USD 1705.2 billion in 2024 and is anticipated to reach USD 2805.1 billion by 2032, growing at a CAGR of 6.42% during the forecast period.

Operator Training Simulator Market

Operator Training Simulator Market size was valued at USD 12.4 billion in 2024 and is anticipated to reach USD 35.7 billion by 2032, at a CAGR of 14.1% during the forecast period.

UK Anesthesia Breathing Filters Market

The UK Anesthesia Breathing Filters Market size was valued at USD 3.75 million in 2018 to USD 4.68 million in 2024 and is anticipated to reach USD 6.35 million by 2032, at a CAGR of 3.60% during the forecast period.

Secure Logistics Market

Secure Logistics Market size was valued at USD 88 billion in 2024 and is anticipated to reach USD 136.2 billion by 2032, at a CAGR of 5.62% during the forecast period.

Zeolite Molecular Sieve Market

The Zeolite Molecular Sieve Market size was valued at USD 4609.8 million in 2024 and is anticipated to reach USD 7744.6 million by 2032, at a CAGR of 6.7% during the forecast period (2024-2032).

Non-Alcoholic Beer Market

The Non-Alcoholic Beer Market size was valued at USD 19 million in 2024 and is projected to reach USD 34.4 million by 2032, expanding at a CAGR of 7.7% during the forecast period.

Non-Alcoholic RTD Beverages Market

The Non-Alcoholic RTD Beverages Market was valued at USD 760.6 million in 2024 and is anticipated to reach USD 1178 million by 2032, growing at a CAGR of 5.62% during the forecast period.

Purchase Options

The report comes as a view-only PDF document, optimized for individual clients. This version is recommended for personal digital use and does not allow printing. Use restricted to one purchaser only.
$4999

To meet the needs of modern corporate teams, our report comes in two formats: a printable PDF and a data-rich Excel sheet. This package is optimized for internal analysis. Unlimited users allowed within one corporate location (e.g., regional office).
$6999

The report will be delivered in printable PDF format along with the report’s data Excel sheet. This license offers 100 Free Analyst hours where the client can utilize Credence Research Inc. research team. Permitted for unlimited global use by all users within the purchasing corporation, such as all employees of a single company.
$12999

Credence Staff 3

WILLIAM, North America

Support Staff at Credence Research

KEITH PHILLIPS, Europe

Lee - CR Sales Staff

LEE VALLANCE, Asia Pacific

Kieran Jameson

KIERAN JAMESON, Australia

Report delivery within 24 to 48 hours

User Review

Thank you for the data! The numbers are exactly what we asked for and what we need to build our business case.

Materials Scientist
(privacy requested)

User Review

The report was an excellent overview of the Industrial Burners market. This report does a great job of breaking everything down into manageable chunks.

Imre Hof
Management Assistant, Bekaert

cr-clients-logos

Request Sample