
Market Overview:
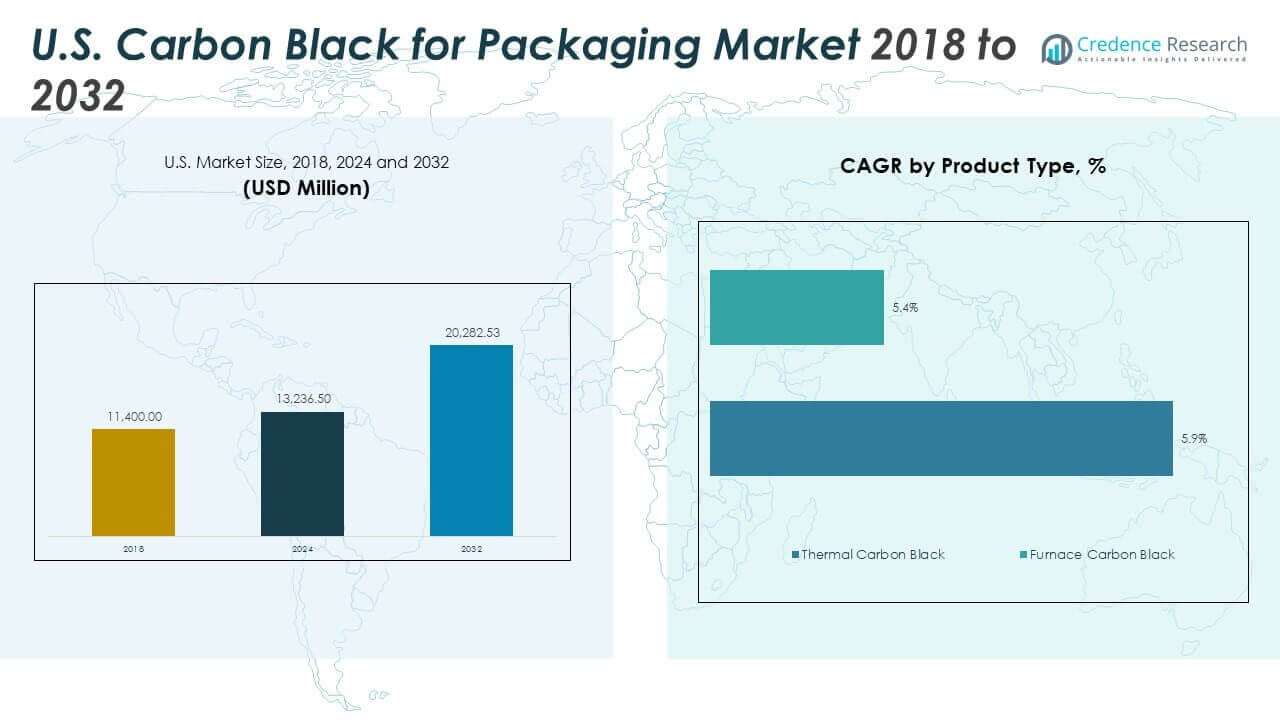
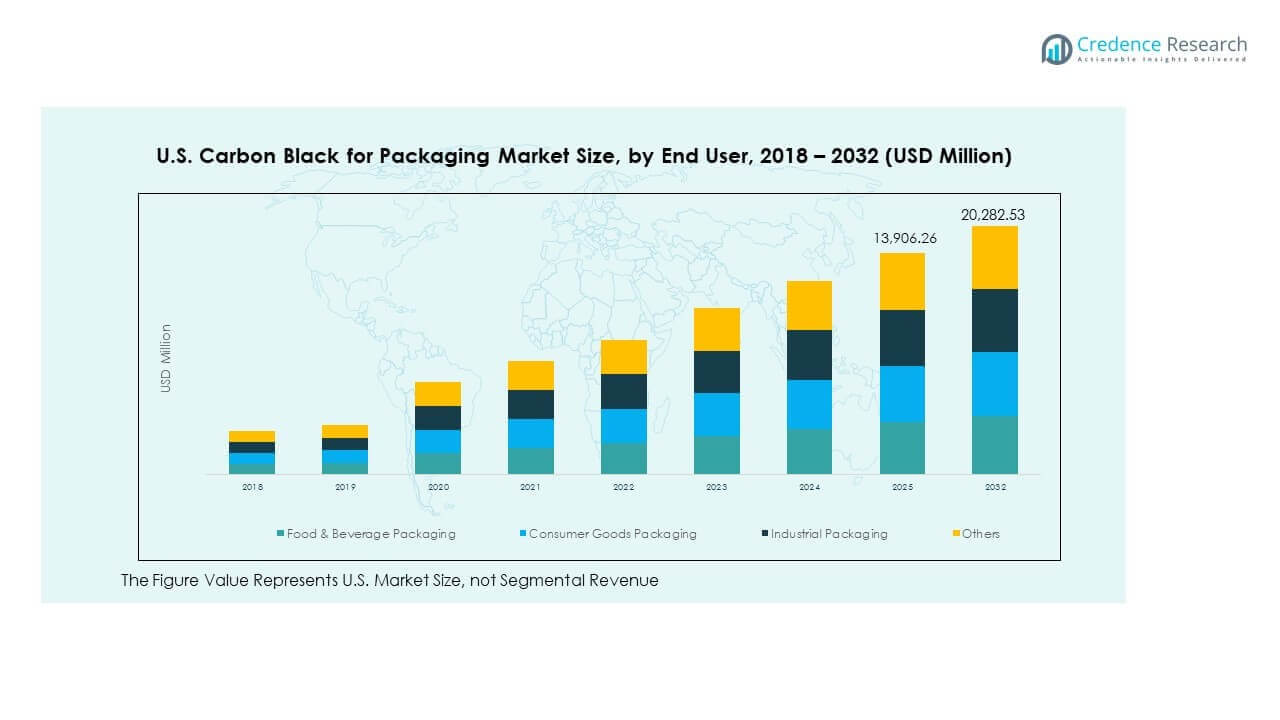
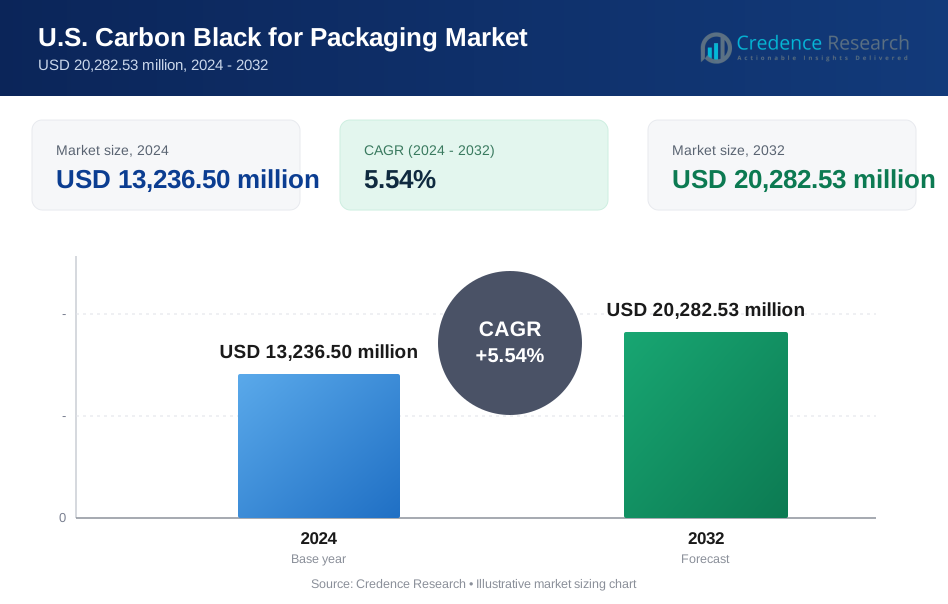
The U.S. Carbon Black for Packaging Market size was valued at USD 11,400.00 million in 2018, reached USD 13,236.50 million in 2024, and is anticipated to reach USD 20,282.53 million by 2032, at a CAGR of 5.54% during the forecast period.
| REPORT ATTRIBUTE | DETAILS |
|---|---|
| Historical Period | 2020-2023 |
| Base Year | 2024 |
| Forecast Period | 2025-2032 |
| U.S. Carbon Black for Packaging Market Size 2024 | USD 13,236.50 million |
| U.S. Carbon Black for Packaging Market, CAGR | 5.54% |
| U.S. Carbon Black for Packaging Market Size 2032 | USD 20,282.53 million |
The market is gaining momentum due to rising demand for UV-resistant and high-durability packaging across food, industrial, and healthcare sectors. Carbon black enhances packaging strength, visual appeal, and shelf stability. Brand owners prefer black additives that work with both virgin and recycled polymers to align with sustainability goals. It supports anti-static, opaque, and impact-resistant features critical to modern packaging. The adoption of rigid containers, films, trays, and clamshells continues to expand across e-commerce and cold-chain logistics. Packaging manufacturers increasingly invest in custom formulations to meet product safety and performance expectations.
Regionally, the Midwest and Southern U.S. lead the market due to strong industrial manufacturing and large-scale packaging operations. These regions benefit from proximity to raw material suppliers and chemical processors. The Northeast shows high demand in food, pharmaceutical, and biotech segments, driven by urban density and healthcare hubs. The Western U.S. is an emerging growth zone, driven by sustainability regulations, innovation hubs, and rising consumer goods demand. States like California are pushing for near-infrared detectable carbon black to improve recyclability. Each region contributes distinct dynamics, shaping the national market’s expansion path.
Market Insights
- The U.S. Carbon Black for Packaging Market was valued at USD 11,400.00 million in 2018, reached USD 13,236.50 million in 2024, and is projected to hit USD 20,282.53 million by 2032, growing at 5.54% from 2024 to 2032.
- The Midwest and Southern U.S. jointly lead with 45% share, driven by strong industrial manufacturing and packaging production. The Northeast holds 28% share, supported by food and healthcare demand. The Western U.S. follows with 27%, influenced by regulatory sustainability mandates and high retail packaging consumption.
- The Western U.S. is the fastest-growing region due to innovation hubs, recyclability goals, and rising demand from electronics, retail, and food sectors.
- Furnace carbon black dominates with 5.9% growth, driven by high-performance needs in rigid and structural packaging applications.
- Thermal carbon black grows at 5.4%, supporting flexible films, shrink wraps, and applications requiring smooth dispersion and aesthetic finish.
Market Drivers
Rising Demand for UV-Resistant Packaging Across Food, Chemical, and Industrial Sectors
The need for packaging that protects against UV damage is driving carbon black use. UV resistance prevents product degradation and extends shelf life for perishable goods. In the U.S. Carbon Black for Packaging Market, food and chemical manufacturers prefer black polymers that provide superior shielding. It enhances packaging durability in outdoor and logistics applications. Industrial sectors rely on carbon black for surface protection in transit. Retailers demand packaging that withstands warehouse lighting and exposure. E-commerce and long-haul distribution also require better product integrity. This drives consistent demand from packaging converters and polymer processors. It supports increased production and customized material solutions.
Growing Preference for High-Performance Additives in Rigid and Flexible Packaging Formats
Carbon black improves tensile strength, opacity, and anti-static properties in both rigid and flexible packaging. Plastic packaging manufacturers rely on it to meet strength requirements without increasing thickness. In the U.S. Carbon Black for Packaging Market, this supports lower material usage and reduced costs. It enhances processing performance across extrusion and injection molding operations. Brands seek packaging with sleek appearance and high contrast for labeling. Anti-static behavior also supports electronics and sensitive product packaging. Durable black films and containers enable longer shelf storage. Processors benefit from consistent product behavior during large-scale runs. It meets functional, aesthetic, and safety needs across multiple applications.
- For instance, Cabot's ELFTEX 570 specialty carbon black delivers superior UV and weatherability performance in 55 µm LDPE films at 2.5% loading, outperforming standard grades in accelerated weathering tests up to 1250 hours.
Sustainability Pressures Driving Adoption of Recyclable and Lightweight Materials Enhanced with Carbon Black
Sustainable packaging practices are influencing material formulation strategies. Carbon black allows manufacturers to maintain strength while reducing material thickness. The U.S. Carbon Black for Packaging Market benefits from brands aiming to cut plastic weight per unit. It helps maintain packaging utility even in post-consumer recycled content. Black packaging with optimized content supports circular economy goals. Regulatory pressure to lower single-use plastic volumes is intensifying. Recyclers prefer black additives compatible with optical sorting. This increases demand for near-infrared detectable carbon black types. Manufacturers innovate to meet environmental standards without sacrificing product protection.
- For instance, Orion Engineered Carbons' specialty blacks support low-PAH formulations compatible with recycled content, enabling lighter films while preserving opacity and strength in post-consumer blends.
Regulatory Compliance and Safety Requirements Supporting Broader Adoption Across Packaged Goods
Strict FDA and USDA packaging standards require stable, non-leaching additives. Carbon black meets many of these regulatory requirements in food-contact and pharmaceutical packaging. The U.S. Carbon Black for Packaging Market benefits from these stable, safe applications. It provides high-performance colorants that do not degrade during storage or use. Suppliers develop compliant formulations with traceable batch performance. Packaging used in healthcare and pharmaceuticals must maintain integrity under stress. Carbon black supports that structural performance while meeting purity criteria. It continues to gain preference among regulatory-conscious brands and suppliers. Compliance enhances trust and supports repeat procurement.
Market Trends
Emergence of Sustainable Carbon Black Derived from Renewable or Recovered Feedstocks
Manufacturers are shifting toward eco-friendly carbon black alternatives. These grades use recovered oils, biomass, or tire pyrolysis oils as feedstocks. In the U.S. Carbon Black for Packaging Market, sustainability metrics are shaping material selection. It encourages the adoption of low-carbon, circular economy-compatible inputs. Brands aim to reduce fossil-derived content in packaging. Bio-based black pigments support lower emissions across the supply chain. Recovered carbon black reduces industrial waste while maintaining functional strength. Packaging buyers align with ESG goals by sourcing from sustainable suppliers. It leads to differentiated product portfolios and greener brand identities.
Increased Customization of Carbon Black Grades for Specific Polymer Compatibility and Color Consistency
Packaging designers now require precise color control and compatibility with a range of polymers. Custom carbon black grades offer improved dispersion and color depth in polypropylene, polyethylene, and PET. The U.S. Carbon Black for Packaging Market includes black masterbatches tailored for these materials. Brands seek consistent shades across product lines and packaging types. Processors benefit from reduced cycle time and uniform product aesthetics. Newer grades minimize agglomeration during processing and improve final film quality. High jetness levels are in demand for premium packaging visuals. Customization supports both brand visibility and technical reliability. It strengthens supplier relationships across packaging chains.
Rising Focus on Smart Packaging Integration with Conductive Carbon Black for Anti-Counterfeiting and Traceability
Smart packaging features are becoming integral to product security and supply chain transparency. Conductive carbon black enables packaging to carry electrical or magnetic signals. In the U.S. Carbon Black for Packaging Market, this trend supports anti-counterfeit labels and interactive packaging. Brands integrate RFID, NFC, or QR technologies using carbon-black-based ink formulations. Smart packaging adoption improves traceability across storage and delivery. It allows real-time tracking of sensitive items like pharmaceuticals or electronics. Processors now explore conductive compounds for intelligent labeling systems. High-performance carbon blacks support electronic conductivity without compromising packaging integrity. It opens new functionality in industrial and consumer packaging.
- For instance, Sid Richardson Carbon's Conductex® series, produced at its Big Spring, Texas facility, is engineered for conductive applications such as inks and coatings requiring electrical conductivity.
Growing Investments in U.S.-Based Production Facilities and Localized Supply Chains
Domestic production expansion helps stabilize supply and reduce import reliance. Key carbon black producers are investing in new plants or upgrading facilities across the U.S. The U.S. Carbon Black for Packaging Market benefits from stronger local supply chains. It reduces lead times and logistics costs for packaging manufacturers. Local sourcing supports just-in-time production strategies. Government incentives promote onshoring of critical chemical feedstocks. Companies secure long-term supply contracts with packaging converters. Regional production improves responsiveness to regulatory changes and customer demands. It fosters resilience and operational efficiency in the packaging sector.
- For instance, Orion Engineered Carbons completed emissions control upgrades at its U.S. plants in Ohio, Texas, and Louisiana by 2024, strengthening its environmental compliance and sustainability profile.
Market Challenges Analysis
Environmental Regulations and Recyclability Issues Surrounding Black Pigments in Plastic Packaging
Packaging made with carbon black often faces recyclability limitations due to detection challenges in optical sorting systems. Standard black pigments absorb infrared signals, making them undetectable by sorting equipment. The U.S. Carbon Black for Packaging Market faces regulatory scrutiny over this recycling bottleneck. Brands aim to meet recycling mandates but struggle with black packaging compliance. Municipal recyclers demand packaging designed for circularity, impacting product design. Non-detectable grades restrict participation in closed-loop systems. It drives tension between visual branding and material recovery goals. Innovations in near-infrared detectable pigments are progressing but face high cost barriers. Widespread adoption remains limited without large-scale infrastructure upgrades.
Volatility in Raw Material Supply and Price Fluctuations Affecting Production Stability
Carbon black production relies on feedstocks like coal tar, oil, or natural gas derivatives, which often see high price fluctuations. Feedstock cost volatility affects profit margins for manufacturers and converters. The U.S. Carbon Black for Packaging Market experiences production planning challenges when input prices spike. Long-term contracts become harder to negotiate due to unpredictable sourcing costs. International tensions and trade barriers further strain supply chain predictability. Smaller processors struggle with adapting to rapid cost shifts. Strategic inventory management becomes essential to absorb shocks. Manufacturers must balance performance quality with cost optimization. This affects pricing strategies for end-use packaging.
Market Opportunities
Expansion in Biodegradable Plastic Packaging Integrated with Safe and Sustainable Carbon Black Grades
Biodegradable plastics are gaining ground across food service, cosmetics, and household packaging. The U.S. Carbon Black for Packaging Market has room to grow by supplying compatible grades for bio-based polymers. Carbon black producers now design additives that maintain printability and opacity in biodegradable materials. This helps brands offer sustainable packaging without compromising function. Packaging startups in compostable solutions seek reliable colorants that meet safety regulations. It opens niche growth for eco-friendly black formulations in new material categories.
Growth Potential in Specialty Packaging for Electronics, Defense, and Hazardous Goods Requiring Antistatic Properties
Antistatic packaging protects sensitive products during storage and transport. Conductive carbon black formulations help maintain safety in defense-grade and high-voltage components. The U.S. Carbon Black for Packaging Market benefits from specialized demand in such sectors. It supports packaging that meets strict static dissipation standards. Growth in electronics and EV battery logistics creates new applications. Carbon black suppliers can target converters offering niche protective packaging formats.
Market Segmentation Analysis
By Product Type
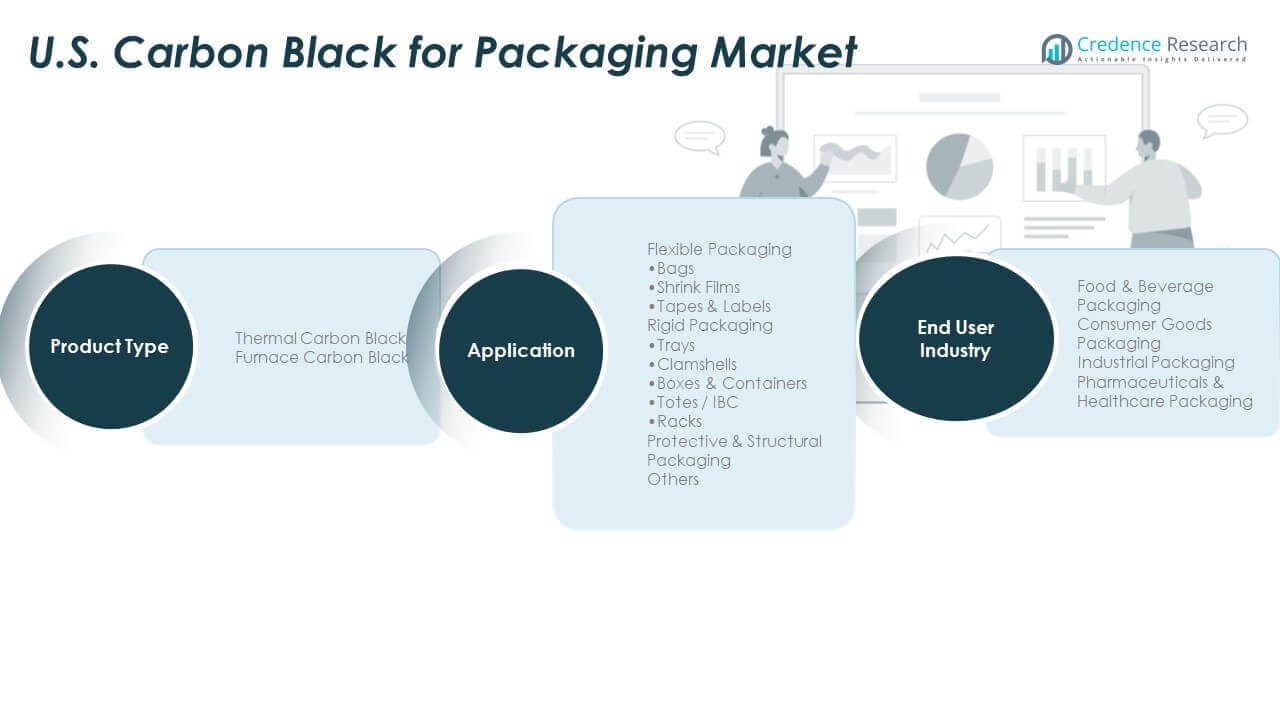
Thermal carbon black supports low-structure applications with excellent dispersion and color uniformity. It finds steady use in film and flexible packaging where surface appearance matters. Its lower conductivity suits food and consumer goods packaging. Furnace carbon black dominates the U.S. Carbon Black for Packaging Market due to its higher tint strength and reinforcement properties. It performs well in rigid containers and structural packaging. Furnace black also improves UV resistance and durability under transit stress. Suppliers focus on grade optimization for cost-performance balance. Both types cater to distinct needs across polymer blends.
- For instance, Cabot’s BLACK PEARLS® 120 is a general-purpose carbon black known for its blue undertone and ease of dispersion, commonly used in molded plastics and utility films where economical opacity is required.
By Application
Flexible packaging leads demand due to high-volume consumption across retail, food, and industrial use. Carbon black enhances opacity and protection in bags, shrink films, and label applications. The U.S. Carbon Black for Packaging Market supports film processors with high jetness and consistent dispersion grades. Rigid packaging segments, including trays, clamshells, and containers, rely on carbon black for surface durability and color depth. Totes, IBCs, and racks require strong anti-static and UV-resistant properties. Protective and structural packaging use reinforced black polymers for heavy-duty goods and transport needs. Specialty applications continue to expand in logistics and e-commerce supply chains.
By End User Industry
Food and beverage packaging remains a primary end-use, driven by freshness preservation and visual appeal. Carbon black offers light shielding and high contrast printability. Consumer goods packaging demands aesthetic appeal and structural stability, favoring carbon black-enhanced materials. The U.S. Carbon Black for Packaging Market also sees strong uptake in industrial packaging, where black polymers offer rugged protection. Pharmaceuticals and healthcare sectors adopt carbon black formulations that meet compliance and safety standards. Each sector values different performance attributes, supporting tailored product development.
- For instance, Orion’s PRINTEX® 140 V offers a pour density of approximate 160 g/l, ensuring uniform dispersion and deep black tone for high-contrast printing in beverage label applications.
Segmentation
By Product Type
- Thermal Carbon Black
- Furnace Carbon Black
By Application
- Flexible PackagingBags
- Shrink Films
- Tapes & Labels
- Rigid PackagingTrays
- Clamshells
- Boxes & Containers
- Totes / IBC
- Racks
- Protective & Structural Packaging
- Others
By End User Industry
- Food & Beverage Packaging
- Consumer Goods Packaging
- Industrial Packaging
- Pharmaceuticals & Healthcare Packaging
Regional Analysis
Northeast United States: High Demand from Food and Healthcare Sectors
The Northeast accounts for around 28% of the U.S. Carbon Black for Packaging Market. Dense urban areas such as New York and Boston support strong demand from food, pharmaceutical, and consumer goods packaging. The region has a mature retail network and advanced logistics systems, driving high consumption of flexible packaging films and labels. Healthcare packaging applications are robust due to a strong presence of hospitals and biotech hubs. Carbon black’s role in improving packaging integrity and visual appeal remains critical. Companies in the region also align with sustainability regulations, increasing adoption of advanced recyclable materials. The market benefits from early technology adoption and strong procurement networks.
Midwest and Southern U.S.: Dominant Production Base and Industrial Packaging Usage
The Midwest and South together contribute approximately 45% of the market share. These subregions host a high concentration of plastic converters, industrial manufacturers, and packaging producers. States like Texas, Ohio, and Illinois serve as key production zones for rigid containers, trays, and heavy-duty packaging materials. The U.S. Carbon Black for Packaging Market in these regions benefits from proximity to raw materials and infrastructure for chemical processing. Demand is driven by industrial packaging for automotive, machinery, and agricultural exports. Furnace carbon black dominates due to its structural reinforcement properties. Regional manufacturers prioritize performance and cost-efficiency over branding aesthetics.
Western United States: Emerging Growth Driven by Consumer Goods and Sustainability Focus
The West holds roughly 27% of the total market share. California leads packaging innovation with strong demand from electronics, cosmetics, and organic food sectors. The region's strict environmental regulations support the shift toward sustainable and recyclable black pigment technologies. The U.S. Carbon Black for Packaging Market in this area benefits from growing adoption of near-infrared detectable grades for better recycling compatibility. Flexible packaging demand remains high, particularly in e-commerce and ready-to-eat food segments. States like Washington and Oregon show rising consumption across retail packaging and smart labeling applications. The western U.S. is a key growth frontier for eco-focused packaging solutions.
Key Player Analysis
Competitive Analysis
The U.S. Carbon Black for Packaging Market is moderately consolidated, led by key players such as Cabot Corporation and Birla Carbon USA, Inc. These companies benefit from strong domestic production, technical expertise, and long-term supply contracts with major packaging converters. Their focus on developing high-performance furnace black grades supports broad usage across rigid containers, films, and structural packaging. Competitive strength comes from consistent product quality, regulatory compliance, and responsive supply chains. R&D investment is a key differentiator, especially in near-infrared detectable black grades for improved recyclability. Companies with sustainable product portfolios gain preference from packaging firms seeking environmental alignment. Customization by polymer type, including compatibility with polyethylene, polypropylene, and PET, supports segment-specific adoption. Technical service and logistics capabilities further enhance competitiveness. The U.S. Carbon Black for Packaging Market also sees small and mid-sized players entering specialized segments such as antistatic packaging or eco-friendly packaging solutions. However, high capital requirements and strict food-contact regulations limit fast entry.
Recent Developments
- In September 2025, Birla Carbon showcased high-performance carbon black and sustainable solutions like Continua™ SCM at the Global Polymer Summit 2025 relevant to U.S. packaging through improved material performance and circular economy options.
- In August 2025, Cabot Corporation announced its acquisition of a carbon black facility from Bridgestone in Mexico enhancing its production capacity which supports applications including carbon black for packaging markets in the U.S.
Report Coverage
The research report offers an in-depth analysis based on Product Type, Application and End User Industry. It details leading market players, providing an overview of their business, product offerings, investments, revenue streams, and key applications. Additionally, the report includes insights into the competitive environment, SWOT analysis, current market trends, as well as the primary drivers and constraints. Furthermore, it discusses various factors that have driven market expansion in recent years. The report also explores market dynamics, regulatory scenarios, and technological advancements that are shaping the industry. It assesses the impact of external factors and global economic changes on market growth. Lastly, it provides strategic recommendations for new entrants and established companies to navigate the complexities of the market.
Future Outlook
- Demand will remain strong due to sustained use of plastic packaging across food, consumer, and industrial sectors nationwide.
- Sustainability goals will push wider adoption of recyclable and near‑infrared detectable carbon black grades.
- Flexible packaging will continue to expand, supported by growth in e‑commerce, retail distribution, and convenience foods.
- Rigid packaging will see steady uptake in industrial and bulk handling applications requiring durability and UV resistance.
- Innovation will focus on carbon black grades compatible with recycled and bio‑based polymers.
- Domestic production expansion will strengthen supply chain reliability and reduce import dependence.
- Customization by polymer type will gain importance for packaging converters seeking consistent processing performance.
- Regulatory compliance for food and healthcare packaging will shape product development strategies.
- Smart and antistatic packaging applications will open new demand avenues in electronics and pharmaceuticals.
- Competitive advantage will favor suppliers combining technical support, sustainability alignment, and scalable manufacturing.
Request a Free Sample
Fill in your details and we'll send you a free sample report.
- Sample data tables & charts
- Research methodology
Need a Custom Version of This Report?
Tailor the scope, geography, or segments to your exact requirements.
- Custom geography or segment scope
- Direct access to our analyst team
Frequently Asked Questions
What is the current market size for U.S. Carbon Black for Packaging Market, and what is its projected size in 2032?
At what Compound Annual Growth Rate is the U.S. Carbon Black for Packaging Market projected to grow between 2024 and 2032?
Which U.S. Carbon Black for Packaging Market segment held the largest share in 2024?
What are the primary factors fueling the growth of the U.S. Carbon Black for Packaging Market?
Who are the leading companies in the U.S. Carbon Black for Packaging Market?
Which region commanded the largest share of the U.S. Carbon Black for Packaging Market in 2024?
Table of Content
Chapter 1. Report Introduction
- 1.1 Report Description & Purpose
- 1.1.1 Report Title & Market Definition
- 1.1.2 Unique Selling Propositions (USP) & Key Differentiators
- 1.1.3 Value Proposition for Stakeholders
- 1.2 Research Objectives
- 1.2.1 Market Sizing Objectives (Volume & Revenue)
- 1.2.2 Segmentation Objectives
- 1.2.3 Competitive Intelligence Objectives
- 1.2.4 Forecast & Scenario Objectives
- 1.3 Report Scope
- 1.3.1 U.S. Carbon Black for Packaging Scope – Types & Subtypes Covered
- 1.3.2 Geographic Scope – Regions & Countries Covered
- 1.3.3 Historical Period, Base Year & Forecast Period (2024; forecast to 2032)
- 1.3.4 Inclusions & Exclusions
- 1.4 HS Code & Classification Framework
- 1.5 Currency, Units & Pricing Basis
- 1.6 Target Stakeholders
- 1.7 Limitations & Assumptions
Chapter 2. Executive Summary
- 2.1 Global U.S. Carbon Black for Packaging Market Snapshot
- 2.1.1 Market Size – Historical (2024) & Forecast (2024-2032) (2024: USD 13,236.50 million → 2032: USD 20,282.53 million)
- 2.1.2 Volume & Revenue – Global Totals
- 2.1.3 Key Market Highlights – Top Five Facts
- 2.2 U.S. Carbon Black for Packaging Market Segmentation Snapshot
- 2.2.1 Market Split by Region – 2024 vs. 2032
- 2.3 Competitive Snapshot
- 2.3.1 Top 10 Players by Revenue Share – 2024
- 2.3.2 Top 10 Players by Volume Share – 2024
- 2.3.3 Recent Strategic Developments (18-Month Summary)
- 2.4 Key Investment Highlights & Strategic Conclusions
Chapter 3. U.S. Carbon Black for Packaging Market Dynamics & Industry Analysis
- 3.1 Market Overview & Context
- 3.1.1 U.S. Carbon Black for Packaging Market Position in the Broader Automotive Value Chain
- 3.1.2 OEM vs. Replacement Market Dynamics
- 3.1.3 Market Maturity & Development Stage by Region
- 3.2 U.S. Carbon Black for Packaging Market Drivers
- 3.3 U.S. Carbon Black for Packaging Market Restraints & Challenges
- 3.4 U.S. Carbon Black for Packaging Market Opportunities
- 3.5 Porter's Five Forces Analysis
- 3.5.1 Threat of New Entrants
- 3.5.2 Bargaining Power of Suppliers
- 3.5.3 Bargaining Power of Buyers
- 3.5.4 Threat of Substitutes
- 3.5.5 Competitive Rivalry – Intensity Assessment
- 3.6 U.S. Carbon Black for Packaging Value Chain Analysis
- 3.6.1 Upstream – Raw Material/Input Suppliers
- 3.6.1.1 Raw Material/Input 1
- 3.6.1.2 Raw Material/Input 2
- 3.6.1.3 Raw Material/Input 3
- 3.6.2 Midstream – Production/Manufacturing/Service Delivery
- 3.6.2.1 Production/Process Overview
- 3.6.2.2 Key Facility Locations & Capacity by Manufacturer
- 3.6.3 Downstream – Distribution & End Consumer
- 3.6.3.1 Primary Channel – B2B/OEM
- 3.6.3.2 Secondary Channels – Dealer, Retail, Online, Direct
- 3.6.4 Value Chain Profitability Analysis
- 3.6.1 Upstream – Raw Material/Input Suppliers
- 3.7 PESTEL Analysis
- 3.7.1 Political Factors
- 3.7.2 Economic Factors
- 3.7.3 Social Factors
- 3.7.4 Technological Factors
- 3.7.5 Environmental Factors
- 3.7.6 Legal Factors
- 3.8 U.S. Carbon Black for Packaging Supply Chain Analysis
- 3.8.1 Raw Material/Input Supply Risk Assessment
- 3.8.2 Manufacturing Concentration Risk (Geographic Exposure)
- 3.8.3 Trade Disruption Impact Analysis
- 3.9 Regulatory & Policy Landscape
Note: The regulatory and policy landscape section covers regulations based on their applicability to the market, U.S. Carbon Black for Packaging category, geography, and scope of the study. Only regulatory frameworks with a material impact on operations, compliance, trade, sustainability, or market access are analyzed in detail.
Chapter 4. Key Investment Pockets & Opportunity Analysis
- 4.1 U.S. Carbon Black for Packaging Market Attractiveness Analysis
- 4.1.1 By Region – Investment Attractiveness Matrix (Volume × CAGR)
- 4.2 Absolute Revenue Growth Opportunity
- 4.2.1 By Region – Absolute USD Growth Through 2032
- 4.3 Incremental Volume Opportunity
- 4.3.1 By Region – Incremental Volume Through 2032
- 4.3.2 Segment – Incremental Volume
- 4.4 Emerging Submarket Opportunity Deep Dive (Subject to Applicability)
- 4.5 Emerging Market Opportunity Scorecards
- 4.5.1 United States
- 4.5.2 Europe
- 4.5.3 Asia
- 4.5.4 Middle East & Africa
Note: Emerging Market Opportunity Scorecards will be included based on relevance and strategic importance. Regions listed are indicative and may vary depending on data availability and market dynamics.
Chapter 5. U.S. Carbon Black for Packaging Import-Export Analysis & Trade Flows
- 5.1 Global Trade Overview
- 5.1.1 Global Export Value by Country (2024)
- 5.1.2 Global Export Volume by Country (2024)
- 5.1.3 Global Import Value by Country (2024)
- 5.1.4 Global Import Volume by Country (2024)
- 5.1.5 Net Trade Balance by Country (2024)
- 5.2 Export Analysis – Segment
- 5.2.1 Type 1 (HS Code)
- 5.2.2 Type 2 (HS Code)
- 5.2.3 Type 3 (HS Code)
- 5.2.4 Type 4 (HS Code)
- 5.2.5 Type 5 (HS Code)
- 5.3 Import Analysis – Segment
- 5.3.1 Type 1 (HS Code)
- 5.3.2 Type 2 (HS Code)
- 5.3.3 Type 3 (HS Code)
- 5.3.4 Type 4 (HS Code)
- 5.3.5 Type 5 (HS Code)
- 5.4 Average Unit Trade Prices
- 5.4.1 Average Export Price – Segment & Country
- 5.4.2 Average Import Price – Segment & Source Country
- 5.4.3 Price Trends (2024)
- 5.5 Key Trade Route Analysis
- 5.5.1 Trade Route 1
- 5.5.2 Trade Route 2
- 5.5.3 Trade Route 3
- 5.5.4 Trade Route 4
- 5.5.5 Trade Route 5
- 5.6 Trade Policy Impact Assessment
- 5.6.1 US Anti-Dumping & Section 301 Tariffs
- 5.6.2 EU Customs Union Impact
- 5.6.3 Major Free Trade Agreements
- 5.6.4 USMCA Rules of Origin
Note: Trade policy analysis will be included only where relevant to the U.S. Carbon Black for Packaging market.
Chapter 6. Competitive Landscape & Company Benchmarking
- 6.1 U.S. Carbon Black for Packaging Market Concentration & Structure
- 6.1.1 Herfindahl-Hirschman Index (HHI) – vs. 2024
- 6.1.2 Tier 1, Tier 2 & Tier 3 Market Structure
- 6.1.3 Global, Regional & Local Player Dynamics
- 6.2 U.S. Carbon Black for Packaging Market Share Analysis – 2024
- 6.2.1 Global Revenue Share by Company
- 6.2.2 Global Volume Share by Company
- 6.2.3 Regional Revenue Share
- 6.2.4 Market Share Evolution ( vs. 2024)
- 6.2.5 OEM Segment Share by Company
- 6.2.6 Replacement Segment Share by Company
- 6.3 Production/Delivery Capacity & Facility Analysis
- 6.3.1 Global Installed Capacity
- 6.3.2 Capacity Utilization Rates
- 6.3.3 Production/Output Volume
- 6.3.4 Facility Locations & Capacity Map
- 6.3.5 Planned Capacity Additions
- 6.4 U.S. Carbon Black for Packaging Competitive Benchmarking Matrix
- 6.4.1 Revenue, Volume, CAGR & Profitability Comparison
- 6.4.2 Channel Revenue Mix
- 6.4.3 Geographic Revenue Exposure
- 6.4.4 R&D Intensity
- 6.4.5 Sustainability Maturity
- 6.5 Strategic Developments in U.S. Carbon Black for Packaging (Last 24 Months)
- 6.5.1 Mergers, Acquisitions & Divestments
- 6.5.2 New U.S. Carbon Black for Packaging Launches
- 6.5.3 Facility Expansions
- 6.5.4 Strategic Alliances, Joint Ventures & Partnerships
- 6.5.5 Distribution Expansion & Market Entry
- 6.5.6 Sustainability & ESG Initiatives
- 6.6 Competitive Strategy Mapping
- 6.6.1 Leader, Challenger, Follower & Niche Classification
- 6.6.2 Pricing Strategy Comparison
- 6.6.3 Channel Strategy Matrix
Note: Strategic developments are included based on their materiality and the availability of reliable information.
Chapter 7. Global U.S. Carbon Black for Packaging Market – By Distribution Channel
- 7.1 Segment Overview
- 7.1.1 Volume & Revenue Split by Channel (2024 & 2032)
- 7.1.2 Channel Mix Evolution (2024-2032)
Chapter 8. Regional Market Analysis – Global Overview
- 8.1 Global Regional Overview
- 8.1.1 Regional Volume Share
- 8.1.2 Regional Revenue Share
- 8.1.3 Regional Volume by Region
- 8.1.4 Regional Revenue by Region
- 8.1.5 Regional Forecast Through 2032
- 8.2 Cross-Regional Segment Analysis
- 8.2.1 By Distribution Channel
- 8.2.2 By Brand/Price Tier
Chapter 9. North America U.S. Carbon Black for Packaging Market
- 9.1 United States
- 9.2 Canada
- 9.3 Mexico
Chapter 10. Europe U.S. Carbon Black for Packaging Market
- 10.1 Germany
- 10.2 France
- 10.3 Italy
- 10.4 United Kingdom
- 10.5 Spain
- 10.6 Poland
- 10.7 Russia
- 10.8 Netherlands
- 10.9 Belgium
- 10.10 Sweden
- 10.11 Denmark
- 10.12 Norway
- 10.13 Rest of Europe
Chapter 11. Asia Pacific U.S. Carbon Black for Packaging Market
- 11.1 China
- 11.2 India
- 11.3 Japan
- 11.4 South Korea
- 11.5 Thailand
- 11.6 Indonesia
- 11.7 Vietnam
- 11.8 Malaysia
- 11.9 Australia
- 11.10 Rest of Asia Pacific
Chapter 12. Latin America U.S. Carbon Black for Packaging Market
- 12.1 Brazil
- 12.2 Argentina
- 12.3 Colombia
- 12.4 Chile
- 12.5 Rest of Latin America
Chapter 13. Middle East U.S. Carbon Black for Packaging Market
- 13.1 Saudi Arabia
- 13.2 United Arab Emirates
- 13.3 Turkey
- 13.4 Israel
- 13.5 Iran
- 13.6 Rest of the Middle East
Chapter 14. Africa U.S. Carbon Black for Packaging Market
- 14.1 South Africa
- 14.2 Egypt
- 14.3 Nigeria
- 14.4 Morocco
- 14.5 Rest of Africa
Chapter 15. U.S. Carbon Black for Packaging Company Profiles
- 15.1 [Company 01]
- 15.1.1 Company Overview
- 15.1.2 Key Management Personnel
- 15.1.3 Products & Services Portfolio
- 15.1.4 Financial Performance
- 15.1.5 Key Market Focus & Geographic Presence
- 15.1.6 Recent Developments & Strategic Initiatives
Note: The company profile list is preliminary and may change based on research findings, market developments, data availability, and client requirements.
Chapter 16. Appendices
- Appendix A – List of Abbreviations & Acronyms
- Appendix B – Industry Classification Code Reference – Full Series
- Appendix C – Production & Capacity Data Tables
- Appendix D – End-Use & Demand Base Tables
- Appendix E – Consumption & Replacement Rate Assumptions
- Appendix F – ASP Reference Tables
- Appendix G – Manufacturing & Facility Database
- Appendix H – Import-Export Data Tables
- Appendix I – Regulatory Summary Tables
- Appendix J – Primary Research Participant List (Anonymized)
- Appendix K – Primary Research Questionnaire Framework
- Appendix L – Data Sources & Bibliography
- Appendix M – Market Size Divergence & Source Comparison
Chapter 17. Research Methodology
- 17.1 Research Framework & Philosophy
- 17.2 Secondary Research – Sources, Hierarchy & Data Extraction
- 17.3 Data Modeling – Bottom-Up & Top-Down Market Sizing
- 17.4 Primary Research – Stakeholder Framework, LOI & Sample Sizes
- 17.5 Forecast Methodology – Regression, Scenario & Sensitivity Analysis
- 17.6 Quality Control – Four-Layer Validation Framework
- 17.7 Limitations & Standard Assumptions
- 17.8 Disclaimer
