Market Overview
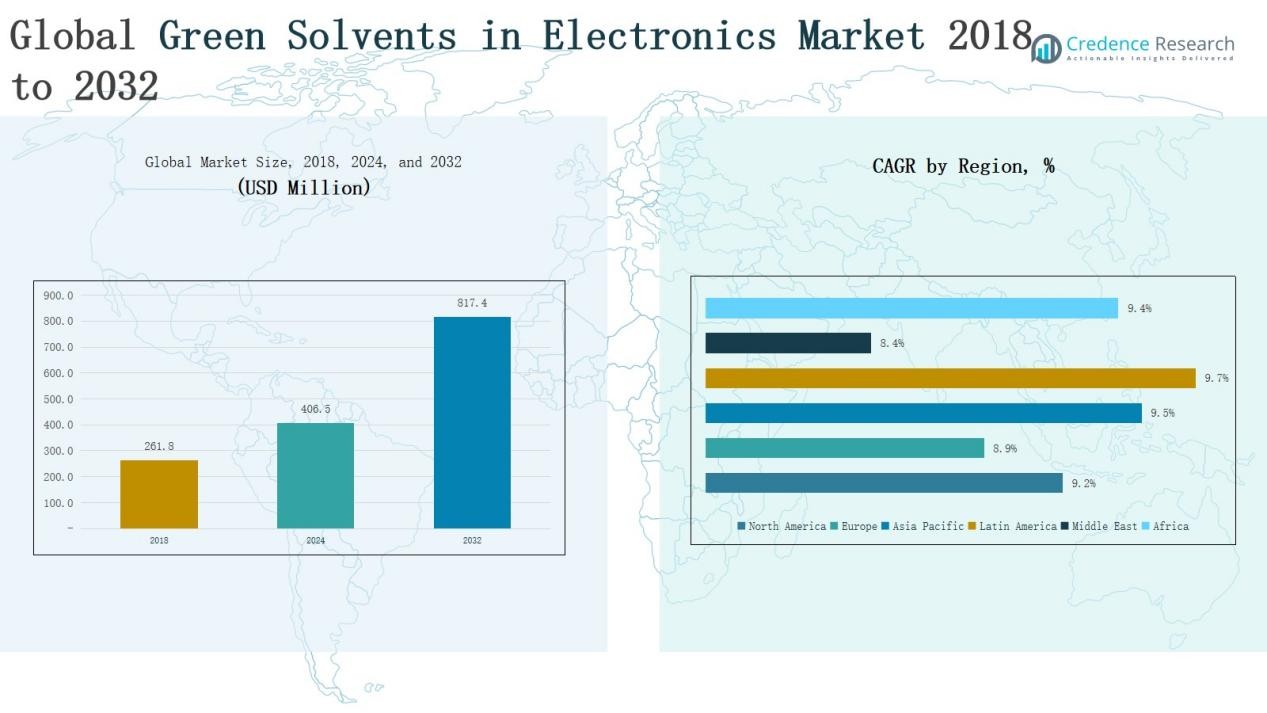
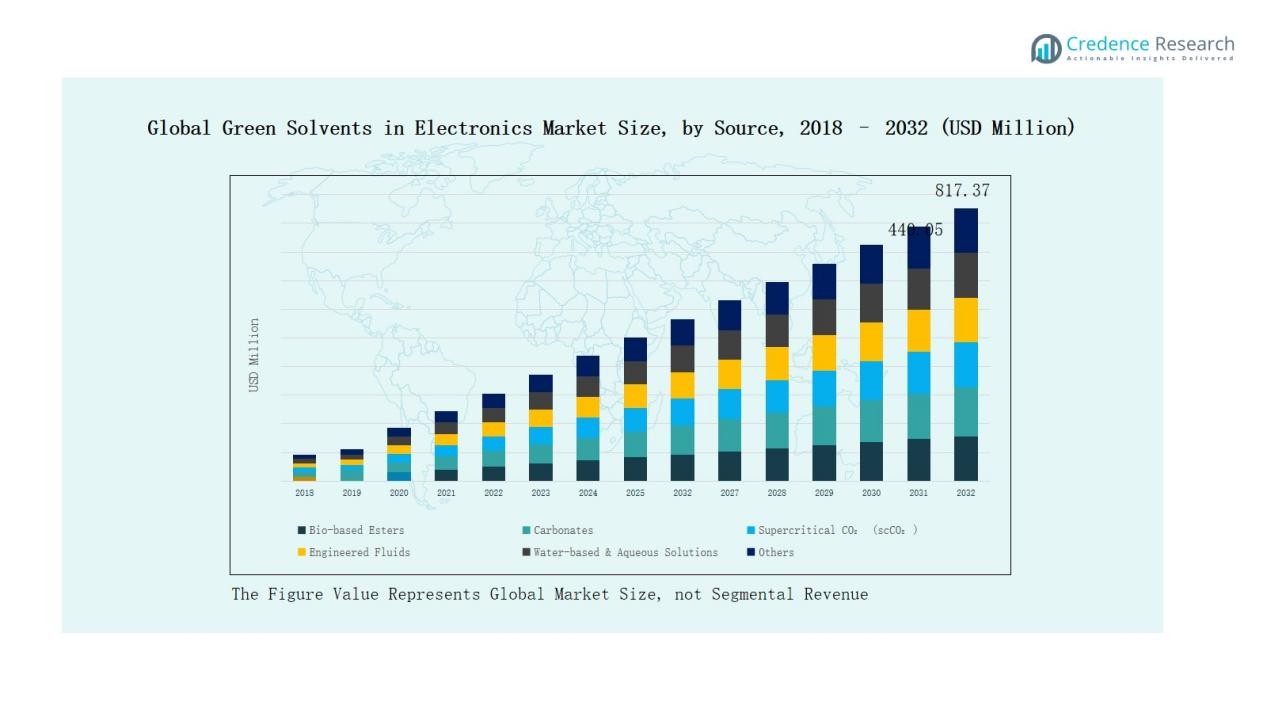
Green Solvents in Electronics Market size was valued at USD 261.8million in 2018 to USD 406.5 million in 2024 and is anticipated to reach USD 817.4 million by 2032, at a CAGR of 9.25% during the forecast period.
| REPORT ATTRIBUTE |
DETAILS |
| Historical Period |
2020-2023 |
| Base Year |
2024 |
| Forecast Period |
2025-2032 |
| Green Solvents in Electronics Market Size 2024 |
USD 406.5 Million |
| Green Solvents in Electronics Market, CAGR |
9.25% |
| Green Solvents in Electronics Market Size 2032 |
USD 817.4 Million |
The Green Solvents in Electronics Market is shaped by the presence of global chemical leaders and specialized bio-based solution providers. Key players such as BASF SE, Dow Inc., Huntsman Corporation, SABIC, Merck KGaA, Solvay S.A., Arkema S.A., Mitsubishi Chemical Group, Clariant AG, and Corbion N.V. are at the forefront, leveraging advanced R&D, strong distribution networks, and sustainable product portfolios to strengthen competitiveness. These companies focus on innovation in bio-based esters, carbonates, and engineered fluids to meet stringent environmental standards across electronics applications. Regionally, Asia Pacific dominates with a 36% share in 2024, supported by robust semiconductor, display, and battery manufacturing bases in China, Japan, and South Korea, making it the global hub for adoption and growth of green solvents in electronics.
Access crucial information at unmatched prices!
Request your sample report today & start making informed decisions powered by Credence Research Inc.!
Download Sample
Market Insights
- The Green Solvents in Electronics Market grew from USD 261.8 million in 2018 to USD 406.5 million in 2024, projected to reach USD 817.4 million by 2032.
- Asia Pacific leads with 36% share in 2024, driven by strong semiconductor, display, and battery manufacturing bases in China, Japan, and South Korea.
- By type, bio-based esters dominate with 32% share, supported by biodegradability, low toxicity, and compatibility with semiconductor and display processes.
- By application, semiconductors and microelectronics hold 36% share, reflecting rising demand for high-purity solvents in advanced chip production.
- By end user, semiconductor foundries and IDMs account for 34% share, fueled by large investments in sustainable fabs and stricter environmental compliance.
Market Segment Insights
By Type
Bio-based esters account for the dominant share of around 32% in the type segment. Their strong adoption stems from biodegradability, low toxicity, and compatibility with semiconductor and display manufacturing processes. Carbonates follow with 24%, driven by use in electrolytes for batteries and precision cleaning. Water-based and aqueous solutions capture nearly 18%, favored for cost efficiency and safe handling. Supercritical CO₂ holds 12%, valued for eco-friendly cleaning and microelectronic applications. Engineered fluids and other specialty solvents together represent the remaining 14%, primarily targeting niche applications requiring high-performance characteristics.
- For instance, Cargill launched its AgriPure™ bio-based esters which are designed for industrial fluids and electronics, offering rapid biodegradation and low aquatic toxicity.
By Application
Semiconductors and microelectronics dominate with a 36% share, as advanced chip production demands sustainable, high-purity solvents. Displays (LCD, OLED, TFT) contribute 25%, driven by rapid adoption of OLED technologies and strict environmental standards. PCB & PCBA assembly secures 16%, supported by greener cleaning and degreasing processes. Energy storage and batteries hold 13%, benefiting from growth in EV manufacturing and next-generation battery research. Precision and specialty cleaning account for 10%, serving critical cleaning of high-value electronics and sensors.
By End User
Semiconductor foundries and IDMs lead with a 34% market share, driven by heavy investment in sustainable fabs and strict process compliance. Display manufacturers represent 22%, propelled by OLED and flexible display demand. PCB/PCBA manufacturers and EMS companies follow with 17%, emphasizing cost-effective green cleaning. Battery manufacturers hold 12%, as green solvents improve energy density and safety in lithium-ion production. Electronics OEMs and assemblers capture 9%, gradually shifting to eco-friendly materials for compliance and brand positioning. Specialty cleaning providers account for the remaining 6%, focusing on high-precision, customized cleaning solutions in aerospace and defense electronics.
- For instance, intel has met its goal of 100% renewable electricity for its U.S. operations and is piloting green solvent use to reduce hazardous waste in chip manufacturing.
Key Growth Drivers
Rising Demand for Sustainable Manufacturing
Electronics manufacturers are under pressure to reduce environmental footprints, pushing adoption of green solvents. Bio-based esters and water-based solutions are gaining traction due to low toxicity and biodegradability. Regulatory mandates in Europe and North America further accelerate replacement of hazardous solvents. The shift toward sustainable manufacturing aligns with consumer demand for eco-friendly products. As a result, companies across semiconductors, displays, and PCBs are prioritizing safer, greener chemistries, positioning green solvents as an essential part of clean production strategies.
- For instance, Sigma-Aldrich offers a line of ElectroGreen™ bio-based solvent blends tailored for electronics manufacturing, such as acetone and isopropyl alcohol substitutes, which deliver high purity with reduced toxicity and environmental footprint.
Growth in Semiconductor and Display Industries
The rapid expansion of the semiconductor and display sectors drives solvent demand. Advanced chip fabrication and OLED production require high-purity solvents with consistent performance. Green solvents are increasingly preferred for cleaning, etching, and photoresist removal processes. Investments in new fabs across Asia-Pacific and North America fuel wider adoption. Display makers benefit from regulatory support to phase out toxic chemicals. This alignment of industrial growth with sustainability goals enhances the penetration of green solvents across high-volume, precision-driven applications.
- For instance, Merck KGaA has developed green alternatives to toxic solvents like N-methylpyrrolidone (NMP) and tetramethylammonium hydroxide (TMAH) used in semiconductor manufacturing, aiming to reduce environmental impact while maintaining process efficiency.
Expansion of Electric Vehicle and Energy Storage Markets
The accelerating EV and battery industries are opening strong opportunities for green solvents. Carbonates and engineered fluids are vital in electrolytes and electrode processing for lithium-ion and next-gen batteries. Global EV adoption is projected to grow sharply, creating sustained demand for eco-friendly materials. Government incentives supporting EV manufacturing strengthen the need for clean and recyclable inputs. Green solvents enable safer, higher-performance energy storage solutions, ensuring compliance with environmental standards while supporting large-scale commercialization of advanced batteries.
Key Trends & Opportunities
Shift Toward Bio-based and Renewable Solvents
The transition to bio-based esters and plant-derived solvents is a growing trend. These products not only reduce greenhouse gas emissions but also provide compatibility with sensitive electronic applications. Companies are investing in R&D to improve stability, purity, and performance of renewable solvents. Growing consumer preference for sustainable electronics strengthens demand. This trend creates opportunities for producers to develop differentiated, high-value solvent offerings that meet both industrial performance needs and global sustainability targets.
- For instance, BASF applies a “biomass balance method” replacing fossil resources with renewable feedstock for products like super-absorbents and plastics, ensuring identical product quality with a quantifiably improved CO2 footprint.
Adoption of Supercritical CO₂ in Precision Cleaning
Supercritical CO₂ is gaining momentum as a green alternative for cleaning and degreasing applications in electronics. Its non-toxic, recyclable, and residue-free properties make it suitable for semiconductors, aerospace electronics, and specialty sensors. Equipment advancements are reducing operational costs, making scCO₂ more attractive. With industries seeking high-performance and eco-friendly cleaning processes, demand for this solvent technology is expected to expand. The rising focus on precision-driven applications offers opportunities for suppliers to capture niche but rapidly growing segments.
- For instance, companies like Tokyo Electron, through its past acquisition of Supercritical Systems, Inc., offer supercritical CO₂-based systems for advanced chip manufacturing.
Key Challenges
High Cost of Green Solvents
The relatively higher cost of green solvents compared to conventional options limits adoption. Bio-based esters, engineered fluids, and scCO₂ often involve expensive production processes and specialized handling equipment. For small and mid-sized electronics manufacturers, these costs create barriers to large-scale integration. Although regulatory pressure encourages adoption, price-sensitive regions still rely on cheaper alternatives. Cost competitiveness remains a significant challenge that producers must address through economies of scale and innovations in cost-efficient production technologies.
Limited Compatibility with Legacy Processes
Many traditional electronic manufacturing processes are designed around established petrochemical solvents. Switching to green solvents often requires process adjustments, new equipment, or reformulation of chemicals. This creates resistance among manufacturers concerned about disruptions to performance or yield. Compatibility issues are particularly critical in high-precision semiconductor fabrication, where minor deviations can impact quality. Overcoming this challenge requires extensive validation, testing, and supplier collaboration to ensure seamless integration of green solvents without compromising product performance.
Regulatory and Supply Chain Uncertainty
While environmental regulations promote green solvents, shifting policies across regions create uncertainty. Differences in approval standards, chemical labeling, and safety certifications complicate global adoption strategies. Additionally, supply chain disruptions for bio-based feedstocks or raw materials can affect production consistency. For global electronics firms, ensuring reliable supply and regulatory compliance becomes challenging. Companies must navigate these complexities by diversifying suppliers, investing in local production, and developing adaptive compliance frameworks to mitigate risks and maintain market growth.
Regional Analysis
North America
North America represents 28% of the global market in 2024, with revenue reaching USD 111.08 million and projected to grow to USD 222.33 million by 2032 at a CAGR of 9.2%. Strong regulatory frameworks, technological innovation, and the presence of leading semiconductor and electronics manufacturers drive adoption. The U.S. leads regional demand, supported by sustainability mandates and R&D investments in bio-based and engineered solvents. High-value applications in semiconductors, displays, and batteries further position North America as a key market for advanced green solvent solutions.
Europe
Europe accounts for 22% of the market in 2024, valued at USD 88.12 million, and is expected to reach USD 172.47 million by 2032 at a CAGR of 8.9%. The region benefits from stringent environmental regulations under REACH and RoHS, which encourage the transition to safer solvents. Germany, France, and the UK are central to growth due to their established electronics and display industries. Investment in clean energy technologies and advanced R&D facilities further supports market expansion. Europe’s focus on circular economy practices enhances long-term demand for green solvents.
Asia Pacific
Asia Pacific holds the largest market share of 36% in 2024, generating USD 143.32 million, and is projected to reach USD 293.35 million by 2032 with a CAGR of 9.5%. The region leads due to strong electronics manufacturing bases in China, Japan, South Korea, and Taiwan. Rapid growth in semiconductors, displays, and battery production fuels adoption of eco-friendly solvents. Government initiatives promoting sustainable practices, coupled with high production capacity, enhance dominance. Asia Pacific’s robust industrial ecosystem positions it as the primary driver of global market growth.
Latin America
Latin America contributes 9% of the global share in 2024, valued at USD 37.16 million, and is forecasted to reach USD 77.24 million by 2032 at a CAGR of 9.7%. Brazil and Mexico lead adoption, supported by rising investment in electronics assembly and automotive battery production. Green solvent demand is increasing as manufacturers seek compliance with international sustainability standards. Though smaller in scale, the region offers strong growth potential due to improving industrial infrastructure and increasing consumer preference for environmentally sustainable electronics solutions.
Middle East
The Middle East accounts for 5% of the market in 2024, with revenue of USD 18.63 million, expected to rise to USD 35.31 million by 2032 at a CAGR of 8.4%. Adoption is driven by diversification of economies, particularly in the GCC, where governments are investing in advanced manufacturing. Israel contributes with innovation in specialty chemicals and electronics. While relatively nascent, the region shows growing interest in sustainable production methods, supporting gradual adoption of green solvents. Demand remains focused on specialty cleaning and limited semiconductor applications.
Africa
Africa represents an estimated 4% share in 2024, with rising demand expected to align with a CAGR of 9.4%. South Africa and Egypt lead adoption due to investments in electronics assembly and renewable energy infrastructure. While the overall market is still emerging, opportunities are rising as multinational firms expand into the region. Regulatory reforms and growing awareness of eco-friendly manufacturing support gradual adoption. Though Africa remains a small contributor, its high growth potential positions it as a developing market for green solvents in the long term.
Market Segmentations:
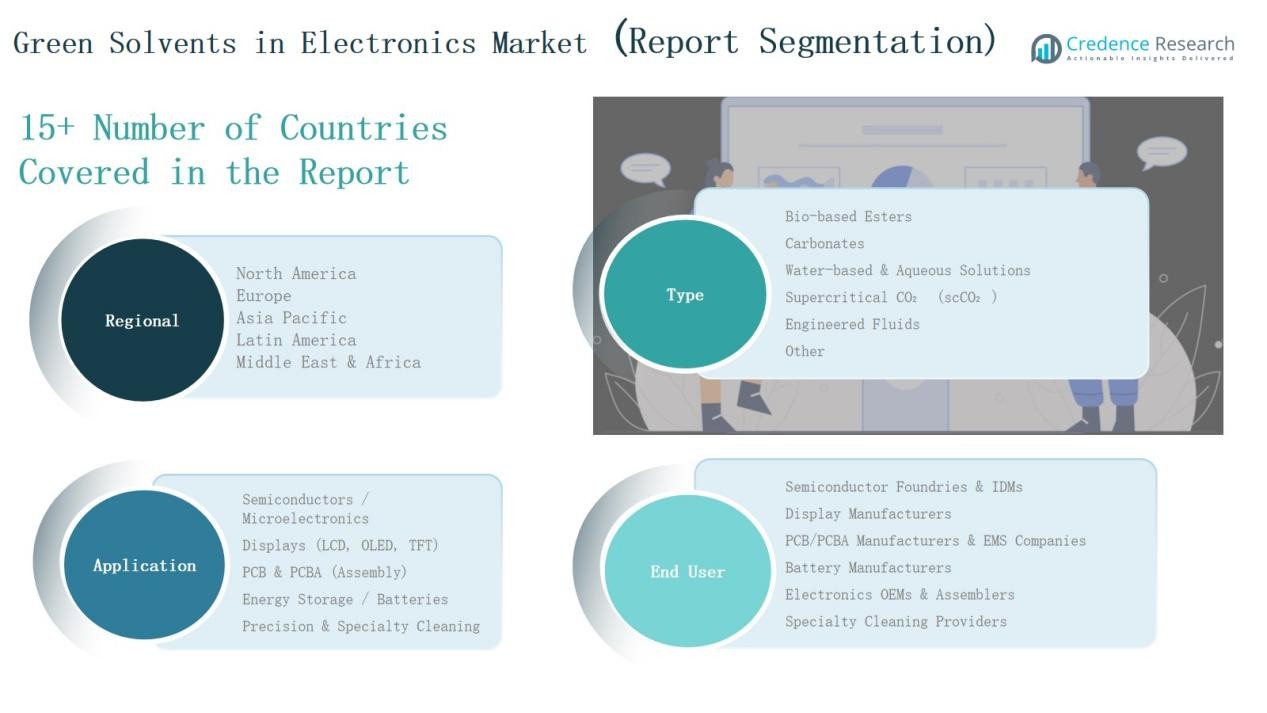
By Type
- Bio-based Esters
- Carbonates
- Water-based & Aqueous Solutions
- Supercritical CO₂ (scCO₂)
- Engineered Fluids
- Other
By Application
- Semiconductors / Microelectronics
- Displays (LCD, OLED, TFT)
- PCB & PCBA (Assembly)
- Energy Storage / Batteries
- Precision & Specialty Cleaning
By End User
- Semiconductor Foundries & IDMs
- Display Manufacturers
- PCB/PCBA Manufacturers & EMS Companies
- Battery Manufacturers
- Electronics OEMs & Assemblers
- Specialty Cleaning Providers
By Region
- North America (U.S., Canada, Mexico)
- Europe (UK, France, Germany, Italy, Spain, Russia, Rest of Europe)
- Asia Pacific (China, Japan, South Korea, India, Australia, Southeast Asia, Rest of APAC)
- Latin America (Brazil, Argentina, Rest of Latin America)
- Middle East (GCC, Israel, Turkey, Rest of Middle East)
- Africa (South Africa, Egypt, Rest of Africa)
Competitive Landscape
The Green Solvents in Electronics Market is moderately concentrated, with a mix of global chemical giants and specialized bio-solvent producers competing for share. Leading companies such as BASF SE, Dow Inc., Huntsman Corporation, SABIC, and Merck KGaA leverage strong R&D capabilities and global supply networks to drive innovation and scale. Firms like Corbion N.V., Musashino Chemical Laboratory, Vertec BioSolvents, and Godavari Biorefineries strengthen market presence through bio-based and niche solvent portfolios. Strategic initiatives, including partnerships with semiconductor foundries, acquisitions, and capacity expansions, enhance competitiveness. Rising demand from semiconductor, display, and battery manufacturers encourages players to invest in sustainable product lines with improved purity and performance. Competition is also shaped by regulatory compliance, with companies differentiating through eco-certifications and alignment with global sustainability mandates. Regional players in Asia-Pacific and Europe focus on cost efficiency and localized production, intensifying rivalry while creating opportunities for collaboration across the value chain.
Shape Your Report to Specific Countries or Regions & Enjoy 30% Off!
Key Players
- AkzoNobel N.V.
- Solvay S.A.
- Arkema S.A.
- Mitsubishi Chemical Group
- Clariant AG
- Eastman Chemical Company
- DuPont de Nemours, Inc.
- Evonik Industries AG
- Ashland Global Holdings Inc.
- LyondellBasell Industries N.V.
- ExxonMobil Chemical
- PTT Global Chemical Public Company Ltd.
- INEOS Group Holdings S.A.
- Sasol Limited
- LG Chem Ltd.
Recent Developments
l In August 2024, Eastman Chemical Company launched a new electronic-grade solvent designed specifically for semiconductor manufacturers in the United States, targeting superior quality and sustainability.
l In September 2024, Eastman launched EastaPure electronic-grade IPA for semiconductors.
l In June 2025, EnviroTech Europe introduced PFAS-free ProSolv® 5408e for electronics cleaning.
l In May 2024, Circa Group partnered with IXOM to develop Cyrene™ in Australia and New Zealand.
Report Coverage
The research report offers an in-depth analysis based on Type, Application, End User and Region. It details leading market players, providing an overview of their business, product offerings, investments, revenue streams, and key applications. Additionally, the report includes insights into the competitive environment, SWOT analysis, current market trends, as well as the primary drivers and constraints. Furthermore, it discusses various factors that have driven market expansion in recent years. The report also explores market dynamics, regulatory scenarios, and technological advancements that are shaping the industry. It assesses the impact of external factors and global economic changes on market growth. Lastly, it provides strategic recommendations for new entrants and established companies to navigate the complexities of the market.
Future Outlook
- Demand for bio-based esters will expand due to eco-friendly semiconductor production.
- Adoption of carbonates will rise with growing battery and energy storage applications.
- Water-based solutions will gain traction for low-cost cleaning in electronics assembly.
- Supercritical CO₂ will find wider use in precision and specialty cleaning processes.
- Engineered fluids will see adoption in high-performance electronics requiring advanced stability.
- Semiconductor foundries will remain the largest end-user of green solvents.
- Display manufacturers will increase reliance on sustainable solvents for OLED production.
- Battery manufacturers will drive demand as EV adoption accelerates globally.
- Regulatory mandates will strengthen the shift from petrochemical to green solvents.
- Investments in R&D will create advanced solvent formulations with higher efficiency.


