Market Overview
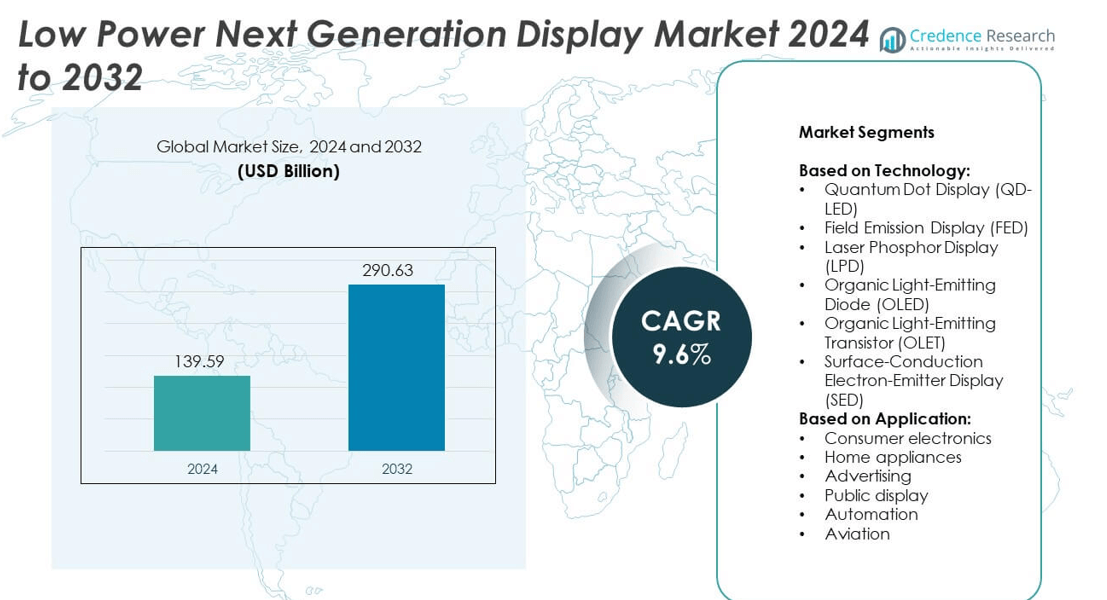
The Low Power Next Generation Display Market size was valued at USD 139.59 Billion in 2024 and is expected to reach USD 290.63 Billion by 2032, growing at a CAGR of 9.6% during the forecast period.
| REPORT ATTRIBUTE |
DETAILS |
| Historical Period |
2020-2023 |
| Base Year |
2024 |
| Forecast Period |
2025-2032 |
| Low Power Next Generation Display Market Size 2024 |
USD 139.59 Billion |
| Low Power Next Generation Display Market, CAGR |
9.6% |
| Low Power Next Generation Display Market Size 2032 |
USD 290.63 Billion |
The Low Power Next Generation Display market grows through rising demand for energy-efficient consumer electronics, smart devices, and automotive applications. Advancements in OLED, microLED, and quantum dot technologies support improved visual performance with lower power use. The trend toward flexible, foldable, and transparent displays accelerates adoption across smartphones, wearables, and smart appliances. Expanding use in public displays, digital signage, and smart infrastructure reinforces market growth. Strong emphasis on sustainability and integration with IoT platforms further drive long-term opportunities in this sector.
North America and Europe show strong demand for advanced display technologies, driven by consumer electronics and automotive industries. Asia-Pacific leads in large-scale manufacturing with countries like China, South Korea, and Japan dominating production capacity. Latin America and the Middle East & Africa display steady growth supported by advertising and smart infrastructure projects. Key players such as Samsung Electronics, LG Display, Sony Corporation, and Universal Display Corporation focus on innovation, flexible display development, and regional expansion to strengthen their competitive positions.
Access crucial information at unmatched prices!
Request your sample report today & start making informed decisions powered by Credence Research Inc.!
Download Sample
Market Insights
- The Low Power Next Generation Display market was valued at USD 139.59 Billion in 2024 and is projected to reach USD 290.63 Billion by 2032, growing at a CAGR of 9.6%.
- Market drivers include rising demand for energy-efficient smartphones, laptops, and wearables, supported by regulatory emphasis on sustainability.
- Market trends highlight growing adoption of OLED and microLED technologies, along with flexible and foldable displays gaining traction across consumer electronics.
- Competitive analysis shows strong presence of players such as Samsung Electronics, LG Display, Sony Corporation, and Universal Display Corporation, focusing on innovation and global expansion.
- Market restraints include high production costs, limited standardization, and technical challenges such as balancing brightness and energy efficiency.
- Regional analysis identifies Asia-Pacific as the leading hub for manufacturing and adoption, North America and Europe as key innovation centers, and Latin America and Middle East & Africa showing gradual adoption in public displays and advertising.
- The market outlook remains positive, with opportunities in smart infrastructure, automotive infotainment, digital signage, and healthcare applications, driven by ongoing R&D and global energy efficiency targets.
Market Drivers
Rising Demand for Energy-Efficient Consumer Electronics
The Low Power Next Generation Display market grows strongly due to rising demand for energy-efficient consumer devices. Smartphones, tablets, and laptops increasingly require displays that extend battery life without compromising visual quality. It supports consumer preference for portable electronics with longer usage times. Manufacturers focus on OLED, microLED, and e-paper technologies to lower energy consumption. The trend aligns with global efforts to cut carbon emissions and meet sustainability targets. Strong adoption across both developed and emerging economies accelerates deployment of such displays.
- For instance, In 2023, Samsung Display maintained its position as a major supplier in the global small and medium AMOLED (Active-Matrix OLED) market, with Omdia reporting a 43% market share. The company supplied a significant volume of panels that, due to the self-emissive nature of OLED technology, generally offer greater power efficiency compared to LCD counterparts, particularly when displaying darker content. A market study by Omdia confirms that the overall small and medium AMOLED market reached 842 million units in 2023, representing 11% growth over the previous year
Expansion of Wearables and IoT Applications
Wearables and IoT applications create strong growth opportunities for the Low Power Next Generation Display market. Devices like smartwatches, fitness trackers, and AR glasses depend on power-efficient displays for continuous operation. It enhances usability while reducing the need for frequent charging. Compact form factors demand thin, flexible, and durable display solutions. Increasing integration of IoT devices in healthcare and industrial automation supports further expansion. Continuous improvements in display technologies enable sharper visuals with minimal energy use.
- For instance, Apple integrated LTPO OLED displays into the Apple Watch Series 9, achieving variable refresh rates that can drop to as low as 1 Hz when the device is idle or in Low Power Mode. This technology, along with other power efficiency improvements in the S9 SiP, allows the Series 9 to maintain an all-day battery life of 18 hours, which can be extended up to 36 hours in Low Power Mode.
Growth in Automotive and Transportation Displays
The automotive sector drives adoption in the Low Power Next Generation Display market through advanced infotainment and digital instrument clusters. Electric vehicles, in particular, require displays that consume less power to maximize driving range. It also supports head-up displays and navigation screens that enhance driver safety. Carmakers integrate next-generation displays to meet consumer expectations for modern interfaces. Strong demand in public transport systems for energy-saving signage also contributes. Widespread electrification trends reinforce the importance of low power technologies in this segment.
Rising Focus on Smart Infrastructure and Green Buildings
Smart infrastructure projects fuel expansion of the Low Power Next Generation Display market by deploying energy-efficient signage and monitoring systems. Commercial buildings increasingly adopt low power digital displays for advertising and information management. It reduces operational costs while meeting stricter green building standards. Integration with smart grids and connected systems improves real-time data visualization. Governments and corporations invest in sustainable display solutions for urban spaces and workplaces. Growing emphasis on net-zero targets accelerates demand for advanced energy-efficient display technologies.
Market Trends
Adoption of OLED and MicroLED Technologies
The Low Power Next Generation Display market experiences strong adoption of OLED and microLED technologies. These displays deliver high contrast, vivid colors, and lower energy use compared to traditional LCDs. It supports growth in premium smartphones, televisions, and wearables. MicroLED further offers longer lifespan and better brightness control for outdoor applications. Manufacturers invest in scaling production to meet rising demand across industries. Continuous R&D in material efficiency strengthens the role of these technologies in the market.
- For instance, In 2022, Continental AG received major orders for its display solutions totaling more than €2 billion, confirming its position as a major supplier of automotive display technology. The company develops OLED display solutions for vehicles, highlighting their improved contrast, vibrant colors, and energy efficiency compared to traditional LCDs.
Integration of Flexible and Foldable Displays
Flexible and foldable displays shape a major trend in the Low Power Next Generation Display market. Consumer electronics companies launch foldable smartphones, tablets, and laptops to meet evolving design needs. It improves portability while maintaining display quality and energy efficiency. Flexible substrates enable thinner, lighter devices with greater durability. Rising use in wearables, automotive dashboards, and signage extends the applications of these displays. Ongoing innovations reduce production costs, expanding adoption beyond premium categories.
- For instance, In 2023, E Ink Holdings supplied e-paper signage for smart bus stops and retail shelf tags, utilizing its technology to significantly reduce power consumption compared to LCD displays. The company also announced the Spectra 6 e-paper platform in April 2023, which was subsequently used in a collaboration with Sharp Corporation to produce e-paper posters, with color models released in the latter half of the year. It is important to note that while the Spectra 6 platform was introduced, the 75-inch version did not become available until 2025.
Growth of E-Paper and Reflective Display Applications
The Low Power Next Generation Display market benefits from growing use of e-paper and reflective display technologies. These displays consume extremely low power, making them ideal for e-readers, smart labels, and shelf tags. It extends battery life while maintaining clear visibility under direct sunlight. Retail, logistics, and education sectors integrate e-paper for sustainable digital communication. Expanding adoption in industrial and healthcare environments further broadens the market base. Advancements in color e-paper improve versatility and competitiveness against traditional displays.
Increased Integration with Smart and Connected Systems
Smart and connected systems drive demand in the Low Power Next Generation Display market. IoT devices, smart home appliances, and connected healthcare solutions require low power displays for continuous operation. It supports real-time monitoring while keeping energy use minimal. Growing adoption in smart cities promotes low power signage and public information systems. Cloud-based platforms integrate with advanced displays to enable remote diagnostics and updates. Strong synergies with IoT and AI technologies position low power displays as a critical enabler of future digital ecosystems.
Market Challenges Analysis
High Manufacturing Costs and Complex Production Processes
The Low Power Next Generation Display market faces challenges due to high manufacturing costs and complex production techniques. OLED and microLED technologies require advanced fabrication equipment and precise material handling, which increases overall expenses. It limits affordability for mid-range consumer electronics and slows adoption in cost-sensitive markets. Yield issues during large-scale production further impact profitability for manufacturers. Supply chain dependencies on rare materials, such as gallium nitride and indium, also increase cost pressures. These factors create barriers for widespread deployment, especially in emerging economies with lower price tolerance.
Limited Standardization and Technical Constraints
The Low Power Next Generation Display market also struggles with limited standardization and technical constraints. Different manufacturers follow varied design approaches, which reduces compatibility across applications. It restricts seamless integration with diverse electronic systems, particularly in IoT and automotive sectors. Durability and lifespan concerns remain for flexible and foldable displays under daily usage conditions. Power efficiency gains sometimes trade off against brightness and resolution, creating performance challenges. Regulatory frameworks around electronic waste and recycling add further complexity to adoption. These obstacles slow the pace of mass commercialization despite strong demand for energy-efficient display solutions.
Market Opportunities
Rising Adoption Across Emerging Applications
The Low Power Next Generation Display market holds strong opportunities through its adoption across new applications. Wearables, AR/VR headsets, and smart glasses increasingly depend on compact, power-saving displays for enhanced user experience. It creates scope for innovations in transparent, flexible, and ultra-thin form factors. Healthcare and industrial sectors deploy advanced displays in portable diagnostic equipment and remote monitoring devices. Growth in digital signage for retail and transportation further expands the application base. Broader adoption across these segments unlocks new revenue streams for manufacturers.
Support from Sustainability and Smart Infrastructure Initiatives
Government and corporate focus on sustainability creates favorable opportunities in the Low Power Next Generation Display market. Green building standards and smart city projects demand energy-efficient display systems for communication and monitoring. It strengthens deployment in public information boards, advertising panels, and smart appliances. Integration with IoT platforms and cloud-based systems enhances value by enabling real-time data visualization. Strong emphasis on reducing carbon emissions supports widespread adoption in both developed and developing regions. These opportunities ensure long-term growth potential for low power display technologies across multiple industries.
Market Segmentation Analysis:
By Technology:
The Low Power Next Generation Display market shows strong adoption of OLED technology, supported by its wide use in smartphones, televisions, and wearable devices. OLED offers deep contrast, flexibility, and reduced power consumption, which strengthen its position in premium electronics. Quantum Dot Displays (QD-LED) also gain momentum due to their enhanced color accuracy and brightness efficiency, making them suitable for large-screen televisions and monitors. Field Emission Displays (FED) and Surface-Conduction Electron-Emitter Displays (SED) remain in the early stages of commercialization, with potential in niche applications where durability and low power use are critical. Laser Phosphor Displays (LPD) attract demand in large-format applications like projectors and digital signage, benefiting from long lifespan and low energy needs. Organic Light-Emitting Transistors (OLET) remain at research and prototype stages but hold promise for future integration into ultra-thin and flexible devices. Each technology segment reflects varying maturity levels, with OLED and QD-LED driving current market momentum.
- For instance, In 2023, LG Display announced its third-generation OLED panels with META Technology, which was enabled by new materials and micro-lens arrays. This technology brought significant improvements in brightness and energy efficiency compared to conventional OLED displays. As of August 2023, LG Display stated that its third-generation OLED TV panel featuring META Technology boosted energy efficiency by up to 22%
By Application:
Consumer electronics lead the Low Power Next Generation Display market due to the rapid growth of smartphones, tablets, laptops, and wearables. It supports increasing consumer demand for extended battery life and high-resolution visuals. Home appliances such as smart refrigerators, washing machines, and ovens adopt low power displays for better efficiency and modern interfaces. Advertising and public display segments expand quickly, with retailers and urban planners deploying digital signage that reduces operational costs and energy use. Automation industries incorporate such displays into control systems, dashboards, and monitoring equipment to ensure reliability with low energy impact. Aviation also creates a significant opportunity by adopting low power displays in cockpit instruments, in-flight entertainment, and navigation systems, where energy efficiency and durability remain vital. Together, these application segments reflect broad integration across industries, positioning low power next generation displays as a central enabler of energy-efficient visual communication.
- For instance, In 2022, BOE Technology emerged as a major supplier of flexible OLED displays. The company announced a target to ship approximately 80 million flexible OLED units that year, though some market analysis indicates the final shipment number for smartphone OLEDs was closer to 76 million units. The panels were used in various devices, including smartphones
Segments:
Based on Technology:
- Quantum Dot Display (QD-LED)
- Field Emission Display (FED)
- Laser Phosphor Display (LPD)
- Organic Light-Emitting Diode (OLED)
- Organic Light-Emitting Transistor (OLET)
- Surface-Conduction Electron-Emitter Display (SED)
Based on Application:
- Consumer electronics
- Home appliances
- Advertising
- Public display
- Automation
- Aviation
Based on the Geography:
- North America
- Europe
- UK
- France
- Germany
- Italy
- Spain
- Russia
- Belgium
- Netherlands
- Austria
- Sweden
- Poland
- Denmark
- Switzerland
- Rest of Europe
- Asia Pacific
- China
- Japan
- South Korea
- India
- Australia
- Thailand
- Indonesia
- Vietnam
- Malaysia
- Philippines
- Taiwan
- Rest of Asia Pacific
- Latin America
- Brazil
- Argentina
- Peru
- Chile
- Colombia
- Rest of Latin America
- Middle East
- UAE
- KSA
- Israel
- Turkey
- Iran
- Rest of Middle East
- Africa
- Egypt
- Nigeria
- Algeria
- Morocco
- Rest of Africa
Regional Analysis
North America
North America accounts for 32% of the Low Power Next Generation Display market share, driven by high adoption across consumer electronics, automotive, and smart infrastructure projects. The region benefits from strong investments in research and development, particularly in OLED, microLED, and quantum dot technologies. It supports large-scale deployment in smartphones, laptops, and wearable devices where energy efficiency is a top priority. The United States leads with advanced semiconductor and display manufacturing facilities, while Canada contributes through smart building and green technology adoption. Growth is reinforced by rising demand for energy-efficient automotive displays in electric vehicles and the expansion of digital signage across retail and entertainment sectors. Integration with IoT-based platforms and increasing focus on reducing carbon footprints create a favorable environment for next generation displays in North America.
Europe
Europe holds 28% of the Low Power Next Generation Display market share, supported by strict energy efficiency regulations and strong government initiatives promoting sustainability. The region’s widespread use of district heating, cooling systems, and green building standards enhances demand for low power display solutions. Germany, France, and the UK lead in consumer electronics and automotive applications, while Eastern Europe experiences growth in industrial automation and public display systems. It benefits from significant investments in flexible OLED and QD-LED technologies for both commercial and residential use. Automotive manufacturers in Germany and Italy drive further adoption through energy-efficient cockpit and infotainment systems. Expanding urbanization projects and demand for cost-effective public information systems position Europe as a competitive hub for low power display innovations.
Asia-Pacific
Asia-Pacific represents the largest share at 34% of the Low Power Next Generation Display market, supported by rapid industrialization and large-scale electronics manufacturing hubs. China, South Korea, and Japan dominate production, with leading companies investing in OLED, microLED, and flexible display technologies. It benefits from rising consumer demand for smartphones, tablets, and home appliances with longer battery life and enhanced display performance. India and Southeast Asian countries contribute through expanding smart city projects and adoption of digital advertising platforms. Strong supply chains and cost-efficient manufacturing enable high-volume production for both domestic and international markets. Increasing use of low power displays in aviation, retail, and healthcare sectors further strengthens Asia-Pacific’s dominance. The region continues to expand its leadership with continuous technological advancements and mass-market adoption.
Latin America
Latin America holds 4% of the Low Power Next Generation Display market share, with steady progress across advertising, consumer electronics, and public display applications. Brazil and Mexico lead adoption, supported by growing demand for digital signage in retail and transportation. It gains traction from energy-saving initiatives aimed at reducing electricity costs in commercial and public infrastructure. Limited local manufacturing capacity slows wider adoption, but imports from Asia-Pacific ensure access to advanced technologies. Rising smartphone penetration and gradual integration of smart appliances enhance regional opportunities. Governments promote sustainable development goals, which indirectly increase the demand for energy-efficient displays in urban centers. The market grows at a steady pace, though challenges remain in affordability and accessibility compared to developed regions.
Middle East & Africa
Middle East & Africa account for 2% of the Low Power Next Generation Display market share, characterized by niche adoption in commercial and public infrastructure projects. The Gulf countries invest in advanced digital signage for airports, retail malls, and entertainment hubs, driving steady growth. It benefits from ongoing smart city initiatives in the UAE and Saudi Arabia, which encourage the deployment of energy-efficient displays. Africa’s contribution remains small but expanding, with increasing adoption of low power displays in telecommunications and public advertising sectors. Limited industrial base and high dependence on imports restrict faster expansion, yet opportunities remain significant in sustainable infrastructure projects. Aviation and hospitality industries in the Middle East also accelerate the use of low power next generation displays. Growing alignment with energy efficiency policies strengthens the future potential of this regional market.
Shape Your Report to Specific Countries or Regions & Enjoy 30% Off!
Key Player Analysis
- Visionox Technology, Inc.
- QUALCOMM Incorporated
- Universal Display Corporation (UDC)
- Sharp Corporation
- Nanosys, Inc.
- Panasonic Corporation
- Sony Corporation
- RitDisplay Corporation
- Samsung Electronics Co., Ltd.
- Philips International B.V.
- LG Display Co., Ltd.
- Novaled GmbH
- Planar Systems, Inc.
- Tianma Microelectronics Co., Ltd.
Competitive Analysis
The Low Power Next Generation Display market is shaped by leading players such as Samsung Electronics Co., Ltd., LG Display Co., Ltd., Sony Corporation, Universal Display Corporation (UDC), Visionox Technology, Inc., Sharp Corporation, Panasonic Corporation, QUALCOMM Incorporated, Nanosys, Inc., Novaled GmbH, Philips International B.V., Planar Systems, Inc., RitDisplay Corporation, and Tianma Microelectronics Co., Ltd. These companies drive innovation, expand production capacity, and strengthen global supply chains to maintain competitive advantages. The market shows intense competition in OLED and microLED segments, with established firms investing in advanced production facilities to secure higher yield and cost efficiency. Strong focus lies in developing flexible and foldable displays to meet rising consumer demand for portable electronics. Partnerships and licensing agreements with semiconductor companies and material suppliers help leading players expand technology adoption across multiple applications. Continuous research efforts target improved efficiency, durability, and reduced manufacturing costs, reinforcing long-term competitiveness. Regional expansion strategies also support wider market penetration, particularly in Asia-Pacific where large-scale production facilities dominate. The competitive landscape remains dynamic, driven by both product innovation and sustainability goals that align with global energy efficiency standards.
Recent Developments
- In 2025, Panasonic Corporation launched “Panasonic Go,” a global AI-driven corporate transformation initiative announced at CES 2025, aiming to leverage AI for business and product innovation.
- In 2025, Novaled Gmb Won a patent dispute in March 2025 securing its position as the supplier of OLED ETL materials for Samsung’s QD-OLED panels.
- In 2025, LG Display Co., Ltd. unveiled its fourth-generation OLED TV panels focusing on AI TV features with improved energy efficiency by about 20%. Also showcased advancements in gaming OLED panels with better brightness, color gamut, and a 45-inch 5K2K Gaming OLED delivering high resolution and immersive experience
Report Coverage
The research report offers an in-depth analysis based on Technology, Application and Geography. It details leading market players, providing an overview of their business, product offerings, investments, revenue streams, and key applications. Additionally, the report includes insights into the competitive environment, SWOT analysis, current market trends, as well as the primary drivers and constraints. Furthermore, it discusses various factors that have driven market expansion in recent years. The report also explores market dynamics, regulatory scenarios, and technological advancements that are shaping the industry. It assesses the impact of external factors and global economic changes on market growth. Lastly, it provides strategic recommendations for new entrants and established companies to navigate the complexities of the market.
Future Outlook
- The market will expand with strong adoption of OLED and microLED technologies.
- Demand from smartphones, laptops, and wearables will drive consistent growth.
- Flexible and foldable displays will become mainstream in consumer electronics.
- Automotive adoption will rise through energy-efficient infotainment and cockpit systems.
- E-paper and reflective displays will gain wider use in retail and logistics.
- Integration with IoT platforms will enhance role in smart homes and smart cities.
- Aviation and defense sectors will increase reliance on low power display solutions.
- Sustainability targets will encourage broader use in public display and advertising.
- Emerging markets in Asia-Pacific will lead global manufacturing and adoption trends.
- Continuous R&D investment will reduce costs and improve large-scale production yields.


