Market Overview
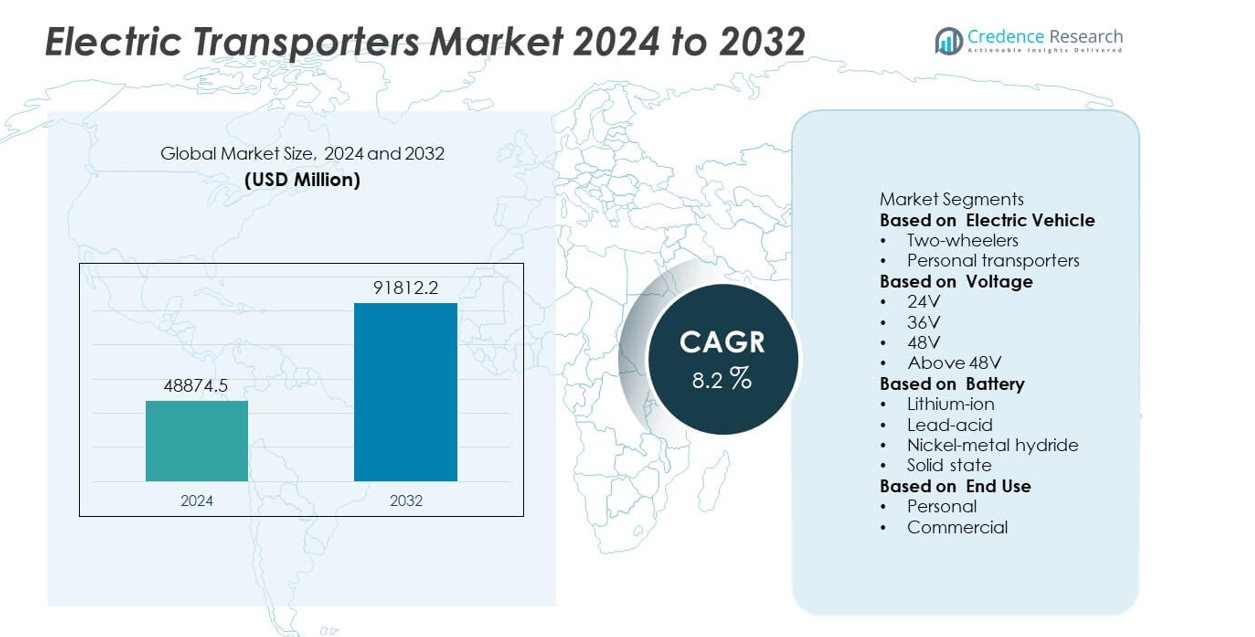
The Electric Transporters Market was valued at USD 48,874.5 million in 2024 and is projected to reach USD 91,812.2 million by 2032, growing at a CAGR of 8.2 % during the forecast period.
| REPORT ATTRIBUTE |
DETAILS |
| Historical Period |
2020-2023 |
| Base Year |
2024 |
| Forecast Period |
2025-2032 |
| Electric Transporters Market Size 2024 |
USD 48,874.5 million |
| Electric Transporters Market, CAGR |
8.2% |
| Electric Transporters Market Size 2032 |
USD 91,812.2 million |
The Electric Transporters Market is dominated by leading manufacturers such as Yadea, Hero MotoCorp, Segway Ninebot, Zero Motorcycles, KYMCO, BMW Motorrad, Yamaha Motor, Niu Technologies, Harley-Davidson, and Giant Group. These companies focus on innovation in lightweight materials, battery performance, and smart connectivity to enhance efficiency and user experience. Asia-Pacific led the global market with a 41 percent share in 2024, driven by strong electric two-wheeler adoption in China and India. Europe followed with 29 percent, supported by sustainability-focused policies, while North America accounted for 23 percent, fueled by rising interest in premium and high-performance electric transporters.
Market Insights
- The Electric Transporters Market was valued at USD 48,874.5 million in 2024 and is projected to reach USD 91,812.2 million by 2032, growing at a CAGR of 8.2 percent.
- Rising demand for sustainable urban mobility and growing government support for electric transportation are driving market expansion.
- The market is witnessing strong trends toward lightweight design, lithium-ion battery integration, and connected features for enhanced user convenience.
- Key players such as Yadea, Hero MotoCorp, Segway Ninebot, and Yamaha Motor are focusing on expanding product portfolios, smart technologies, and global presence to strengthen competitiveness.
- Asia-Pacific led the market with 41 percent share in 2024, followed by Europe with 29 percent and North America with 23 percent, while the two-wheeler segment dominated with 67 percent share due to widespread adoption in commuter and personal mobility applications.
Access crucial information at unmatched prices!
Request your sample report today & start making informed decisions powered by Credence Research Inc.!
Download Sample
Market Segmentation Analysis:
By Electric Vehicle
The two-wheelers segment dominated the Electric Transporters Market in 2024, capturing 58 percent of the total share. This leadership is driven by rising adoption of e-scooters and e-bikes for personal and last-mile transportation. Urban commuters prefer electric two-wheelers due to their affordability, compact design, and low maintenance requirements. Governments are promoting e-mobility through subsidies and tax incentives, further enhancing adoption. Continuous improvements in vehicle range, lightweight components, and battery performance make electric two-wheelers the preferred choice for sustainable urban mobility solutions.
- For instance, Yadea launched its KEENESS electric motorcycle equipped with a dual 72V 32Ah battery system for a total capacity of 4.6 kWh, and a mid-drive motor with 5,500 W rated power and 10,000 W peak power. This delivers a top speed of 100 km/h and a maximum real-world range of 140 km per charge.
By Voltage
The 48V segment led the market with a 46 percent share in 2024, supported by its efficient balance between power output and energy consumption. Vehicles with 48V systems offer higher torque, better performance, and extended battery life, making them ideal for both personal transporters and e-bikes. This voltage configuration provides enhanced acceleration and supports advanced functionalities like regenerative braking. Manufacturers are focusing on 48V architectures to optimize vehicle efficiency while maintaining safety and cost-effectiveness. The growing demand for mid-range electric vehicles continues to reinforce the dominance of this segment.
- For instance, Hero MotoCorp’s VIDA V1 Pro e-scooter operates on a 3.94 kWh lithium-ion battery pack, composed of two removable batteries. This is paired with a 6 kW peak power electric motor, delivering an Indian Driving Cycle (IDC) certified range of 165 km per charge.
By Battery
The lithium-ion battery segment held the largest share of 71 percent in 2024, driven by superior energy density, longer lifespan, and fast-charging capabilities. Lithium-ion technology supports lightweight and efficient designs, improving vehicle range and performance. The declining cost of lithium cells and advancements in recycling are boosting widespread adoption across transport applications. Governments are encouraging lithium-ion battery manufacturing under clean energy programs, enhancing supply chain stability. Manufacturers are also developing advanced thermal management systems to ensure durability, positioning lithium-ion batteries as the primary power source for electric transporters globally.
Key Growth Drivers
Growing Demand for Sustainable Urban Mobility
The rapid shift toward eco-friendly and efficient urban transportation is a major driver of the Electric Transporters Market. Rising fuel prices and environmental concerns are prompting consumers and governments to favor electric mobility solutions. E-scooters, e-bikes, and personal transporters offer low operating costs and zero emissions, supporting green mobility goals. Urbanization and expanding charging infrastructure further encourage adoption. Initiatives promoting cleaner cities and reduced carbon footprints continue to accelerate demand for compact, energy-efficient electric transporters across both developed and emerging regions.
- For instance, Niu Technologies introduced its MQi GT EVO electric scooter equipped with a 72V 26Ah dual lithium-ion battery system and a 6.5 kW mid-mounted motor, capable of achieving a top speed of 100 km/h. The scooter’s dual batteries have a standard charging time of 5 hours and it provides three riding modes for optimized energy use in urban traffic conditions.
Government Incentives and Electrification Policies
Strong policy support and financial incentives are propelling the growth of electric transporters globally. Governments are offering subsidies, tax rebates, and low-interest financing to make electric vehicles more affordable. Programs promoting electric two-wheelers, e-bikes, and micro-mobility fleets are expanding rapidly in Asia-Pacific and Europe. These policies also drive investment in charging networks and battery recycling infrastructure. The alignment of transport electrification with national carbon reduction targets enhances market confidence and accelerates the transition toward sustainable mobility ecosystems.
- For instance, KYMCO benefited from Taiwan’s Green Transport initiative, which provides subsidies of up to NT$7,000 per unit for certified electric scooters. The company’s iONEX electric platform integrates a 50V swappable battery system supporting 1,000 charging cycles, enabling fleet operators and individual users to access energy-as-a-service programs and accelerating electric two-wheeler adoption across urban regions.
Advancements in Battery and Charging Technology
Continuous innovation in battery chemistry and charging systems is significantly improving vehicle range and efficiency. Lithium-ion and solid-state batteries now offer higher energy density, faster charging, and longer life cycles. Manufacturers are also integrating regenerative braking and smart charging features for optimized energy use. These advancements reduce range anxiety and improve user convenience, encouraging mass adoption. Portable and swappable battery systems are emerging as practical solutions for fleet operators and individual consumers, ensuring consistent performance and reduced downtime.
Key Trends and Opportunities
Integration of Smart Connectivity and IoT
The incorporation of IoT and smart connectivity features is transforming electric transporters into intelligent mobility systems. Connected vehicles enable real-time performance monitoring, GPS tracking, and predictive maintenance. Integration with mobile apps enhances safety and user experience through features like remote diagnostics and anti-theft systems. The trend toward data-driven mobility is also attracting shared mobility operators and delivery service providers. As smart city initiatives expand, connected electric transporters will play a critical role in optimizing traffic flow and improving urban transport efficiency.
- For instance, the consumer version of the Segway Ninebot Max G2 e-scooter features Bluetooth connectivity for pairing with the Segway-Ninebot app. This allows users to track the scooter’s location using Apple’s “Find My” network (for compatible iOS devices), monitor battery status, and receive firmware updates.
Expansion of Shared and Fleet-Based Electric Mobility
The rise of shared mobility and electric fleet services is creating new growth opportunities. E-scooter and e-bike sharing programs are becoming popular in major cities worldwide, driven by convenience and affordability. Logistics and last-mile delivery operators are adopting electric transporters to meet sustainability goals and reduce fuel expenses. Partnerships between manufacturers and fleet operators are accelerating deployment, particularly in densely populated urban centers. The scalability of electric fleets supports both environmental and economic benefits, reinforcing this trend across the mobility sector.
- For instance, Yamaha Motor collaborated with Gogoro to launch the EMF electric scooter in Taiwan in 2022, following their 2019 release of the EC-05 model in the same market. Both scooters use Gogoro’s swappable battery modules, allowing riders to exchange depleted batteries for fresh ones at Gogoro’s extensive network of over 2,500 battery swap stations across Taiwan.
Key Challenges
High Initial Cost and Limited Affordability
The high upfront cost of electric transporters compared to conventional models remains a major restraint. Advanced battery systems, power electronics, and lightweight materials contribute to higher production expenses. For cost-sensitive consumers, especially in developing regions, this limits large-scale adoption. While operational costs are lower, the initial investment poses a barrier to entry. Manufacturers are addressing this through localized production, leasing models, and government-backed subsidies, but achieving full price parity with traditional vehicles remains a significant challenge for market expansion.
Insufficient Charging Infrastructure
Limited availability of charging infrastructure continues to hinder market growth, particularly in developing countries. Inadequate public charging points and inconsistent power supply reduce user convenience and restrict long-distance usage. Urban and peri-urban areas often lack dedicated charging facilities for electric two-wheelers and personal transporters. Although portable and swappable battery systems are emerging, infrastructure expansion is progressing slowly. Collaboration between public authorities, energy companies, and private players is essential to build accessible, fast-charging networks that support the growing base of electric transport users.
Regional Analysis
North America
North America held a market share of 28 percent in 2024, driven by strong adoption of electric scooters, e-bikes, and personal mobility devices. The United States leads the region due to growing investment in urban micro-mobility infrastructure and supportive government incentives for electric vehicle adoption. The expansion of e-scooter sharing platforms and corporate sustainability programs further strengthens market growth. Technological innovation and the presence of leading manufacturers contribute to product diversification. Increasing consumer awareness of eco-friendly transport options and the development of fast-charging networks are enhancing the adoption of electric transporters across urban centers.
Europe
Europe accounted for 27 percent of the global Electric Transporters Market in 2024, supported by strong policy measures promoting sustainable mobility and emission reduction. Countries such as Germany, France, and the Netherlands are leading adoption with large-scale e-bike and electric scooter integration into public transportation systems. Government incentives, urban congestion control measures, and investment in charging infrastructure boost demand. The region’s focus on carbon neutrality and smart city development enhances the transition toward electric personal transport. Rising consumer preference for compact, energy-efficient vehicles continues to drive growth across residential and commercial mobility segments.
Asia-Pacific
Asia-Pacific dominated the Electric Transporters Market with a 33 percent share in 2024, fueled by high population density, rapid urbanization, and government initiatives supporting electric mobility. China and India lead the regional market, driven by affordable two-wheelers and strong manufacturing ecosystems. Local producers are launching cost-effective e-bikes and scooters to meet rising commuter needs. Expansion of charging infrastructure and battery-swapping systems further supports adoption. Japan and South Korea are advancing premium electric transporter technologies focused on performance and safety. The region’s growing environmental awareness and favorable policy frameworks continue to reinforce its leadership position.
Middle East and Africa
The Middle East and Africa captured 6 percent of the Electric Transporters Market in 2024, supported by growing investment in sustainable transport infrastructure and renewable energy initiatives. The UAE and Saudi Arabia are leading adoption through smart city projects and e-mobility programs. In Africa, expanding urbanization and demand for affordable transportation are driving interest in electric two-wheelers. Limited charging infrastructure remains a challenge, but renewable-powered stations are being introduced. Partnerships between local governments and global manufacturers are expected to boost accessibility, supporting gradual market expansion across high-growth urban centers in the region.
Latin America
Latin America accounted for 6 percent of the global Electric Transporters Market in 2024, led by increasing adoption of electric scooters and e-bikes in Brazil, Mexico, and Chile. Government initiatives to curb pollution and modernize urban mobility systems are encouraging the transition to electric transport. Growing participation of ride-sharing platforms and fleet operators is boosting demand for small electric vehicles. Local assembly and import partnerships are improving affordability and product availability. Rising fuel prices and growing awareness of sustainable commuting continue to strengthen adoption, supporting steady market growth across key metropolitan regions.
Market Segmentations:
By Electric Vehicle
- Two-wheelers
- Personal transporters
By Voltage
By Battery
- Lithium-ion
- Lead-acid
- Nickel-metal hydride
- Solid state
By End Use
By Geography
- North America
- Europe
- Germany
- France
- U.K.
- Italy
- Spain
- Rest of Europe
- Asia Pacific
- China
- Japan
- India
- South Korea
- South-east Asia
- Rest of Asia Pacific
- Latin America
- Brazil
- Argentina
- Rest of Latin America
- Middle East & Africa
- GCC Countries
- South Africa
- Rest of the Middle East and Africa
Competitive Landscape
The competitive landscape of the Electric Transporters Market includes key players such as Yadea, Hero MotoCorp, Segway Ninebot, Zero Motorcycles, KYMCO, BMW Motorrad, Yamaha Motor, Niu Technologies, Harley-Davidson, and Giant Group. These companies lead through continuous innovation, technological integration, and diversified product portfolios catering to urban mobility, personal commuting, and recreational applications. Leading manufacturers focus on expanding battery efficiency, range optimization, and lightweight designs to enhance performance and affordability. Strategic alliances, investments in R&D, and geographic expansion are central to market competition. Companies are also leveraging digital connectivity and IoT features to improve user experience. With increasing government incentives for electric mobility and rapid urbanization, the competition is intensifying across two-wheeler and personal transporter categories. Sustainable manufacturing practices and focus on eco-friendly materials are becoming critical factors shaping brand differentiation and long-term competitiveness in the global market.
Shape Your Report to Specific Countries or Regions & Enjoy 30% Off!
Key Player Analysis
- Yadea
- Hero MotoCorp
- Segway Ninebot
- Zero Motorcycles
- KYMCO
- BMW Motorrad
- Yamaha Motor
- Niu Technologies
- Harley-Davidson
- Giant Group
Recent Developments
- In August 2025, Zero Motorcycles began deliveries of its new X Line models (XB and XE) to dealers, positioning a more accessible entry into electric motorcycling.
- In May 2025, Yadea marked the roll-off of its first electric vehicle from its Estado de México factory, expanding its manufacturing footprint in Latin America.
- In April 2025, Yadea began local assembly of electric scooter models in Brazil to better serve the regional market, reducing import dependency.
- In 2024, Zero Motorcycles introduced the 2025 lineup including the Zero XB and XE, with features like removable batteries and switchable traction control
Report Coverage
The research report offers an in-depth analysis based on Electric Vehicle, Voltage, Battery, End Use and Geography. It details leading market players, providing an overview of their business, product offerings, investments, revenue streams, and key applications. Additionally, the report includes insights into the competitive environment, SWOT analysis, current market trends, as well as the primary drivers and constraints. Furthermore, it discusses various factors that have driven market expansion in recent years. The report also explores market dynamics, regulatory scenarios, and technological advancements that are shaping the industry. It assesses the impact of external factors and global economic changes on market growth. Lastly, it provides strategic recommendations for new entrants and established companies to navigate the complexities of the market.
Future Outlook
- The market will expand steadily with increasing demand for eco-friendly urban transport options.
- Governments will continue offering subsidies and incentives to accelerate electric mobility adoption.
- Advancements in battery technology will enhance range, charging speed, and overall efficiency.
- Lightweight materials and compact designs will drive the development of portable transporters.
- Integration of IoT and smart connectivity will improve vehicle monitoring and performance tracking.
- Manufacturers will focus on cost reduction and scalability to attract price-sensitive consumers.
- Expansion of charging infrastructure will support widespread adoption across urban regions.
- Shared mobility and rental platforms will drive additional demand for electric two-wheelers and scooters.
- Collaboration between technology providers and OEMs will boost innovation and production efficiency.
- Asia-Pacific will remain the key growth region, supported by strong manufacturing capabilities and urbanization.


