Market Overview
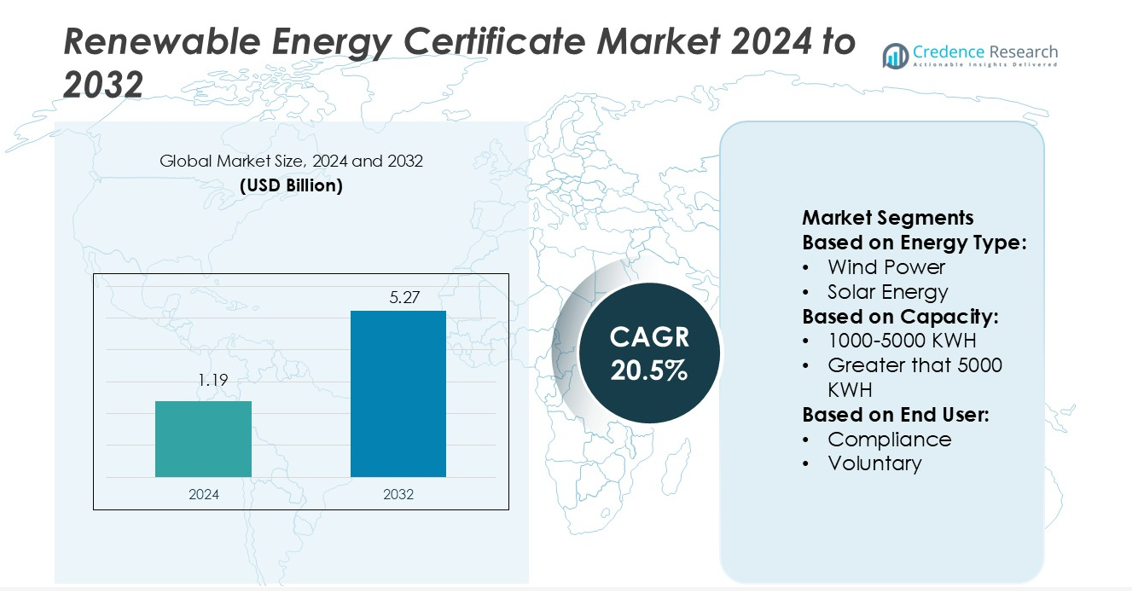
Renewable Energy Certificate Market size was valued USD 1.19 billion in 2024 and is anticipated to reach USD 5.27 billion by 2032, at a CAGR of 20.5% during the forecast period.
| REPORT ATTRIBUTE |
DETAILS |
| Historical Period |
2020-2023 |
| Base Year |
2024 |
| Forecast Period |
2025-2032 |
| Renewable Energy Certificate Market Size 2024 |
USD 1.19 billion |
| Renewable Energy Certificate Market, CAGR |
20.5% |
| Renewable Energy Certificate Market Size 2032 |
USD 5.27 billion |
The Renewable Energy Certificate Market is shaped by leading companies such as Durapower Group, Johnson Controls, Hitachi Energy Ltd., ABB, Abengoa S.A., Exide Technologies, CALMAC, General Electric, Burns & McDonnell, and BYD Company Ltd. These players focus on expanding renewable energy capacity, strengthening trading platforms, and enhancing digital tracking systems to meet growing demand from compliance and voluntary buyers. Strategic investments in wind, solar, and storage projects support steady certificate supply. North America leads the global market with a 36% share, driven by robust regulatory frameworks, corporate sustainability goals, and advanced trading infrastructure that ensure market transparency and liquidity.
Market Insights
- The Renewable Energy Certificate Market was valued at USD 1.19 billion in 2024 and is projected to reach USD 5.27 billion by 2032, growing at a CAGR of 20.5%.
- Strong policy support, rising renewable capacity, and corporate net-zero commitments are driving rapid market growth across both compliance and voluntary segments.
- Digital trading platforms, blockchain integration, and increasing cross-border transactions are shaping key market trends and improving trading efficiency.
- Intense competition among major players and varying regional regulations remain key restraints, limiting uniform market expansion.
- North America leads with a 36% market share, followed by Europe with 28% and Asia Pacific with 22%, while wind power dominates the energy type segment, contributing the largest share to overall certificate issuance.
Access crucial information at unmatched prices!
Request your sample report today & start making informed decisions powered by Credence Research Inc.!
Download Sample
Market Segmentation Analysis:
By Energy Type
Wind power holds the dominant share in the Renewable Energy Certificate Market, accounting for the largest portion of issued certificates. This dominance is driven by large-scale wind farms, cost efficiency, and high capacity factors. Wind energy projects are expanding rapidly in North America, Europe, and parts of Asia, supported by favorable policies and grid integration efforts. Solar energy follows closely as distributed generation grows in urban and rural areas. Hydro-electric and gas power contribute a smaller share but remain essential in ensuring grid stability and supporting mixed renewable portfolios.
- For instance, Durapower Group expanded its Suzhou manufacturing facility with a 2.0 GWh annual battery production capacity, supporting large-scale wind integration projects through advanced energy storage systems.
By Capacity
The 1000–5000 KWh segment leads the Renewable Energy Certificate Market, supported by strong participation from medium-scale energy producers. This segment benefits from stable generation volumes, lower transaction costs, and easier certification processes. Commercial and industrial facilities increasingly adopt mid-range renewable generation to meet sustainability targets. The 0–1000 KWh segment is gaining traction through small community projects and rooftop installations. Systems above 5000 KWh are expanding through utility-scale projects but face longer approval cycles and infrastructure requirements, making them slower to scale compared to mid-range capacity.
- For instance, Johnson Controls’s 23-acre solar-plus-storage campus project delivers about 12,000,000 kWh of generation annually, linking rooftop and building-scale renewables with storage.
By End User
The compliance segment holds the largest market share in the Renewable Energy Certificate Market. Regulatory frameworks and renewable purchase obligations drive strong demand from utilities and large corporations. Governments in multiple regions set binding renewable targets, encouraging obligated entities to secure certificates. Voluntary buyers, including businesses and institutions, are increasing their participation to support corporate sustainability commitments. The growing use of voluntary certificates by technology, manufacturing, and service sectors contributes to market expansion, complementing mandatory procurement programs and strengthening overall market liquidity.
Key Growth Drivers
Rising Corporate Sustainability Targets
Corporate decarbonization strategies are driving strong demand in the Renewable Energy Certificate Market. Businesses are using certificates to offset carbon emissions and meet net-zero goals. This adoption is expanding across manufacturing, retail, and IT sectors, supported by transparent reporting frameworks and ESG disclosures. As more companies commit to 100% renewable energy goals, demand for certificates continues to increase steadily. This driver also benefits from investor pressure and government incentives that encourage the use of certified renewable energy sources.
- For instance, Hitachi Energy in September 2025 announced an expanded large-power-transformer facility near Varennes, Quebec, which will nearly triple annual production capacity at that site and create around 500 new jobs.
Expanding Renewable Energy Capacity
The rapid expansion of renewable power generation capacity supports steady market growth. Large-scale investments in wind, solar, and hydro projects increase the availability of tradable certificates. Governments and private developers are accelerating renewable installations to meet climate targets. This expansion creates a strong foundation for certificate issuance and trading. Higher installed capacity also improves liquidity and market maturity, making the Renewable Energy Certificate Market more attractive for compliance buyers and voluntary participants.
- For instance, ABB’s medium-voltage switchgear enabled the 192 MWp floating solar power plant at Cirata Reservoir in West Java, Indonesia — the plant covers around 250 ha and avoids an estimated 214,000 tons of CO₂ annually.
Supportive Policy and Regulatory Frameworks
Government regulations and renewable purchase obligations are key market growth drivers. Many countries have set binding targets to increase renewable energy adoption, directly supporting certificate demand. Policies such as Renewable Portfolio Standards (RPS) and feed-in tariff schemes encourage utilities and industries to procure certificates. These frameworks also promote market transparency and standardization, boosting investor confidence. Supportive policy environments help stabilize prices and increase trading volumes across compliance and voluntary markets.
Key Trends & Opportunities
Growing Voluntary Market Participation
Voluntary buyers are becoming a significant force in the Renewable Energy Certificate Market. Corporate sustainability goals and consumer demand for clean energy drive this expansion. Technology companies, universities, and municipalities are purchasing certificates to enhance environmental credibility. This trend opens opportunities for innovative certificate products, such as time-matched renewable energy tracking, which can increase buyer confidence and support long-term market stability.
- For instance, Abengoa’s 280 MW gross “Solana Generating Station” parabolic-trough solar plant in Arizona includes a six-hour thermal energy storage system that allows dispatchable electricity production after sunset.
Integration of Digital Trading Platforms
Digitalization is transforming certificate trading through blockchain, AI-driven platforms, and smart contracts. These technologies improve transaction speed, traceability, and transparency. Automated registries reduce administrative costs and help small producers participate in the market. Enhanced trading systems also create opportunities for cross-border certificate transactions, enabling more flexible renewable energy procurement strategies for global corporations.
- For instance, RMB 180 billion cumulative R&D figure was officially reported by BYD in its 2024 financial report. It is important to note that since the report, BYD has continued to invest, with the cumulative amount exceeding RMB 210 billion by September 2025.
Cross-Border REC Market Expansion
Regional market linkages are growing as countries seek harmonized renewable energy frameworks. Cross-border certificate trading allows buyers to access lower-cost renewable sources while meeting sustainability targets. This trend enhances market liquidity and reduces compliance costs for multinational corporations. It also supports developing regions in monetizing their renewable capacity through exportable certificates.
Key Challenges
Price Volatility and Market Uncertainty
Fluctuating certificate prices pose a major challenge for market stability. Policy changes, uneven supply growth, and unpredictable demand patterns can cause sharp price swings. This volatility affects investor confidence and complicates long-term procurement strategies for corporations. Lack of uniform pricing mechanisms across regions further amplifies uncertainty, making it harder for new participants to plan transactions effectively.
Regulatory Fragmentation
Inconsistent policies and regulatory frameworks across countries limit market scalability. Varying eligibility rules, verification standards, and trading procedures create compliance complexity for global buyers. This lack of harmonization also slows cross-border trading and increases administrative costs. Streamlined international standards are essential to address this challenge and support a more integrated, efficient Renewable Energy Certificate Market.
Regional Analysis
North America
North America holds the largest share of 36% in the Renewable Energy Certificate Market. The United States leads with strong regulatory frameworks such as Renewable Portfolio Standards (RPS), driving certificate demand from utilities and corporations. High installed wind and solar capacity supports large-scale issuance, enhancing market liquidity. Canada follows with robust provincial renewable programs and corporate procurement initiatives. The region benefits from advanced digital trading platforms, transparent pricing mechanisms, and growing voluntary participation. Strategic decarbonization targets from major corporations continue to expand market opportunities, strengthening North America’s dominant position in global certificate trading.
Europe
Europe accounts for a 28% share of the Renewable Energy Certificate Market. The region’s leadership is driven by ambitious climate goals and the European Union’s Renewable Energy Directive. Countries such as Germany, the Netherlands, and the Nordic nations have well-established certificate trading systems. High renewable penetration rates, especially in wind and hydro, support consistent supply. Corporate Power Purchase Agreements (PPAs) and cross-border trading enhance market depth. Europe also focuses on standardizing REC frameworks to increase transparency and interoperability, strengthening investor confidence and enabling wider participation from industries and institutional buyers.
Asia Pacific
Asia Pacific holds a 22% share of the Renewable Energy Certificate Market, driven by rapid renewable capacity expansion in China, India, Japan, and Australia. National programs promoting solar and wind energy have created strong supply potential. Corporate sustainability targets and green energy commitments from large industrial players accelerate demand. Many countries are adopting digital certificate trading systems to enhance transparency and accessibility. Cross-border collaboration is increasing within the region, enabling cost-effective renewable sourcing. As governments tighten climate regulations, Asia Pacific is expected to be one of the fastest-growing REC markets over the next decade.
Latin America
Latin America represents a 7% share of the Renewable Energy Certificate Market. Brazil and Chile lead the region with robust renewable energy programs supported by abundant solar and hydro resources. Policy incentives and corporate clean energy goals are driving demand growth. Market development is still in the early stages but gaining momentum through partnerships with international buyers. Grid modernization efforts and favorable investment conditions encourage renewable project expansion, creating a stronger base for certificate issuance. As voluntary participation increases, Latin America is poised to strengthen its position in global renewable energy trading.
Middle East & Africa
The Middle East & Africa region holds a 7% share of the Renewable Energy Certificate Market. The UAE, Saudi Arabia, and South Africa are key contributors, supported by ambitious renewable energy targets and large-scale solar projects. Government-backed initiatives and sustainability commitments from industries are increasing REC adoption. Market maturity remains lower than in other regions, but recent policy developments aim to standardize frameworks and boost investor participation. Ongoing infrastructure investments and cross-border trading agreements are expected to enhance liquidity. This region presents strong growth potential as renewable capacity continues to expand rapidly.
Market Segmentations:
By Energy Type:
By Capacity:
- 1000-5000 KWH
- Greater that 5000 KWH
By End User:
By Geography
- North America
- Europe
- Germany
- France
- U.K.
- Italy
- Spain
- Rest of Europe
- Asia Pacific
- China
- Japan
- India
- South Korea
- South-east Asia
- Rest of Asia Pacific
- Latin America
- Brazil
- Argentina
- Rest of Latin America
- Middle East & Africa
- GCC Countries
- South Africa
- Rest of the Middle East and Africa
Competitive Landscape
The Renewable Energy Certificate Market features strong competition among major players including Durapower Group, Johnson Controls, Hitachi Energy Ltd., ABB, Abengoa S.A., Exide Technologies, CALMAC, General Electric, Burns & McDonnell, and BYD Company Ltd. The Renewable Energy Certificate Market is highly competitive, driven by rapid technological advancements, regulatory mandates, and growing corporate sustainability commitments. Companies are investing in advanced trading platforms, blockchain solutions, and digital tracking systems to enhance transparency and reduce transaction complexities. Strong competition arises from both compliance and voluntary markets as utilities, corporations, and renewable producers seek to secure stable certificate flows. Strategic partnerships, long-term procurement agreements, and regional market linkages are shaping competitive strategies. Innovation in energy storage integration, cross-border trading, and real-time tracking continues to strengthen market maturity and expand global participation.
Shape Your Report to Specific Countries or Regions & Enjoy 30% Off!
Key Player Analysis
Recent Developments
- In February 2025, GridStor a utility-scale battery energy storage systems manufacturer acquired 150 MW battery storage project, Texas from Balanced Rock Power. The acquisition will help company to expand its presence in the state and is estimated to benefit off of upcoming increase in energy demand by 2030.
- In February 2025, Fluence Energy developed Smartstack a grid-scale battery energy storage system. The system offers 7.5 MWh of energy storage. The system is designed so that to avoid the hustle of large container instead is easy to move.
- In February 2024, LG Energy Solution agreed with WesCEF to expand and strengthen its lithium supply chain for competitive procurement. As per the agreement, WesCEF is poised to supply up to 85,000 tons of lithium concentrate, a crucial raw material for cathodes.
- In January 2024, Spearmint Energy announced the completion of the 300-megawatt Revolution BESS project. The Electric Reliability Council of Texas will be responsible for managing, distributing, and marketing the power
Report Coverage
The research report offers an in-depth analysis based on Energy Type, Capacity, End-User and Geography. It details leading market players, providing an overview of their business, product offerings, investments, revenue streams, and key applications. Additionally, the report includes insights into the competitive environment, SWOT analysis, current market trends, as well as the primary drivers and constraints. Furthermore, it discusses various factors that have driven market expansion in recent years. The report also explores market dynamics, regulatory scenarios, and technological advancements that are shaping the industry. It assesses the impact of external factors and global economic changes on market growth. Lastly, it provides strategic recommendations for new entrants and established companies to navigate the complexities of the market.
Future Outlook
- The market will grow steadily with rising global renewable energy adoption.
- Digital platforms will improve certificate traceability and trading efficiency.
- Corporate net-zero commitments will drive higher voluntary demand.
- Cross-border trading will expand as countries align renewable policies.
- Policy standardization will reduce market fragmentation and increase investor confidence.
- Energy storage integration will support more flexible certificate generation.
- New tracking technologies will enhance transparency and market reliability.
- Government decarbonization targets will sustain compliance market growth.
- Regional cooperation will create larger and more liquid trading markets.
- Technological innovation will accelerate market expansion and participation.


