Market overview
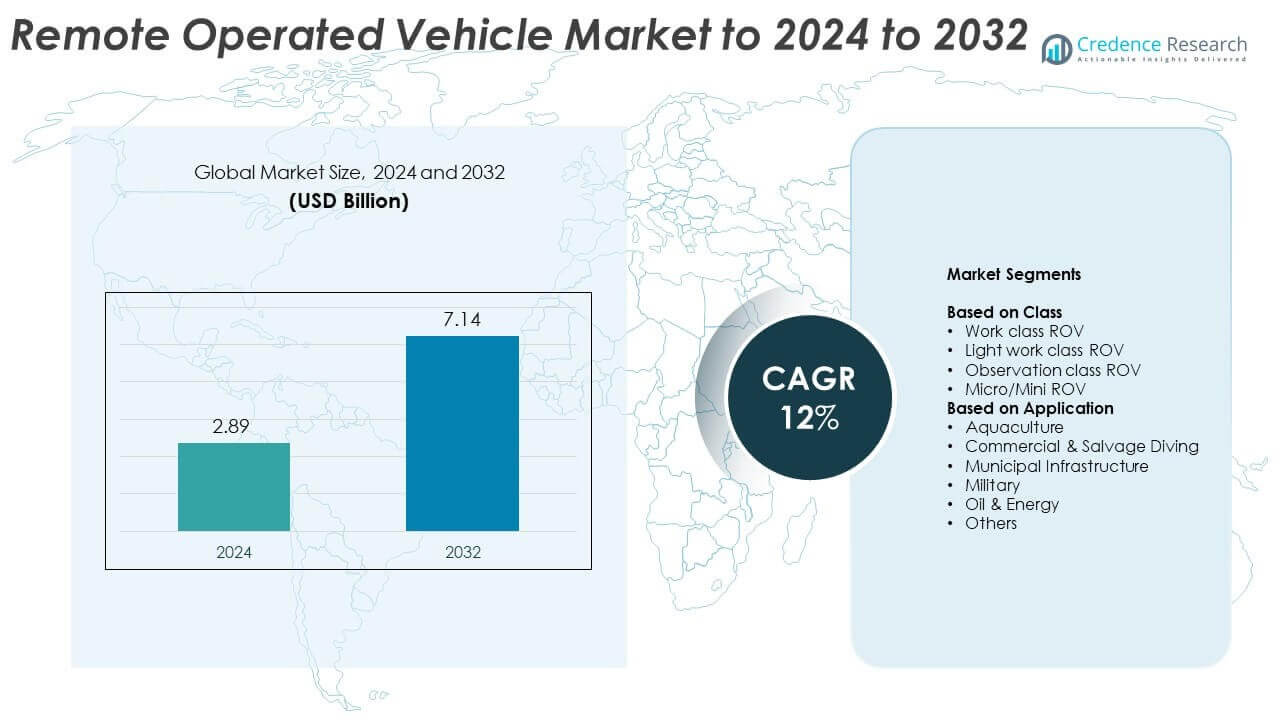
Remote Operated Vehicle Market size was valued USD 2.89 Billion in 2024 and is anticipated to reach USD 7.14 Billion by 2032, at a CAGR of 12% during the forecast period.
| REPORT ATTRIBUTE |
DETAILS |
| Historical Period |
2020-2023 |
| Base Year |
2024 |
| Forecast Period |
2025-2032 |
| Remote Operated Vehicle Market Size 2024 |
USD 2.89 Billion |
| Remote Operated Vehicle Market, CAGR |
12% |
| Remote Operated Vehicle Market Size 2032 |
USD 7.14 Billion |
The Remote Operated Vehicle (ROV) market is highly competitive, with key players including TechnipFMC, Subsea 7, Oceaneering, Saab Seaeye, DOF Subsea, Forum Energy Technologies, and Teledyne Marine. These companies focus on expanding their subsea capabilities through advanced robotics, automation, and digital control systems. Strategic partnerships and R&D investments in deep-water operations strengthen their market positioning. North America led the global market with a 38% share in 2024, supported by extensive offshore oil and gas exploration, strong defense applications, and technological innovation. Europe followed with 29%, driven by active offshore wind and subsea infrastructure projects across the North Sea region
Market Insights
- The Remote Operated Vehicle market was valued at USD 2.89 billion in 2024 and is projected to reach USD 7.14 billion by 2032, growing at a CAGR of 12%.
• Growth is driven by expanding offshore oil and gas activities, rising underwater defense applications, and advancements in autonomous control and imaging technologies.
• The market is witnessing a trend toward compact, AI-enabled, and energy-efficient ROVs for complex deep-sea operations and environmental monitoring.
• Competition remains strong as major players focus on innovation, modular designs, and partnerships with energy and naval sectors to enhance operational capabilities.
• North America led with a 38% share in 2024, followed by Europe with 29% and Asia-Pacific with 24%, while the work class ROV segment dominated with a 47% share supported by its critical use in offshore exploration and subsea maintenance.
Access crucial information at unmatched prices!
Request your sample report today & start making informed decisions powered by Credence Research Inc.!
Download Sample
Market Segmentation Analysis:
By Class
The work class ROV segment dominated the market with a 47% share in 2024. These systems are widely used for deep-water oil and gas operations, pipeline inspections, and subsea maintenance due to their high power and lifting capabilities. Increasing offshore exploration activities and demand for subsea infrastructure inspection are driving adoption. Observation class ROVs are gaining traction in marine research and environmental monitoring due to their compact design and cost efficiency. The rising need for real-time underwater data acquisition also supports the growth of light work class and micro ROV segments.
- For instance, in the 2024 offshore AUV and ROV market, Work-class vehicles were dominant, commanding approximately 74% market share, while Observatory-class vehicles represented approximately 26%.
By Application
The oil and energy segment held the largest share of 51% in 2024, driven by extensive offshore drilling and subsea construction projects. ROVs are essential for pipeline inspection, maintenance, and underwater equipment installation in harsh ocean environments. The military segment is also expanding, supported by naval modernization programs and mine countermeasure operations. Aquaculture and municipal infrastructure applications are growing as underwater robots assist in monitoring fish farms and inspecting submerged pipelines. Increasing investment in underwater robotics for sustainable resource management continues to fuel market growth across these applications.
- For instance, the oil and gas sector dominated the offshore AUV and ROV market, holding approximately 83% of the total market share in 2024. Defense, aquaculture, and municipal uses also continued to expand.
Key Growth Drivers
Rising Offshore Oil and Gas Exploration
Expanding deep-water and ultra-deep-water drilling activities are significantly driving ROV market growth. Oil and gas operators are increasingly using work-class ROVs for subsea inspection, maintenance, and repair operations at extreme depths. These systems enhance operational safety and efficiency in hazardous underwater environments. Growing energy demand and new offshore field developments across regions such as the Gulf of Mexico and North Sea continue to strengthen market adoption, positioning offshore energy exploration as a primary growth catalyst.
- For instance, North Sea hosts 1,500+ platforms; GoM has 1,500 over 30 years old. Decommissioning and integrity checks lift ROV demand. Shell operates across both basins.
Increasing Adoption in Defense and Security Applications
Defense agencies are rapidly integrating ROVs for underwater surveillance, mine detection, and recovery missions. Their ability to operate in high-pressure environments and deliver real-time imaging enhances situational awareness and mission safety. Modern ROVs equipped with advanced sonar and camera systems are aiding naval operations globally. Rising maritime security threats and government investments in naval modernization programs are further fueling deployment. This rising defense utilization remains a major growth driver for the global market.
- For instance, NATO placed a €60 million order for mine-disposal underwater vehicles. Exail’s K-Ster C supports expanding naval MCM missions.
Advancements in Underwater Robotics Technology
Technological innovation in autonomous control, artificial intelligence, and sensor integration is enhancing ROV efficiency and performance. The use of advanced vision systems, fiber-optic cables, and modular designs is reducing operational costs and improving data accuracy. Compact ROV models with enhanced maneuverability are enabling broader applications in research and infrastructure inspection. The shift toward automation and remote operations is also increasing ROV deployment in offshore and environmental sectors, making technological advancement a critical growth enabler.
Key Trends & Opportunities
Expansion of Renewable Energy Projects
The growing offshore wind energy sector is creating new opportunities for ROV applications. ROVs are vital for inspecting turbine foundations, cables, and underwater structures in wind farms. Governments promoting renewable energy investments are encouraging offshore project development in Europe and Asia-Pacific. The increasing need for regular underwater maintenance of renewable infrastructure enhances demand for lightweight and cost-effective ROV systems, presenting strong market opportunities in the sustainable energy sector.
- For instance, wind added a record 117 GW of capacity globally in 2024, with 8 GW of that being offshore capacity. This brought the global offshore wind capacity to 83.2 GW by the end of 2024.
Integration of Artificial Intelligence and Automation
AI-driven ROVs are transforming underwater operations through autonomous navigation and predictive maintenance capabilities. Machine learning algorithms enable real-time object detection and mapping in complex seabed environments. The integration of automation reduces human intervention, improving safety and operational precision. These advancements are making ROVs smarter and more adaptable across industries such as oil exploration, defense, and marine research, representing a key opportunity for innovation-led market expansion.
- For instance, ROV3D cut array-cable checks to <30 minutes per cable. Faster, high-fidelity 3D change detection trims O&M cost. Ashtead Technology shows proven workflows.
Emerging Use in Aquaculture and Environmental Monitoring
ROVs are increasingly used in aquaculture to monitor fish stocks, seabed conditions, and underwater equipment. They help improve efficiency in feeding operations and reduce environmental impact. Similarly, environmental agencies deploy small-scale ROVs for coral reef inspection and pollution monitoring. The growing awareness of marine ecosystem conservation and demand for sustainable fish farming practices are expanding ROV applications, creating long-term opportunities in the blue economy sector.
Key Challenges
High Operational and Maintenance Costs
ROV systems involve high initial investment and maintenance expenses, which limit adoption among small and medium enterprises. The costs associated with skilled operators, repair, and underwater operations make them less viable for low-budget projects. Offshore environments further increase wear and tear, leading to higher upkeep needs. This cost barrier remains a key challenge for expanding ROV utilization in emerging economies and smaller commercial operations.
Limited Connectivity and Depth Constraints
ROVs depend heavily on tethered communication systems, which restrict movement and operational depth. In harsh underwater environments, connectivity issues can lead to data loss or mission delays. These technical constraints hinder performance in deep-sea exploration and long-duration operations. Efforts to develop hybrid and wireless ROV systems are underway, but limitations in power supply and signal transmission continue to pose challenges to full operational autonomy.
Regional Analysis
North America
North America held the largest share of 38% in 2024, driven by strong adoption across offshore oil and gas, defense, and subsea infrastructure projects. The United States dominates due to significant offshore drilling activities in the Gulf of Mexico and growing naval modernization efforts. The region benefits from advanced ROV technology development and established players offering high-performance systems. Increasing demand for deep-sea exploration and underwater maintenance in energy and environmental monitoring continues to enhance regional market growth and innovation investment.
Europe
Europe accounted for a 29% share in 2024, supported by robust offshore energy and renewable infrastructure projects. The United Kingdom, Norway, and the Netherlands are key contributors due to active North Sea operations and offshore wind installations. Growing demand for subsea inspection and pipeline monitoring has accelerated ROV utilization. European defense agencies are also expanding ROV adoption for maritime surveillance and mine detection. The region’s focus on sustainable marine research and advanced underwater robotics development further strengthens market growth potential.
Asia-Pacific
Asia-Pacific captured a 24% share in 2024, fueled by rapid industrial expansion, increasing offshore exploration, and strong investment in aquaculture and energy sectors. China, Japan, and India are leading adopters, driven by growing subsea construction and marine research activities. Rising coastal infrastructure projects and defense modernization programs support continuous demand for ROVs. The expansion of offshore wind farms and marine conservation initiatives across Southeast Asia enhances opportunities for lightweight and observation-class ROV deployment in diverse applications.
Middle East & Africa
The Middle East & Africa region held a 6% share in 2024, primarily driven by oil-rich nations such as Saudi Arabia, the UAE, and Nigeria. The regional market benefits from extensive offshore oilfield development and pipeline maintenance operations. Investment in underwater surveillance and inspection systems is increasing as energy companies adopt automation to improve efficiency. Deep-water exploration in African coastal areas and maritime infrastructure modernization across GCC countries further contribute to ROV deployment in this region.
Latin America
Latin America accounted for a 3% share in 2024, led by offshore oil and gas activities in Brazil and Mexico. National oil companies are increasingly deploying work-class ROVs for subsea monitoring and repair tasks. The region is also witnessing growing research interest in underwater ecosystems and renewable energy infrastructure. Government-led offshore projects and environmental monitoring programs are boosting ROV adoption. Although market penetration remains moderate, increasing exploration in deep-water fields is expected to strengthen long-term growth prospects.
Market Segmentations:
By Class
- Work class ROV
- Light work class ROV
- Observation class ROV
- Micro/Mini ROV
By Application
- Aquaculture
- Commercial & Salvage Diving
- Municipal Infrastructure
- Military
- Oil & Energy
- Others
By Geography
- North America
- Europe
- Germany
- France
- Italy
- U.K.
- Russia
- Rest of Europe
- Asia-Pacific
- India
- China
- Japan
- Rest of Asia-Pacific
- Latin America
- Brazil
- Mexico
- Rest of Latin America
- Middle East and Africa
- GCC Countries
- South Africa
- Rest of Middle East and Africa
Competitive Landscape
The Remote Operated Vehicle (ROV) market features major players such as TechnipFMC, Subsea 7, Oceaneering, Saab Seaeye, DOF Subsea, Forum Energy Technologies, Total Marine Technology, Teledyne Marine, Deep Trekker, VideoRay, SEAMOR, and N-Sea. These companies compete through technological innovation, product differentiation, and service reliability to meet the growing demand for deep-sea operations. The market is defined by strong R&D initiatives, focusing on AI-enabled navigation, advanced imaging systems, and autonomous control technologies. Strategic collaborations with energy and defense sectors are expanding deployment opportunities. Companies emphasize modular and lightweight ROV designs to enhance versatility and lower operational costs. Investments in digital integration and real-time data systems are improving performance in harsh underwater conditions. Continuous focus on efficiency, sustainability, and enhanced depth capability is strengthening global competitiveness, while expanding offshore exploration, renewable projects, and defense applications continue to shape long-term industry growth.
Shape Your Report to Specific Countries or Regions & Enjoy 30% Off!
Key Player Analysis
- TechnipFMC
- Subsea 7
- Oceaneering
- Saab Seaeye
- DOF Subsea
- Forum Energy Technologies
- Total Marine Technology
- Teledyne Marine
- Deep Trekker
- VideoRay
- SEAMOR
- N-Sea
Recent Developments
- In 2024, Saab Seaeye Completed inshore water trials for its Seaeye SR20 eWROV, a fully electric, work-class ROV.
- In 2024, Teledyne Marine Showcased a range of underwater vehicles and other marine technologies at the ONS 2024 conference.
- In 2024, N-Sea announced plans to expand its fleet with a new hybrid survey and remotely operated vehicle (ROV) support vessel named Geo Master, scheduled for delivery in 2026.
Report Coverage
The research report offers an in-depth analysis based on Class, Application and Geography. It details leading market players, providing an overview of their business, product offerings, investments, revenue streams, and key applications. Additionally, the report includes insights into the competitive environment, SWOT analysis, current market trends, as well as the primary drivers and constraints. Furthermore, it discusses various factors that have driven market expansion in recent years. The report also explores market dynamics, regulatory scenarios, and technological advancements that are shaping the industry. It assesses the impact of external factors and global economic changes on market growth. Lastly, it provides strategic recommendations for new entrants and established companies to navigate the complexities of the market.
Future Outlook
- The market will expand steadily with increasing offshore oil and gas exploration activities.
- Technological advancements in AI and automation will improve operational efficiency of ROVs.
- Defense and naval sectors will adopt ROVs widely for surveillance and mine detection operations.
- Growing offshore wind and renewable energy projects will boost ROV deployment.
- Compact and lightweight ROV models will gain demand for aquaculture and environmental monitoring.
- Integration of advanced sensors and imaging systems will enhance underwater inspection capabilities.
- Remote operations and autonomous control will reduce human intervention and improve safety.
- Increased research investments in marine biodiversity will strengthen ROV applications in scientific exploration.
- Emerging economies will witness higher adoption due to rising infrastructure and energy developments.
- Continuous innovation and hybrid ROV designs will create opportunities for cost-effective deep-sea operations.


