Home » Healthcare » Vitamin C Injection Market

Vitamin C Injection Market By Product Type (Standard Ascorbic Acid Injection, Sustained Release / Modified Formulations); By Application (Nutritional Supplementation, Clinical Therapy [e.g., Critical Care, Deficiency Treatment]); By End User (Hospitals & Clinics, Specialty Clinics, Pharmaceutical Distributors) – Growth, Share, Opportunities & Competitive Analysis, 2024 – 2032

Report ID: 167996 | Report Format : Excel, PDF

Market Overview:

The Global Vitamin C Injection Market size was valued at USD 7,079.22 million in 2018 to USD 11,832.46 million in 2024 and is anticipated to reach USD 24,258.52 million by 2032, at a CAGR of 8.75% during the forecast period.

REPORT ATTRIBUTE DETAILS
Historical Period 2020-2023
Base Year 2024
Forecast Period 2025-2032
Vitamin C Injection Market Size 2024 USD 11,832.46 Million
Vitamin C Injection Market, CAGR 8.75%
Vitamin C Injection Market Size 2032 USD 24,258.52 Million


Market growth is driven by rising awareness of the clinical benefits of vitamin C in immune support, oxidative stress reduction, and tissue repair. Physicians increasingly adopt injectable forms to treat deficiency conditions and assist in chronic disease management. Growing interest in preventive healthcare, combined with expanding wellness tourism, reinforces product demand. Pharmaceutical advancements in stabilized formulations and shelf-life extension further strengthen industry competitiveness.

Regionally, North America leads the market due to its developed healthcare infrastructure, regulatory clarity, and established infusion therapy practices. Europe maintains strong growth through expanding clinical and aesthetic applications. The Asia Pacific region is emerging as the fastest-growing market, supported by healthcare modernization, rising disposable income, and growing wellness awareness. Latin America, the Middle East, and Africa show gradual improvement as governments enhance healthcare access and local distribution networks expand to meet increasing demand for injectable nutrient therapies.

Access crucial information at unmatched prices!

Request your sample report today & start making informed decisions powered by Credence Research Inc.!

Download Sample

Market Insights:

  • The Global Vitamin C Injection Market was valued at USD 7,079.22 million in 2018, reached USD 11,832.46 million in 2024, and is projected to attain USD 24,258.52 million by 2032, registering a CAGR of 8.75%.
  • North America leads with about 44% share due to its strong healthcare system, advanced clinical infrastructure, and growing adoption of intravenous vitamin therapies across hospitals and wellness centers.
  • Europe follows with around 27% share, supported by high preventive healthcare spending, regulatory stability, and rising integration of vitamin therapies in medical and aesthetic practices.
  • Asia Pacific, holding roughly 21% share, is the fastest-growing region driven by healthcare modernization, expanding wellness tourism, and increasing consumer spending on preventive care.
  • Standard Ascorbic Acid Injection holds the majority segment share at about 65%, while Sustained Release or Modified Formulations represent nearly 35%, reflecting a steady shift toward long-acting therapeutic solutions.

Vitamin C Injection Market

Market Drivers

Rising Clinical Adoption in Immune and Metabolic Therapy

The Global Vitamin C Injection Market gains momentum from its increasing use in clinical treatments addressing immune deficiencies and metabolic disorders. Physicians prefer injectable vitamin C formulations for faster absorption and targeted delivery in hospitalized or immunocompromised patients. It supports tissue repair, wound healing, and antioxidant defense, which improve recovery outcomes. Hospitals integrate vitamin C therapy into oncology and post-surgical care, strengthening its medical relevance. Nutraceutical firms promote high-dose vitamin C infusions for chronic fatigue and oxidative stress management. Demand rises in countries emphasizing preventive health solutions. Growing clinical validation drives its integration into hospital formularies. Expansion in healthcare infrastructure further supports adoption.

  • For instance, a pilot clinical study by the Riordan Clinic demonstrated that intravenous vitamin C at doses ranging from 7.5 g to 50 g in rheumatoid arthritis (RA) patients reduced inflammation as measured by C-reactive protein (CRP) by an average of 44%.

Expanding Use in Aesthetic and Wellness Clinics

A growing preference for intravenous therapy in cosmetic and wellness centers accelerates product penetration. Clinics offer vitamin C drips for skin brightening, collagen stimulation, and overall rejuvenation. It aligns with rising consumer interest in anti-aging solutions and natural skincare regimens. The trend reflects shifting perceptions of wellness from treatment to proactive care. Wellness chains in urban markets promote vitamin C injections as part of premium detox programs. Medical spas and dermatology clinics witness repeat clientele due to visible benefits. Social media exposure boosts awareness among younger populations. These factors jointly strengthen product visibility and acceptance.

  • For instance, clinical pharmacology studies confirm that intravenous vitamin C can achieve plasma concentrations 30 to 70 times higher than oral intake, enabling greater systemic antioxidant activity and improved bioavailability for therapeutic applications.

Growing Awareness of Nutrient Deficiency and Preventive Healthcare

Public health campaigns highlight micronutrient deficiency and its long-term risks, enhancing product demand. Vitamin C injection ensures rapid correction of deficiencies, especially in patients unable to tolerate oral intake. It helps reduce fatigue, improve immune response, and enhance overall vitality. Health ministries in developing regions endorse supplementation programs targeting malnutrition. Awareness about intravenous therapy safety encourages usage among at-risk groups. Hospitals include vitamin C therapy for acute infections and recovery support. It benefits from rising public confidence in injectable nutrition therapy. Preventive healthcare awareness continues to sustain long-term market expansion.

R&D Innovation in Pharmaceutical Formulations and Stability

Advancements in formulation technology enhance vitamin C injection stability and shelf life. Manufacturers focus on reducing oxidation risks and improving storage performance. It allows broader distribution in varied climatic conditions. Research initiatives target better biocompatibility and sustained-release mechanisms. Pharmaceutical firms develop new packaging materials that protect against degradation. These improvements reduce wastage and ensure consistent potency. Regulatory approvals for improved compositions expand manufacturer competitiveness. Continuous investment in product innovation drives growth across hospital and retail distribution channels.

Vitamin C Injection Market Share

Market Trends

Integration of Injectable Vitamins in Preventive Healthcare Programs

Healthcare systems integrate injectable vitamins within preventive health programs targeting immunity and nutrition. The Global Vitamin C Injection Market benefits from hospitals offering infusion therapies for high-risk groups. Preventive health centers in developed economies include vitamin infusions in their wellness packages. It gains adoption among health-conscious consumers seeking non-oral nutrient delivery. Insurance providers gradually include coverage for medically indicated vitamin therapies. Corporate wellness programs promote intravenous nutrition sessions to boost employee health. Public-private initiatives in healthcare reinforce clinical credibility. This integration trend supports consistent market growth.

  • For instance, the CITRIS-ALI randomized clinical trial (NCT02106975), conducted by the Cleveland Clinic and collaborators, evaluated high-dose intravenous vitamin C infusions of up to 50 grams over 96 hours in ICU patients with sepsis and acute respiratory distress syndrome, documenting outcomes using biomarkers and organ failure scores.

Rise of Personalized Nutrition and Intravenous Therapy Customization

The growing focus on personalized medicine drives customized vitamin C infusion solutions. Clinics design dosage and infusion frequency based on genetic and metabolic profiling. It allows healthcare providers to align therapy with individual health goals. Technology-enabled diagnostic tools help tailor intravenous nutrition plans. Pharmaceutical firms collaborate with diagnostic companies to deliver patient-specific formulations. Data-driven care enhances treatment outcomes and patient satisfaction. Personalized approaches attract premium customers seeking measurable benefits. This trend strengthens long-term demand for vitamin C injections in advanced clinical settings.

  • For example, the treatment ASCOR® Ascorbic Acid Injection is approved for short-term use in adults and children (from five months old) when oral administration is insufficient, demonstrating an established injectable vitamin C formulation.

Expansion of E-commerce and Direct-to-Consumer Wellness Platforms

Online wellness platforms expand access to vitamin C injections through certified telehealth services. Consumers can schedule home infusion sessions via licensed practitioners. It simplifies therapy access for urban professionals and aging populations. E-commerce channels educate buyers on clinical-grade formulations and usage safety. Healthcare startups offer bundled intravenous packages combining vitamin C with minerals and antioxidants. These services build brand loyalty through subscription-based delivery. It demonstrates growing digital transformation within healthcare delivery. The fusion of e-commerce and intravenous therapy distribution reshapes traditional sales models.

Sustainable Manufacturing and Eco-Friendly Packaging Initiatives

Manufacturers adopt eco-friendly practices to reduce the environmental impact of pharmaceutical production. Firms invest in biodegradable materials and recyclable packaging. It aligns with global sustainability regulations and consumer expectations. Energy-efficient manufacturing reduces carbon footprints across supply chains. Leading producers aim to achieve zero-waste operations by optimizing resource use. Sustainability certifications improve brand credibility and appeal to ethical consumers. Partnerships with green packaging suppliers strengthen compliance with environmental norms. This trend enhances industry reputation and supports regulatory approval efficiency.

Market Challenges Analysis

High Manufacturing Costs and Stringent Regulatory Requirements

The Global Vitamin C Injection Market faces rising production costs linked to raw material purity and sterilization standards. Vitamin C’s chemical instability demands specialized handling and packaging, increasing operational expenses. It challenges small manufacturers competing with established pharmaceutical brands. Regulatory frameworks for injectable vitamins require rigorous testing and approval timelines. Firms must meet clinical safety standards and stability benchmarks for commercial release. Non-compliance risks delay market entry and erode profitability. Costly R&D investments strain companies in emerging economies. This restricts product diversity and slows expansion across untapped markets.

Limited Access and Uneven Awareness Across Developing Regions

Developing regions encounter limited healthcare access and inadequate intravenous therapy infrastructure. Vitamin C injection distribution often relies on urban hospital networks, leaving rural populations underserved. It faces logistical hurdles such as cold-chain maintenance and supply chain fragmentation. Awareness among general practitioners remains low in certain economies, delaying clinical adoption. Patients often rely on oral supplements due to limited availability of trained infusion specialists. Economic constraints limit out-of-pocket spending on preventive therapies. Government support programs remain inconsistent across low-income countries. These challenges hinder balanced global growth and equitable healthcare reach.

Market Opportunities

Expansion in Integrative and Preventive Healthcare Services

Growing acceptance of integrative medicine creates opportunities for vitamin C infusion centers. The Global Vitamin C Injection Market benefits from the inclusion of injectable vitamins in complementary therapies. Hospitals and wellness chains explore partnerships to deliver advanced IV nutrition packages. It gains traction among professionals seeking faster recovery and immune enhancement. Expansion into occupational health and chronic disease management widens revenue streams. Increasing public-private healthcare collaborations create entry points for innovation. Rising global focus on disease prevention ensures continued product relevance. These developments strengthen cross-sector demand for injectable nutrition solutions.

Technological Advancements and New Delivery Mechanisms

Ongoing innovations in formulation and delivery systems open new commercial avenues. Stabilized vitamin C variants enable extended shelf life and improved bioavailability. It encourages broader adoption in clinics with limited storage infrastructure. Automated infusion devices enhance dosing precision and patient safety. Biotechnology firms invest in nanocarrier and encapsulation research to optimize therapeutic efficacy. Collaborative R&D initiatives accelerate regulatory approval and market entry. Such advances increase treatment reliability and clinical acceptance. Future expansion in automated and portable infusion systems will further enhance adoption rates.

Market Segmentation Analysis:

The Global Vitamin C Injection Market is segmented by product type, application, and end user.

By product type, Standard Ascorbic Acid Injection dominates due to its widespread clinical use and proven efficacy in treating deficiencies. Hospitals and healthcare professionals prefer this formulation for its stability and low cost. Sustained Release or Modified Formulations are gaining traction as they offer prolonged bioavailability and reduced dosing frequency. These innovations appeal to wellness centers and outpatient facilities focusing on convenience and patient comfort.

  • For instance, Nutriventia developed C-Fence, a patented sustained-release vitamin C formulation that maintained elevated blood plasma levels for 24 hours in a published pharmacokinetic study, confirming its technology’s validated release profile and enhanced nutrient bioavailability.

By application, Nutritional Supplementation represents the largest share, supported by growing awareness of vitamin deficiency and preventive healthcare practices. Vitamin C injections are used in wellness programs and aesthetic treatments to enhance skin health and immunity. Clinical Therapy applications continue to expand in critical care, oncology, and infection management where rapid nutrient replenishment is necessary. This segment benefits from increasing adoption in hospital-based treatment protocols and recovery programs.

By end user, Hospitals and Clinics lead the market due to consistent patient inflow and government-supported healthcare infrastructure. Specialty Clinics show rising demand driven by aesthetic and wellness therapies emphasizing antioxidant benefits. Pharmaceutical Distributors play a key role in ensuring product availability and regulatory compliance across diverse regional markets. It continues to grow steadily, supported by evolving distribution networks and strong collaborations between manufacturers and healthcare providers. This segmentation highlights the diverse applications and expanding adoption base across medical and preventive care settings.

  • For instance, Foodchem International Corporation, headquartered in Shanghai, is a verified global supplier of vitamin C (ascorbic acid) and other nutritional ingredients, holding ISO 9001, ISO 22000, and Halal certifications that ensure compliance with international food and pharmaceutical quality standards.

Vitamin C Injection Market SegmentationSegmentation:

By Product Type

  • Standard Ascorbic Acid Injection
  • Sustained Release / Modified Formulations

By Application

  • Nutritional Supplementation
  • Clinical Therapy (e.g., critical care, deficiency treatment)

By End User

  • Hospitals & Clinics
  • Specialty Clinics
  • Pharmaceutical Distributors

By Region

  • North America
    • U.S.
    • Canada
    • Mexico
  • Europe
    • Germany
    • France
    • U.K.
    • Italy
    • Spain
    • Rest of Europe
  • Asia Pacific
    • China
    • Japan
    • India
    • South Korea
    • South-east Asia
    • Rest of Asia Pacific
  • Latin America
    • Brazil
    • Argentina
    • Rest of Latin America
  • Middle East & Africa
    • GCC Countries
    • South Africa
    • Rest of the Middle East and Africa

Regional Analysis:

North America

The North America Global Vitamin C Injection Market size was valued at USD 3,136.97 million in 2018 to USD 5,189.57 million in 2024 and is anticipated to reach USD 10,668.61 million by 2032, at a CAGR of 8.8% during the forecast period. North America holds approximately 44% of the global revenue share. Growth is driven by widespread adoption of intravenous vitamin therapy across hospitals, wellness clinics, and preventive care centers. The region benefits from advanced healthcare systems and high consumer awareness of micronutrient deficiencies. Regulatory clarity from the FDA and strong pharmaceutical R&D ecosystems support consistent product development. Demand in the U.S. remains strong due to growing use in oncology and metabolic care. Clinics in Canada and Mexico expand infusion-based wellness programs, reinforcing market expansion. Increasing partnerships between pharmaceutical firms and nutrition brands improve access to injectable vitamin formulations.

Europe

The Europe Global Vitamin C Injection Market size was valued at USD 1,969.68 million in 2018 to USD 3,171.18 million in 2024 and is anticipated to reach USD 6,113.32 million by 2032, at a CAGR of 7.9% during the forecast period. Europe accounts for about 27% of the overall global market share. Strong healthcare infrastructure and regulatory consistency from the EMA promote product safety and compliance. Countries such as Germany, France, and the U.K. lead demand through hospital-based infusion therapies and clinical nutrition programs. Rising preventive health awareness and government initiatives promoting nutritional care strengthen adoption. Pharmaceutical firms focus on improving product stability and cost efficiency to meet regional storage standards. The growth of private healthcare and wellness tourism in Southern Europe widens access to injectable therapies.

Asia Pacific

The Asia Pacific Global Vitamin C Injection Market size was valued at USD 1,318.40 million in 2018 to USD 2,394.53 million in 2024 and is anticipated to reach USD 5,579.69 million by 2032, at a CAGR of 10.5% during the forecast period. The region contributes nearly 21% of the total global revenue. Strong population growth and rapid healthcare modernization drive vitamin C injection adoption. Demand in China, Japan, and India accelerates due to expanding clinical applications and medical aesthetics. It benefits from government spending on preventive healthcare and nutrition awareness programs. Rising disposable income supports wellness infusion services in urban centers. Local pharmaceutical manufacturers invest in cost-effective production for export and domestic markets. Increasing collaborations with hospitals and wellness clinics enhance product reach and affordability.

Latin America

The Latin America Global Vitamin C Injection Market size was valued at USD 335.17 million in 2018 to USD 553.26 million in 2024 and is anticipated to reach USD 1,004.25 million by 2032, at a CAGR of 7.1% during the forecast period. Latin America represents around 4% of the global market share. Brazil and Mexico dominate regional consumption due to expanding private healthcare sectors. Rising incidence of nutritional deficiencies and chronic fatigue fuels medical use of vitamin C infusions. It gains traction among beauty clinics offering skin rejuvenation treatments. Government incentives for domestic pharmaceutical production improve supply chain resilience. Distribution partnerships between hospitals and wellness providers strengthen market accessibility. Public health campaigns promoting intravenous nutrient therapy further encourage uptake in urban centers.

Middle East

The Middle East Global Vitamin C Injection Market size was valued at USD 193.58 million in 2018 to USD 295.08 million in 2024 and is anticipated to reach USD 507.94 million by 2032, at a CAGR of 6.4% during the forecast period. The region accounts for nearly 2% of the global share. Growth is supported by increasing awareness of preventive medicine and rising healthcare spending in the UAE and Saudi Arabia. Hospitals integrate injectable vitamins into metabolic and recovery treatments. It benefits from the expansion of private healthcare infrastructure and medical tourism. Pharmaceutical importers collaborate with European suppliers to ensure consistent product availability. High-income consumers in Gulf countries adopt infusion-based therapies through wellness clinics. Regulatory standardization across the GCC fosters a stable operating environment for producers.

Africa

The Africa Global Vitamin C Injection Market size was valued at USD 125.43 million in 2018 to USD 228.83 million in 2024 and is anticipated to reach USD 384.72 million by 2032, at a CAGR of 6.1% during the forecast period. Africa contributes approximately 2% of the global revenue share. Market expansion is led by South Africa, Egypt, and Nigeria, where healthcare access and nutritional awareness are improving. Vitamin C injections are gaining importance in hospitals treating deficiencies and immune-related illnesses. It faces infrastructure limitations but benefits from donor-funded healthcare initiatives. Local distributors expand access through partnerships with clinics and pharmaceutical retailers. Urbanization and growing wellness culture stimulate demand for preventive therapies. International manufacturers increasingly target African markets with affordable injection formats suited to local conditions.

Key Player Analysis:

  • BASF SE
  • DSM Nutritional Products
  • Coca-Cola HBC (Pharma Division)
  • Cargill, Inc.
  • Mylan Pharmaceuticals

Competitive Analysis:

The Global Vitamin C Injection Market features several prominent players vying for market leadership. Companies such as DSM Nutritional Products and BASF SE dominate through large-scale production and vertically integrated supply chains. Some regional firms like Northeast Pharmaceutical Group and Shandong Luwei Pharmaceutical Co., Ltd. support growth by serving local markets with cost-efficient manufacturing. It sees strategic moves including mergers, acquisitions and partnerships focused on enhancing formulation technology and global reach. Key players compete by improving stability of injectable formulations, extending shelf life and optimizing logistics. Regulatory compliance and manufacturing quality remain crucial differentiators. Leading companies invest in R&D to introduce sustained-release and modified formats to capture higher margins. Business models increasingly emphasize collaborations with healthcare providers and distributors to widen access.

Recent Developments:

  • In June 2025, Vytanutra launched Vytanutra C, a sustained-release Vitamin C plus Iron supplement designed for all-day immune support, addressing the increasing demand for continuous nutrient delivery.
  • In June 2025, Amway India introduced Nutrilite Triple Protect, a plant-based supplement providing 100% of the recommended daily allowance of Vitamin C along with additional benefits for gut and skin health.

Shape Your Report to Specific Countries or Regions & Enjoy 30% Off!

Report Coverage:

The research report offers an in-depth analysis based on Product Type, Application and End User. It details leading market players, providing an overview of their business, product offerings, investments, revenue streams, and key applications. Additionally, the report includes insights into the competitive environment, SWOT analysis, current market trends, as well as the primary drivers and constraints. Furthermore, it discusses various factors that have driven market expansion in recent years. The report also explores market dynamics, regulatory scenarios, and technological advancements that are shaping the industry. It assesses the impact of external factors and global economic changes on market growth. Lastly, it provides strategic recommendations for new entrants and established companies to navigate the complexities of the market.

Future Outlook:

  • Rising focus on preventive health and nutritional therapy will continue to boost injectable vitamin adoption across hospitals and wellness centers.
  • Expanding applications of high-dose vitamin C in oncology and metabolic care will strengthen clinical relevance.
  • Increasing R&D on stabilized and sustained-release formulations will improve product quality and storage life.
  • Growing integration of intravenous therapy in aesthetic and wellness programs will widen consumer reach.
  • Strategic collaborations between pharmaceutical companies and infusion clinics will enhance supply consistency.
  • Emerging economies will experience faster growth supported by healthcare modernization and rising disposable income.
  • Digital healthcare platforms offering at-home infusion services will expand patient accessibility and brand loyalty.
  • Sustainability initiatives in packaging and eco-friendly manufacturing will gain industry-wide importance.
  • Regional manufacturers will invest in localized production to reduce import dependency and logistics costs.
  • Regulatory harmonization and quality standard improvements will support long-term stability of the Global Vitamin C Injection Market.

CHAPTER NO. 1 : INTRODUCTION 26

1.1.1. Report Description 26

Purpose of the Report 26

USP & Key Offerings 26

1.1.2. Key Benefits for Stakeholders 26

1.1.3. Target Audience 27

1.1.4. Report Scope 27

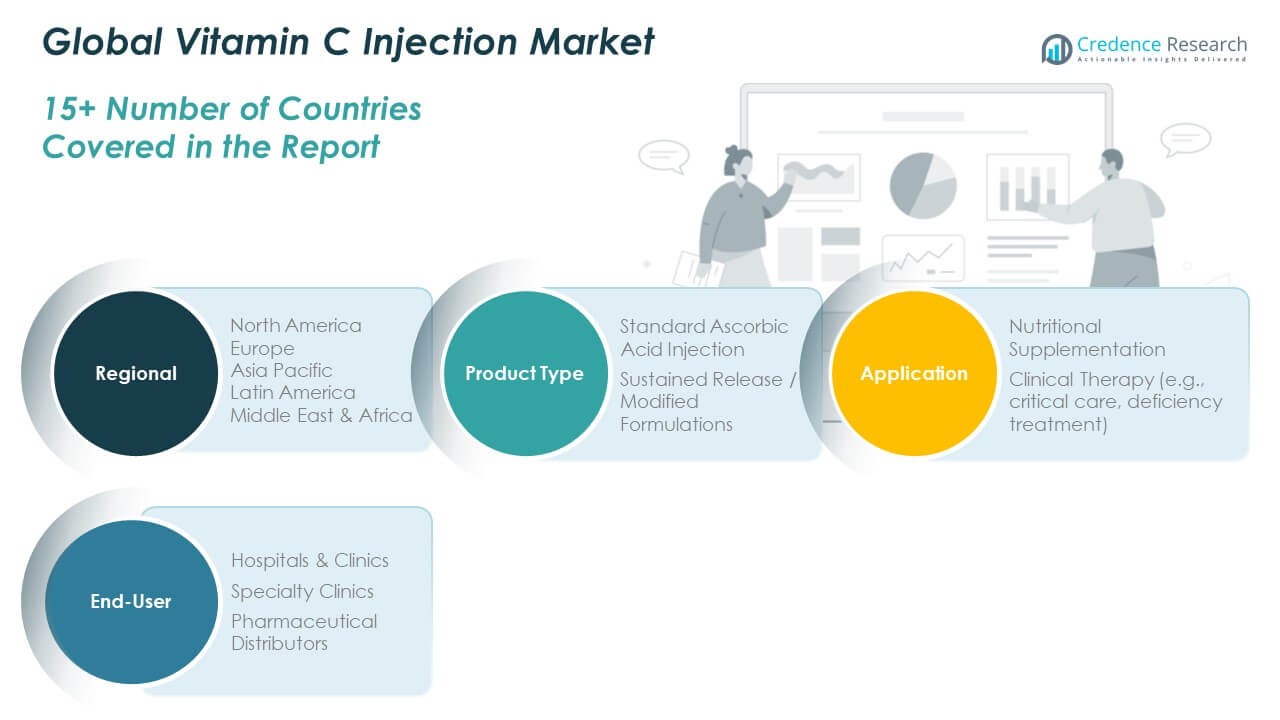
1.1.5. Regional Scope 28

CHAPTER NO. 2 : EXECUTIVE SUMMARY 29

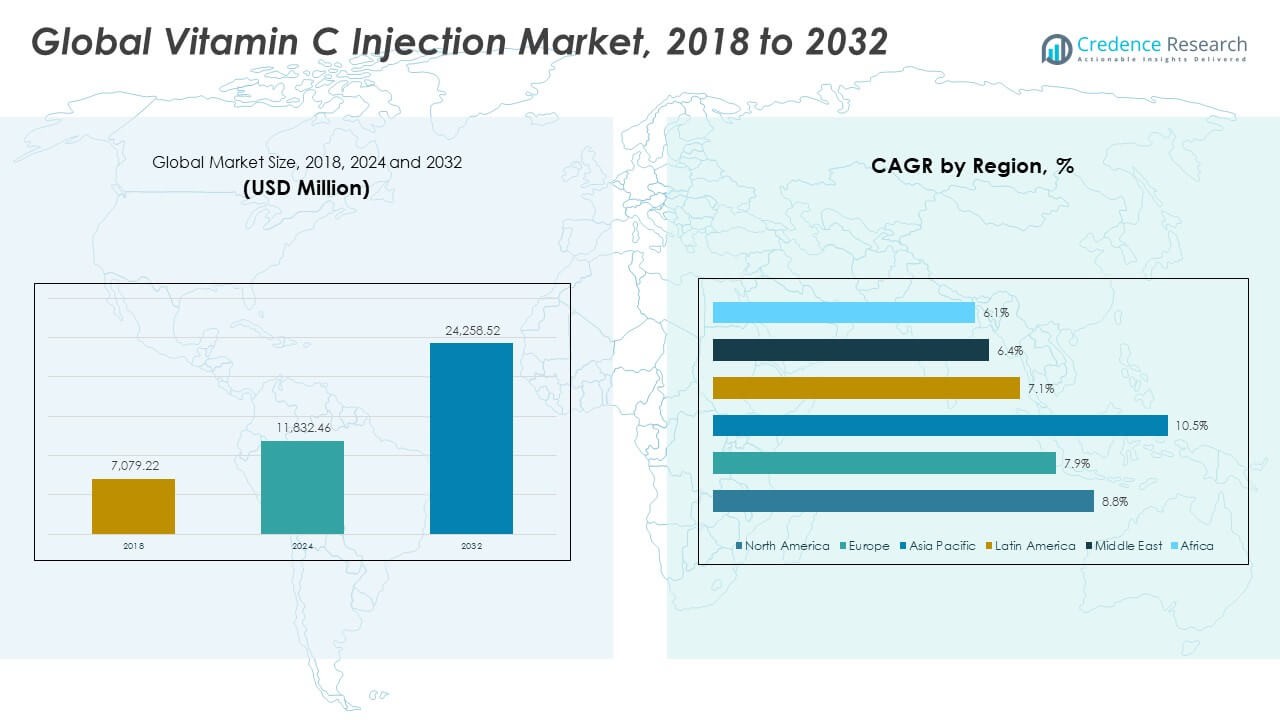
2.1. Vitamin C Injection Market Snapshot 29

2.1.1. Global Vitamin C Injection Market, 2020 – 2033 (Million Units) (USD Million) 30

2.2. Insights from Primary Respondents 30

CHAPTER NO. 3 : VITAMIN C INJECTION MARKET – INDUSTRY ANALYSIS 31

3.1. Introduction 31

3.2. Market Drivers 32

3.2.1. Growing Demand for Immune-Boosting Therapies 32

3.2.2. Increasing Adoption of IV Nutrition and Wellness Treatments 33

3.3. Market Restraints 34

3.3.1. Strict Regulatory Requirements for Injectable Products 34

3.4. Market Opportunities 35

3.4.1. Market Opportunity Analysis 35

3.5. Porter’s Five Forces Analysis 36

3.6. Value Chain Analysis 37

3.7. Buying Criteria 38

CHAPTER NO. 4 : PRICE ANALYSIS 39

4.1. Price Analysis by Region 39

4.1.1. Global Vitamin C Injection Market Price, By Region, 2020 – 2025 39

4.1.2. Global Product Type Market Price, By Region, 2020 – 2025 39

4.2. Price Analysis by Product Type 40

4.2.1. Global Vitamin C Injection Market Price, By Product Type, 2020 – 2025 40

4.2.2. Global Product Type Market Price, By Product Type, 2020 – 2025 40

CHAPTER NO. 5 : ANALYSIS COMPETITIVE LANDSCAPE 41

5.1. Company Market Share Analysis – 2024 41

5.1.1. Global Vitamin C Injection Market: Company Market Share, by Volume, 2024 41

5.1.2. Global Vitamin C Injection Market: Company Market Share, by Revenue, 2024 42

5.1.3. Global Vitamin C Injection Market: Top 6 Company Market Share, by Revenue, 2024 43

5.1.4. Global Vitamin C Injection Market: Top 3 Company Market Share, by Revenue, 2024 43

5.2. Global Vitamin C Injection Market Company Volume Market Share, 2023 44

5.3. Global Vitamin C Injection Market Company Revenue Market Share, 2023 45

5.4. Company Assessment Metrics, 2024 46

5.4.1. Stars 46

5.4.2. Emerging Leaders 46

5.4.3. Pervasive Players 46

5.4.4. Participants 46

5.5. Start-ups /SMEs Assessment Metrics, 2024 46

5.5.1. Progressive Companies 46

5.5.2. Responsive Companies 46

5.5.3. Dynamic Companies 46

5.5.4. Starting Blocks 46

5.6. Strategic Developments 47

5.6.1. Acquisitions & Mergers 47

5.6.2. New Product Launch 47

5.6.3. Regional Expansion 47

5.7. Key Players Product Matrix 48

CHAPTER NO. 6 : PESTEL & ADJACENT MARKET ANALYSIS 49

6.1. PESTEL 49

6.1.1. Political Factors 49

6.1.2. Economic Factors 49

6.1.3. Social Factors 49

6.1.4. Technological Factors 49

6.1.5. Environmental Factors 49

6.1.6. Legal Factors 49

6.2. Adjacent Market Analysis 49

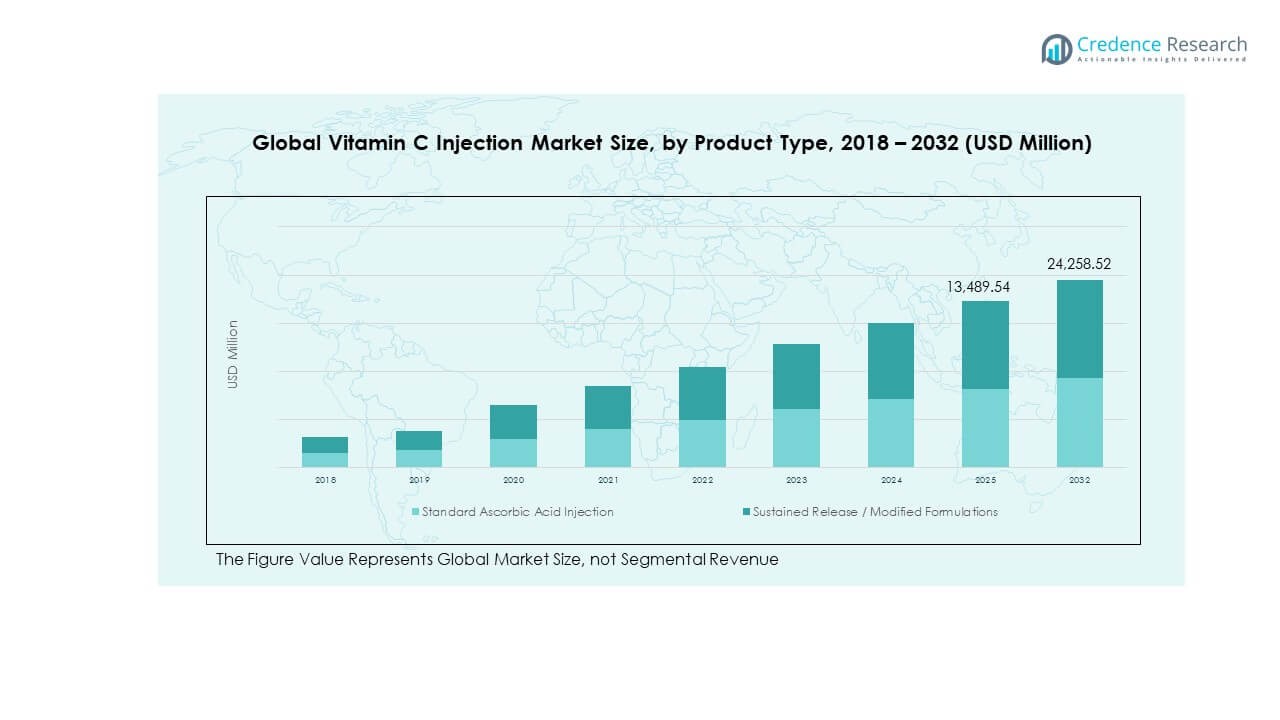
CHAPTER NO. 7 : VITAMIN C INJECTION MARKET – BY PRODUCT TYPE SEGMENT ANALYSIS 50

7.1. Vitamin C Injection Market Overview, by Product Type Segment 50

7.1.1. Vitamin C Injection Market Volume Share, By Product Type, 2024 & 2033 51

7.1.2. Vitamin C Injection Market Revenue Share, By Product Type, 2024 & 2033 51

7.1.3. Vitamin C Injection Market Attractiveness Analysis, By Product Type 52

7.1.4. Incremental Revenue Growth Opportunity, by Product Type, 2026 – 2033 53

7.1.5. Vitamin C Injection Market Revenue, By Product Type, 2020, 2024, 2029 & 2033 54

7.2. Standard Ascorbic Acid Injection 55

7.3. Sustained Release / Modified Formulations 56

CHAPTER NO. 8 : VITAMIN C INJECTION MARKET – BY APPLICATION SEGMENT ANALYSIS 57

8.1. Vitamin C Injection Market Overview, by Application Segment 57

8.1.1. Vitamin C Injection Market Volume Share, By Application, 2024 & 2033 58

8.1.2. Vitamin C Injection Market Revenue Share, By Application, 2024 & 2033 58

8.1.3. Vitamin C Injection Market Attractiveness Analysis, By Application 59

8.1.4. Incremental Revenue Growth Opportunity, by Application, 2026 – 2033 60

8.1.5. Vitamin C Injection Market Revenue, By Application, 2020, 2024, 2029 & 2033 61

8.2. Nutritional Supplementation 62

8.3. Clinical Therapy (e.g., critical care, deficiency treatment) 63

CHAPTER NO. 9 : VITAMIN C INJECTION MARKET – BY END-USER SEGMENT ANALYSIS 64

9.1. Vitamin C Injection Market Overview, by End-User Segment 64

9.1.1. Vitamin C Injection Market Volume Share, By End-User, 2024 & 2033 65

9.1.2. Vitamin C Injection Market Revenue Share, By End-User, 2024 & 2033 65

9.1.3. Vitamin C Injection Market Attractiveness Analysis, By End-User 66

9.1.4. Incremental Revenue Growth Opportunity, by End-User, 2026 – 2033 67

9.1.5. Vitamin C Injection Market Revenue, By End-User, 2020, 2024, 2029 & 2033 68

9.2. Hospitals & Clinics 69

9.3. Specialty Clinics 70

9.4. Pharmaceutical Distributors 71

CHAPTER NO. 10 : VITAMIN C INJECTION MARKET – REGIONAL ANALYSIS 72

10.1. Vitamin C Injection Market Overview, by Regional Segments 72

10.2. Region 73

10.2.1. Global Vitamin C Injection Market Volume Share, By Region, 2024 & 2033 73

10.2.2. Global Vitamin C Injection Market Revenue Share, By Region, 2024 & 2033 73

10.2.3. Vitamin C Injection Market Attractiveness Analysis, By Region 74

10.2.4. Incremental Revenue Growth Opportunity, by Region, 2025 – 2033 74

10.2.5. Vitamin C Injection Market Revenue, By Region, 2020, 2024, 2029 & 2033 75

CHAPTER NO. 11 : VITAMIN C INJECTION MARKET – NORTH AMERICA 76

11.1. North America 76

11.1.1. Key Highlights 76

11.1.2. North America Vitamin C Injection Market Volume, By Country, 2020 – 2033 (Million Units) 77

11.1.3. North America Vitamin C Injection Market Revenue, By Country, 2020 – 2025 (USD Million) 78

11.1.4. North America Vitamin C Injection Market Volume, By Product Type, 2020 – 2025 (Million Units) 79

11.1.5. North America Vitamin C Injection Market Revenue, By Product Type, 2020 – 2025 (USD Million) 80

11.1.6. North America Vitamin C Injection Market Volume, By Application, 2020 – 2025 (Million Units) 81

11.1.7. North America Vitamin C Injection Market Revenue, By Application, 2020 – 2025 (USD Million) 82

11.1.8. North America Vitamin C Injection Market Volume, By End-User, 2020 – 2025 (Million Units) 83

11.1.9. North America Vitamin C Injection Market Revenue, By End-User, 2020 – 2025 (USD Million) 84

11.2. U.S. 85

11.3. Canada 85

11.4. Mexico 85

CHAPTER NO. 12 : VITAMIN C INJECTION MARKET – EUROPE 86

12.1. Europe 86

12.1.1. Key Highlights 86

12.1.2. Europe Vitamin C Injection Market Volume, By Country, 2020 – 2033 (Million Units) 87

12.1.3. Europe Vitamin C Injection Market Revenue, By Country, 2020 – 2025 (USD Million) 89

12.1.4. Europe Vitamin C Injection Market Volume, By Product Type, 2020 – 2025 (Million Units) 91

12.1.5. Europe Vitamin C Injection Market Revenue, By Product Type, 2020 – 2025 (USD Million) 92

12.1.6. Europe Vitamin C Injection Market Volume, By Application, 2020 – 2025 (Million Units) 93

12.1.7. Europe Vitamin C Injection Market Revenue, By Application, 2020 – 2025 (USD Million) 94

12.1.8. Europe Vitamin C Injection Market Volume, By End-User, 2020 – 2025 (Million Units) 95

12.1.9. Europe Vitamin C Injection Market Revenue, By End-User, 2020 – 2025 (USD Million) 96

12.2. UK 97

12.3. France 97

12.4. Germany 97

12.5. Italy 97

12.6. Spain 97

12.7. Russia 97

12.8. Belgium 97

12.9. Netherland 97

12.10. Austria 97

12.11. Sweden 97

12.12. Poland 97

12.13. Denmark 97

12.14. Switzerland 97

12.15. Rest of Europe 97

CHAPTER NO. 13 : VITAMIN C INJECTION MARKET – ASIA PACIFIC 98

13.1. Asia Pacific 98

13.1.1. Key Highlights 98

13.1.2. Asia Pacific Vitamin C Injection Market Volume, By Country, 2020 – 2033 (Million Units) 99

13.1.3. Asia Pacific Vitamin C Injection Market Revenue, By Country, 2020 – 2025 (USD Million) 101

13.1.4. Asia Pacific Vitamin C Injection Market Volume, By Product Type, 2020 – 2025 (Million Units) 103

13.1.5. Asia Pacific Vitamin C Injection Market Revenue, By Product Type, 2020 – 2025 (USD Million) 104

13.1.6. Asia Pacific Vitamin C Injection Market Volume, By Application, 2020 – 2025 (Million Units) 105

13.1.7. Asia Pacific Vitamin C Injection Market Revenue, By Application, 2020 – 2025 (USD Million) 106

13.1.8. Asia Pacific Vitamin C Injection Market Volume, By End-User, 2020 – 2025 (Million Units) 107

13.1.9. Asia Pacific Vitamin C Injection Market Revenue, By End-User, 2020 – 2025 (USD Million) 108

13.2. China 109

13.3. Japan 109

13.4. South Korea 109

13.5. India 109

13.6. Australia 109

13.7. Thailand 109

13.8. Indonesia 109

13.9. Vietnam 109

13.10. Malaysia 109

13.11. Philippines 109

13.12. Taiwan 109

13.13. Rest of Asia Pacific 109

CHAPTER NO. 14 : VITAMIN C INJECTION MARKET – LATIN AMERICA 110

14.1. Latin America 110

14.1.1. Key Highlights 110

14.1.2. Latin America Vitamin C Injection Market Volume, By Country, 2020 – 2033 (Million Units) 111

14.1.3. Latin America Vitamin C Injection Market Revenue, By Country, 2020 – 2025 (USD Million) 112

14.1.4. Latin America Vitamin C Injection Market Volume, By Product Type, 2020 – 2025 (Million Units) 113

14.1.5. Latin America Vitamin C Injection Market Revenue, By Product Type, 2020 – 2025 (USD Million) 114

14.1.6. Latin America Vitamin C Injection Market Volume, By Application, 2020 – 2025 (Million Units) 115

14.1.7. Latin America Vitamin C Injection Market Revenue, By Application, 2020 – 2025 (USD Million) 116

14.1.8. Latin America Vitamin C Injection Market Volume, By End-User, 2020 – 2025 (Million Units) 117

14.1.9. Latin America Vitamin C Injection Market Revenue, By End-User, 2020 – 2025 (USD Million) 118

14.2. Brazil 119

14.3. Argentina 119

14.4. Peru 119

14.5. Chile 119

14.6. Colombia 119

14.7. Rest of Latin America 119

CHAPTER NO. 15 : VITAMIN C INJECTION MARKET – MIDDLE EAST 120

15.1. Middle East 120

15.1.1. Key Highlights 120

15.1.2. Middle East Vitamin C Injection Market Volume, By Country, 2020 – 2033 (Million Units) 121

15.1.3. Middle East Vitamin C Injection Market Revenue, By Country, 2020 – 2025 (USD Million) 122

15.1.4. Middle East Vitamin C Injection Market Volume, By Product Type, 2020 – 2025 (Million Units) 123

15.1.5. Middle East Vitamin C Injection Market Revenue, By Product Type, 2020 – 2025 (USD Million) 124

15.1.6. Middle East Vitamin C Injection Market Volume, By Application, 2020 – 2025 (Million Units) 125

15.1.7. Middle East Vitamin C Injection Market Revenue, By Application, 2020 – 2025 (USD Million) 126

15.1.8. Middle East Vitamin C Injection Market Volume, By End-User, 2020 – 2025 (Million Units) 127

15.1.9. Middle East Vitamin C Injection Market Revenue, By End-User, 2020 – 2025 (USD Million) 128

15.2. UAE 129

15.3. KSA 129

15.4. Israel 129

15.5. Turkey 129

15.6. Iran 129

15.7. Rest of Middle East 129

CHAPTER NO. 16 : VITAMIN C INJECTION MARKET – AFRICA 130

16.1. Africa 130

16.1.1. Key Highlights 130

16.1.2. Africa Vitamin C Injection Market Volume, By Country, 2020 – 2033 (Million Units) 131

16.1.3. Africa Vitamin C Injection Market Revenue, By Country, 2020 – 2025 (USD Million) 132

16.1.4. Africa Vitamin C Injection Market Volume, By Product Type, 2020 – 2025 (Million Units) 133

16.1.5. Africa Vitamin C Injection Market Revenue, By Product Type, 2020 – 2025 (USD Million) 134

16.1.6. Africa Vitamin C Injection Market Volume, By Application, 2020 – 2025 (Million Units) 135

16.1.7. Africa Vitamin C Injection Market Revenue, By Application, 2020 – 2025 (USD Million) 136

16.1.8. Africa Vitamin C Injection Market Volume, By End-User, 2020 – 2025 (Million Units) 137

16.1.9. Africa Vitamin C Injection Market Revenue, By End-User, 2020 – 2025 (USD Million) 138

16.2. Egypt 139

16.3. Nigeria 139

16.4. Algeria 139

16.5. Morocco 139

16.6. Rest of Africa 139

CHAPTER NO. 17 : COMPANY PROFILES 140

17.1. BASF SE 140

17.1.1. Company Overview 140

17.1.2. Product Portfolio 140

17.1.3. Financial Overview 140

17.2. DSM Nutritional Products 140

17.3. Coca-Cola HBC (Pharma Division) 141

17.4. Cargill, Inc. 141

17.5. Mylan Pharmaceuticals 141

17.6. Company 6 141

17.7. Company 7 141

17.8. Company 8 141

17.9. Company 9 141

17.10. Company 10 141

17.11. Company 11 141

17.12. Company 12 141

17.13. Company 13 141

17.14. Company 14 141

List of Figures

FIG NO. 1. Global Vitamin C Injection Market Volume & Revenue, 2020 – 2033 (Million Units) (USD Million) 30

FIG NO. 2. Porter’s Five Forces Analysis for Global Vitamin C Injection Market 36

FIG NO. 3. Value Chain Analysis for Global Vitamin C Injection Market 37

FIG NO. 4. Global Vitamin C Injection Market Price, By Region, 2020 – 2025 39

FIG NO. 5. Global Vitamin C Injection Market Price, By Product Type, 2020 – 2025 40

FIG NO. 6. Company Share Analysis, 2024 41

FIG NO. 7. Company Share Analysis, 2024 42

FIG NO. 8. Company Share Analysis, 2024 43

FIG NO. 9. Company Share Analysis, 2024 43

FIG NO. 10. Vitamin C Injection Market – Company Volume Market Share, 2023 44

FIG NO. 11. Vitamin C Injection Market – Company Revenue Market Share, 2023 45

FIG NO. 12. Vitamin C Injection Market Volume Share, By Product Type, 2024 & 2033 51

FIG NO. 13. Vitamin C Injection Market Revenue Share, By Product Type, 2024 & 2033 51

FIG NO. 14. Market Attractiveness Analysis, By Product Type 52

FIG NO. 15. Incremental Revenue Growth Opportunity by Product Type, 2026 – 2033 53

FIG NO. 16. Vitamin C Injection Market Revenue, By Product Type, 2020, 2024, 2029 & 2033 54

FIG NO. 17. Global Vitamin C Injection Market for Standard Ascorbic Acid Injection, Volume & Revenue (Million Units) (USD Million) 2020 – 2033 55

FIG NO. 18. Global Vitamin C Injection Market for Sustained Release / Modified Formulations, Volume & Revenue (Million Units) (USD Million) 2020 – 2033 56

FIG NO. 19. Vitamin C Injection Market Volume Share, By Application, 2024 & 2033 58

FIG NO. 20. Vitamin C Injection Market Revenue Share, By Application, 2024 & 2033 58

FIG NO. 21. Market Attractiveness Analysis, By Application 59

FIG NO. 22. Incremental Revenue Growth Opportunity by Application, 2026 – 2033 60

FIG NO. 23. Vitamin C Injection Market Revenue, By Application, 2020, 2024, 2029 & 2033 61

FIG NO. 24. Global Vitamin C Injection Market for Nutritional Supplementation, Volume & Revenue (Million Units) (USD Million) 2020 – 2033 62

FIG NO. 25. Global Vitamin C Injection Market for Clinical Therapy (e.g., critical care, deficiency treatment), Volume & Revenue (Million Units) (USD Million) 2020 – 2033 63

FIG NO. 26. Vitamin C Injection Market Volume Share, By End-User, 2024 & 2033 65

FIG NO. 27. Vitamin C Injection Market Revenue Share, By End-User, 2024 & 2033 65

FIG NO. 28. Market Attractiveness Analysis, By End-User 66

FIG NO. 29. Incremental Revenue Growth Opportunity by End-User, 2026 – 2033 67

FIG NO. 30. Vitamin C Injection Market Revenue, By End-User, 2020, 2024, 2029 & 2033 68

FIG NO. 31. Global Vitamin C Injection Market for Hospitals & Clinics, Volume & Revenue (Million Units) (USD Million) 2020 – 2033 69

FIG NO. 32. Global Vitamin C Injection Market for Specialty Clinics, Volume & Revenue (Million Units) (USD Million) 2020 – 2033 70

FIG NO. 33. Global Vitamin C Injection Market for Pharmaceutical Distributors, Volume & Revenue (Million Units) (USD Million) 2020 – 2033 71

FIG NO. 34. Global Vitamin C Injection Market Volume Share, By Region, 2024 & 2033 73

FIG NO. 35. Global Vitamin C Injection Market Revenue Share, By Region, 2024 & 2033 73

FIG NO. 36. Market Attractiveness Analysis, By Region 74

FIG NO. 37. Incremental Revenue Growth Opportunity by Region, 2025 – 2033 74

FIG NO. 38. Vitamin C Injection Market Revenue, By Region, 2020, 2024, 2029 & 2033 75

FIG NO. 39. North America Vitamin C Injection Market Volume & Revenue, 2020 – 2033 (Million Units) (USD Million) 76

FIG NO. 40. Europe Vitamin C Injection Market Volume & Revenue, 2020 – 2033 (Million Units) (USD Million) 86

FIG NO. 41. Asia Pacific Vitamin C Injection Market Volume & Revenue, 2020 – 2033 (Million Units) (USD Million) 98

FIG NO. 42. Latin America Vitamin C Injection Market Volume & Revenue, 2020 – 2033 (Million Units) (USD Million) 110

FIG NO. 43. Middle East Vitamin C Injection Market Volume & Revenue, 2020 – 2033 (Million Units) (USD Million) 120

FIG NO. 44. Africa Vitamin C Injection Market Volume & Revenue, 2020 – 2033 (Million Units) (USD Million) 130

List of Tables

TABLE NO. 1. : Global Vitamin C Injection Market: Snapshot 29

TABLE NO. 2. : Drivers for the Vitamin C Injection Market: Impact Analysis 32

TABLE NO. 3. : Restraints for the Vitamin C Injection Market: Impact Analysis 34

TABLE NO. 4. : Global Vitamin C Injection Market Volume & Revenue, By Region, 2020 – 2025 39

TABLE NO. 5. : Global Vitamin C Injection Market Volume & Revenue, By Product Type, 2020 – 2025 40

TABLE NO. 6. : North America Vitamin C Injection Market Volume, By Country, 2020 – 2025 (Million Units) 77

TABLE NO. 7. : North America Vitamin C Injection Market Volume, By Country, 2026 – 2033 (Million Units) 77

TABLE NO. 8. : North America Vitamin C Injection Market Revenue, By Country, 2020 – 2025 (USD Million) 78

TABLE NO. 9. : North America Vitamin C Injection Market Revenue, By Country, 2026 – 2033 (USD Million) 78

TABLE NO. 10. : North America Vitamin C Injection Market Volume, By Product Type, 2020 – 2025 (Million Units) 79

TABLE NO. 11. : North America Vitamin C Injection Market Volume, By Product Type, 2026 – 2033 (Million Units) 79

TABLE NO. 12. : North America Vitamin C Injection Market Revenue, By Product Type, 2020 – 2025 (USD Million) 80

TABLE NO. 13. : North America Vitamin C Injection Market Revenue, By Product Type, 2026 – 2033 (USD Million) 80

TABLE NO. 14. : North America Vitamin C Injection Market Volume, By Application, 2020 – 2025 (Million Units) 81

TABLE NO. 15. : North America Vitamin C Injection Market Volume, By Application, 2026 – 2033 (Million Units) 81

TABLE NO. 16. : North America Vitamin C Injection Market Revenue, By Application, 2020 – 2025 (USD Million) 82

TABLE NO. 17. : North America Vitamin C Injection Market Revenue, By Application, 2026 – 2033 (USD Million) 82

TABLE NO. 18. : North America Vitamin C Injection Market Volume, By End-User, 2020 – 2025 (Million Units) 83

TABLE NO. 19. : North America Vitamin C Injection Market Volume, By End-User, 2026 – 2033 (Million Units) 83

TABLE NO. 20. : North America Vitamin C Injection Market Revenue, By End-User, 2020 – 2025 (USD Million) 84

TABLE NO. 21. : North America Vitamin C Injection Market Revenue, By End-User, 2026 – 2033 (USD Million) 84

TABLE NO. 22. : Europe Vitamin C Injection Market Volume, By Country, 2020 – 2025 (Million Units) 87

TABLE NO. 23. : Europe Vitamin C Injection Market Volume, By Country, 2026 – 2033 (Million Units) 88

TABLE NO. 24. : Europe Vitamin C Injection Market Revenue, By Country, 2020 – 2025 (USD Million) 89

TABLE NO. 25. : Europe Vitamin C Injection Market Revenue, By Country, 2026 – 2033 (USD Million) 90

TABLE NO. 26. : Europe Vitamin C Injection Market Volume, By Product Type, 2020 – 2025 (Million Units) 91

TABLE NO. 27. : Europe Vitamin C Injection Market Volume, By Product Type, 2026 – 2033 (Million Units) 91

TABLE NO. 28. : Europe Vitamin C Injection Market Revenue, By Product Type, 2020 – 2025 (USD Million) 92

TABLE NO. 29. : Europe Vitamin C Injection Market Revenue, By Product Type, 2026 – 2033 (USD Million) 92

TABLE NO. 30. : Europe Vitamin C Injection Market Volume, By Application, 2020 – 2025 (Million Units) 93

TABLE NO. 31. : Europe Vitamin C Injection Market Volume, By Application, 2026 – 2033 (Million Units) 93

TABLE NO. 32. : Europe Vitamin C Injection Market Revenue, By Application, 2020 – 2025 (USD Million) 94

TABLE NO. 33. : Europe Vitamin C Injection Market Revenue, By Application, 2026 – 2033 (USD Million) 94

TABLE NO. 34. : Europe Vitamin C Injection Market Volume, By End-User, 2020 – 2025 (Million Units) 95

TABLE NO. 35. : Europe Vitamin C Injection Market Volume, By End-User, 2026 – 2033 (Million Units) 95

TABLE NO. 36. : Europe Vitamin C Injection Market Revenue, By End-User, 2020 – 2025 (USD Million) 96

TABLE NO. 37. : Europe Vitamin C Injection Market Revenue, By End-User, 2026 – 2033 (USD Million) 96

TABLE NO. 38. : Asia Pacific Vitamin C Injection Market Volume, By Country, 2020 – 2025 (Million Units) 99

TABLE NO. 39. : Asia Pacific Vitamin C Injection Market Volume, By Country, 2026 – 2033 (Million Units) 100

TABLE NO. 40. : Asia Pacific Vitamin C Injection Market Revenue, By Country, 2020 – 2025 (USD Million) 101

TABLE NO. 41. : Asia Pacific Vitamin C Injection Market Revenue, By Country, 2026 – 2033 (USD Million) 102

TABLE NO. 42. : Asia Pacific Vitamin C Injection Market Volume, By Product Type, 2020 – 2025 (Million Units) 103

TABLE NO. 43. : Asia Pacific Vitamin C Injection Market Volume, By Product Type, 2026 – 2033 (Million Units) 103

TABLE NO. 44. : Asia Pacific Vitamin C Injection Market Revenue, By Product Type, 2020 – 2025 (USD Million) 104

TABLE NO. 45. : Asia Pacific Vitamin C Injection Market Revenue, By Product Type, 2026 – 2033 (USD Million) 104

TABLE NO. 46. : Asia Pacific Vitamin C Injection Market Volume, By Application, 2020 – 2025 (Million Units) 105

TABLE NO. 47. : Asia Pacific Vitamin C Injection Market Volume, By Application, 2026 – 2033 (Million Units) 105

TABLE NO. 48. : Asia Pacific Vitamin C Injection Market Revenue, By Application, 2020 – 2025 (USD Million) 106

TABLE NO. 49. : Asia Pacific Vitamin C Injection Market Revenue, By Application, 2026 – 2033 (USD Million) 106

TABLE NO. 50. : Asia Pacific Vitamin C Injection Market Volume, By End-User, 2020 – 2025 (Million Units) 107

TABLE NO. 51. : Asia Pacific Vitamin C Injection Market Volume, By End-User, 2026 – 2033 (Million Units) 107

TABLE NO. 52. : Asia Pacific Vitamin C Injection Market Revenue, By End-User, 2020 – 2025 (USD Million) 108

TABLE NO. 53. : Asia Pacific Vitamin C Injection Market Revenue, By End-User, 2026 – 2033 (USD Million) 108

TABLE NO. 54. : Latin America Vitamin C Injection Market Volume, By Country, 2020 – 2025 (Million Units) 111

TABLE NO. 55. : Latin America Vitamin C Injection Market Volume, By Country, 2026 – 2033 (Million Units) 111

TABLE NO. 56. : Latin America Vitamin C Injection Market Revenue, By Country, 2020 – 2025 (USD Million) 112

TABLE NO. 57. : Latin America Vitamin C Injection Market Revenue, By Country, 2026 – 2033 (USD Million) 112

TABLE NO. 58. : Latin America Vitamin C Injection Market Volume, By Product Type, 2020 – 2025 (Million Units) 113

TABLE NO. 59. : Latin America Vitamin C Injection Market Volume, By Product Type, 2026 – 2033 (Million Units) 113

TABLE NO. 60. : Latin America Vitamin C Injection Market Revenue, By Product Type, 2020 – 2025 (USD Million) 114

TABLE NO. 61. : Latin America Vitamin C Injection Market Revenue, By Product Type, 2026 – 2033 (USD Million) 114

TABLE NO. 62. : Latin America Vitamin C Injection Market Volume, By Application, 2020 – 2025 (Million Units) 115

TABLE NO. 63. : Latin America Vitamin C Injection Market Volume, By Application, 2026 – 2033 (Million Units) 115

TABLE NO. 64. : Latin America Vitamin C Injection Market Revenue, By Application, 2020 – 2025 (USD Million) 116

TABLE NO. 65. : Latin America Vitamin C Injection Market Revenue, By Application, 2026 – 2033 (USD Million) 116

TABLE NO. 66. : Latin America Vitamin C Injection Market Volume, By End-User, 2020 – 2025 (Million Units) 117

TABLE NO. 67. : Latin America Vitamin C Injection Market Volume, By End-User, 2026 – 2033 (Million Units) 117

TABLE NO. 68. : Latin America Vitamin C Injection Market Revenue, By End-User, 2020 – 2025 (USD Million) 118

TABLE NO. 69. : Latin America Vitamin C Injection Market Revenue, By End-User, 2026 – 2033 (USD Million) 118

TABLE NO. 70. : Middle East Vitamin C Injection Market Volume, By Country, 2020 – 2025 (Million Units) 121

TABLE NO. 71. : Middle East Vitamin C Injection Market Volume, By Country, 2026 – 2033 (Million Units) 121

TABLE NO. 72. : Middle East Vitamin C Injection Market Revenue, By Country, 2020 – 2025 (USD Million) 122

TABLE NO. 73. : Middle East Vitamin C Injection Market Revenue, By Country, 2026 – 2033 (USD Million) 122

TABLE NO. 74. : Middle East Vitamin C Injection Market Volume, By Product Type, 2020 – 2025 (Million Units) 123

TABLE NO. 75. : Middle East Vitamin C Injection Market Volume, By Product Type, 2026 – 2033 (Million Units) 123

TABLE NO. 76. : Middle East Vitamin C Injection Market Revenue, By Product Type, 2020 – 2025 (USD Million) 124

TABLE NO. 77. : Middle East Vitamin C Injection Market Revenue, By Product Type, 2026 – 2033 (USD Million) 124

TABLE NO. 78. : Middle East Vitamin C Injection Market Volume, By Application, 2020 – 2025 (Million Units) 125

TABLE NO. 79. : Middle East Vitamin C Injection Market Volume, By Application, 2026 – 2033 (Million Units) 125

TABLE NO. 80. : Middle East Vitamin C Injection Market Revenue, By Application, 2020 – 2025 (USD Million) 126

TABLE NO. 81. : Middle East Vitamin C Injection Market Revenue, By Application, 2026 – 2033 (USD Million) 126

TABLE NO. 82. : Middle East Vitamin C Injection Market Volume, By End-User, 2020 – 2025 (Million Units) 127

TABLE NO. 83. : Middle East Vitamin C Injection Market Volume, By End-User, 2026 – 2033 (Million Units) 127

TABLE NO. 84. : Middle East Vitamin C Injection Market Revenue, By End-User, 2020 – 2025 (USD Million) 128

TABLE NO. 85. : Middle East Vitamin C Injection Market Revenue, By End-User, 2026 – 2033 (USD Million) 128

TABLE NO. 86. : Africa Vitamin C Injection Market Volume, By Country, 2020 – 2025 (Million Units) 131

TABLE NO. 87. : Africa Vitamin C Injection Market Volume, By Country, 2026 – 2033 (Million Units) 131

TABLE NO. 88. : Africa Vitamin C Injection Market Revenue, By Country, 2020 – 2025 (USD Million) 132

TABLE NO. 89. : Africa Vitamin C Injection Market Revenue, By Country, 2026 – 2033 (USD Million) 132

TABLE NO. 90. : Africa Vitamin C Injection Market Volume, By Product Type, 2020 – 2025 (Million Units) 133

TABLE NO. 91. : Africa Vitamin C Injection Market Volume, By Product Type, 2026 – 2033 (Million Units) 133

TABLE NO. 92. : Africa Vitamin C Injection Market Revenue, By Product Type, 2020 – 2025 (USD Million) 134

TABLE NO. 93. : Africa Vitamin C Injection Market Revenue, By Product Type, 2026 – 2033 (USD Million) 134

TABLE NO. 94. : Africa Vitamin C Injection Market Volume, By Application, 2020 – 2025 (Million Units) 135

TABLE NO. 95. : Africa Vitamin C Injection Market Volume, By Application, 2026 – 2033 (Million Units) 135

TABLE NO. 96. : Africa Vitamin C Injection Market Revenue, By Application, 2020 – 2025 (USD Million) 136

TABLE NO. 97. : Africa Vitamin C Injection Market Revenue, By Application, 2026 – 2033 (USD Million) 136

TABLE NO. 98. : Africa Vitamin C Injection Market Volume, By End-User, 2020 – 2025 (Million Units) 137

TABLE NO. 99. : Africa Vitamin C Injection Market Volume, By End-User, 2026 – 2033 (Million Units) 137

TABLE NO. 100. : Africa Vitamin C Injection Market Revenue, By End-User, 2020 – 2025 (USD Million) 138

TABLE NO. 101. : Africa Vitamin C Injection Market Revenue, By End-User, 2026 – 2033 (USD Million) 138

Request Free Sample

We prioritize the confidentiality and security of your data. Our promise: your information remains private.

Ready to Transform Data into Decisions?

Request Your Sample Report and Start Your Journey of Informed Choices


Providing the strategic compass for industry titans.

cr-clients-logos

Frequently Asked Questions:

What is the current market size for the Global Vitamin C Injection Market, and what is its projected size in 2032?

The Global Vitamin C Injection Market is valued at about USD 11,832.46 million in 2024 and is projected to reach around USD 24,258.52 million by 2032.

At what Compound Annual Growth Rate is the Global Vitamin C Injection Market projected to grow between 2024 and 2032?

The Global Vitamin C Injection Market is projected to expand at a CAGR of approximately 8.75% from 2024 to 2032.

Which Global Vitamin C Injection Market segment held the largest share in 2024?

In 2024, the Standard Ascorbic Acid Injection segment held the largest share of the Global Vitamin C Injection Market due to its clinical effectiveness and affordability.

What are the primary factors fueling the growth of the Global Vitamin C Injection Market?

The Global Vitamin C Injection Market is driven by rising awareness of immune health, growing clinical use in chronic conditions, and expanding wellness infusion services.

Who are the leading companies in the Global Vitamin C Injection Market?

Leading players in the Global Vitamin C Injection Market include DSM Nutritional Products, BASF SE, Cargill Inc., Mylan Pharmaceuticals, and Coca-Cola HBC (Pharma Division).

Which region commanded the largest share of the Global Vitamin C Injection Market in 2024?

North America commanded the largest share of the Global Vitamin C Injection Market in 2024, supported by advanced healthcare infrastructure and high adoption of IV therapy.

About Author

Shweta Bisht

Shweta Bisht

Healthcare & Biotech Analyst

Shweta is a healthcare and biotech researcher with strong analytical skills in chemical and agri domains.

View Profile

Related Reports

Medical Grade Sodium Hyaluronate Market

The Medical Grade Sodium Hyaluronate market was valued at USD 8.2 billion in 2024 and is anticipated to reach USD 13.56 billion by 2032, growing at a CAGR of 6.5% during the forecast period.

Subdermal Contraceptive Implants Market

The Subdermal Contraceptive Implants Market is projected to grow from USD 1,130.5 million in 2024 to an estimated USD 1,958.44 million by 2032, with a CAGR of 7.11% from 2024 to 2032.

Proximal Humeral Implants Market

The Proximal humeral implants market is projected to grow from USD 1,210.5 million in 2024 to an estimated USD 2,412 million by 2032, with a compound annual growth rate (CAGR) of 9% from 2024 to 2032.

Nootropics Market

The Global Nootropics Market size was valued at USD 1,726.83 million in 2018 to USD 3,952.16 million in 2024 and is anticipated to reach USD 10,093.52 million by 2032, at a CAGR of 11.59% during the forecast period.

Poultry Vaccines Market

Poultry Vaccines Market size was valued at USD 2.41 billion in 2024 and is anticipated to reach USD 4.17 billion by 2032, at a CAGR of 7.09% during the forecast period.

Porokeratosis Market

Porokeratosis Market size was valued USD 2.11 billion in 2024 and is anticipated to reach USD 3.35 billion by 2032, at a CAGR of 5.95% during the forecast period.

Oral Thin Film Drugs Market

Oral Thin Film Drugs market was valued at USD 3.02 billion in 2024 and is anticipated to reach USD 6.18 billion by 2032, growing at a CAGR of 9.36 % during the forecast period.</p

Mid-Revenue Cycle Management/Clinical Documentation Improvement Market

Mid Revenue Cycle Management Clinical Documentation Improvement Market size was valued USD 5.61 billion in 2024 and is anticipated to reach USD 9.43 billion by 2032, at a CAGR of 6.71% during the forecast period.

Downstream Bio-processing Controllers Market

The Downstream Bioprocessing Controllers Market is projected to grow from USD 1,210.5 million in 2024 to an estimated USD 3,945.32 million by 2032, with a compound annual growth rate (CAGR) of 15.92% from 2024 to 2032.

Clinical Trial Recruitment in Respiratory Market

Clinical Trial Recruitment in Respiratory Market size was valued USD 2.22 billion in 2024 and is anticipated to reach USD 3.6 billion by 2032, at a CAGR of 6.23% during the forecast period.

Bioanalytical Testing Services Market

Bioanalytical Testing Services Market size was valued USD 5.6 billion in 2024 and is anticipated to reach USD 11.74 billion by 2032, at a CAGR of 9.69% during the forecast period.

Solid Organ Transplant Immunosuppressants Market

The Solid Organ Transplant Immunosuppressants market size was valued at USD 6 billion in 2024 and is anticipated to reach USD 7.84 billion by 2032, growing at a CAGR of 4.5% during the forecast period.

Licence Option

The report comes as a view-only PDF document, optimized for individual clients. This version is recommended for personal digital use and does not allow printing. Use restricted to one purchaser only.
$4999

To meet the needs of modern corporate teams, our report comes in two formats: a printable PDF and a data-rich Excel sheet. This package is optimized for internal analysis. Unlimited users allowed within one corporate location (e.g., regional office).
$6999

The report will be delivered in printable PDF format along with the report’s data Excel sheet. This license offers 100 Free Analyst hours where the client can utilize Credence Research Inc. research team. Permitted for unlimited global use by all users within the purchasing corporation, such as all employees of a single company.
$12999

Report delivery within 24 to 48 hours

Credence Staff 3

WILLIAM, North America

Support Staff at Credence Research

KEITH PHILLIPS, Europe

Lee - CR Sales Staff

LEE VALLANCE, Asia Pacific

Kieran Jameson

KIERAN JAMESON, Australia

Smallform of Sample request
User Review

Thank you for the data! The numbers are exactly what we asked for and what we need to build our business case.

Materials Scientist
(privacy requested)

User Review

The report was an excellent overview of the Industrial Burners market. This report does a great job of breaking everything down into manageable chunks.

Imre Hof
Management Assistant, Bekaert

cr-clients-logos

Request Sample