Market Overview:
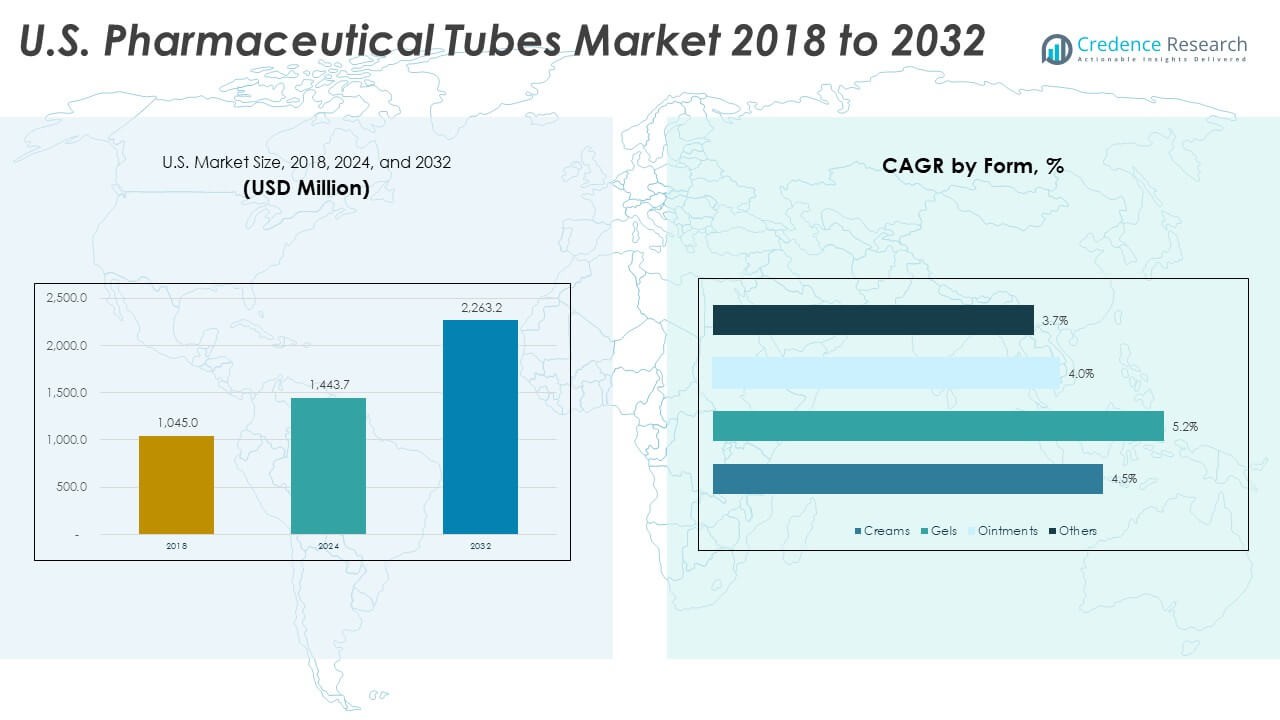
The U.S. Pharmaceutical Tubes Market size was valued at USD 1,045.00 million in 2018 to USD 1,443.70 million in 2024 and is anticipated to reach USD 2,263.20 million by 2032, at a CAGR of 5.81% during the forecast period.
| REPORT ATTRIBUTE |
DETAILS |
| Historical Period |
2020-2023 |
| Base Year |
2024 |
| Forecast Period |
2025-2032 |
| U.S. Pharmaceutical Tubes Market Size 2024 |
USD 1,443.70 Million |
| U.S. Pharmaceutical Tubes Market, CAGR |
5.81% |
| U.S. Pharmaceutical Tubes Market Size 2032 |
USD 2,263.20 Million |
Market drivers stay strong due to rising use of dermatology, oral care, and pain relief products. Pharmaceutical brands adopt laminated and aluminum tubes for higher barrier strength and tamper resistance. Growing preference for unit-dose formats boosts tube production across regulated facilities. Contract manufacturing groups scale capacity to meet rapid order cycles from leading drug developers. Growth in biologics and semi-solid formulations expands tube usage across specialized therapies. User-friendly packaging improves compliance in home-based treatments. Strong focus on waste control accelerates demand for recyclable tube formats.
Regional demand remains concentrated across key U.S. hubs that host major pharma producers and CMOs. Regions with dense manufacturing clusters lead due to stronger access to raw materials, skilled labor, and FDA-approved facilities. Emerging states grow fast due to expansions in specialty drug production and investments in new sterile packaging units. Distribution networks strengthen near coastal regions with large logistics footprints. Local demand increases across states with strong healthcare access and high prescription volumes. Consumer health brands also expand tube-based packaging across wider retail channels.
Access crucial information at unmatched prices!
Request your sample report today & start making informed decisions powered by Credence Research Inc.!
Download Sample
Market Insights:
- The U.S. Pharmaceutical Tubes Market increased from USD 1,045 million in 2018 to USD 1,443.70 million in 2024 and is projected to reach USD 2,263.20 million by 2032, growing at a 5.81% CAGR led by rising demand for high-barrier tube packaging.
- The Northeast holds the largest share at 35%, driven by dense pharmaceutical clusters; the Midwest follows with 30%, supported by strong CMO capacity; the South holds 25% due to rapid expansion of specialty drug manufacturing.
- The West grows fastest with a 10% share, supported by demand from wellness brands and adoption of sustainable tube formats.
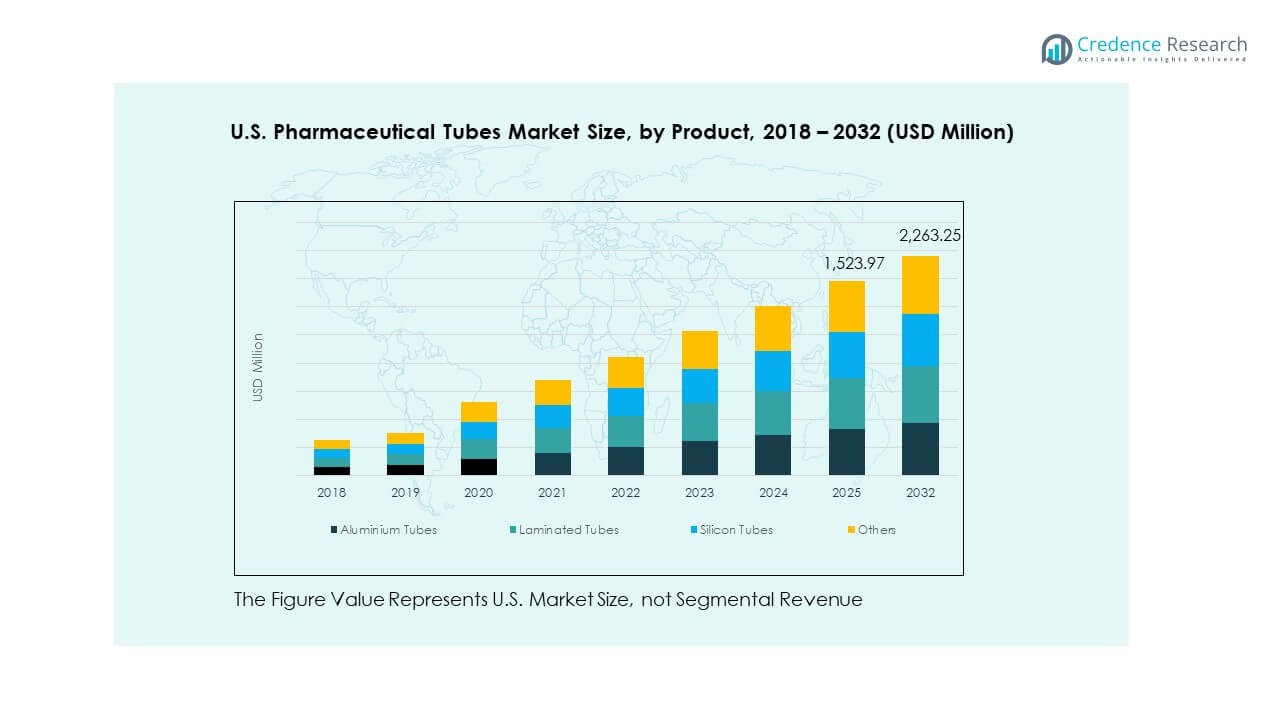
- Aluminium tubes account for roughly 35% of the product mix, reflecting high use in sensitive formulations requiring barrier strength.
- Laminated tubes represent about 30%, driven by strong adoption in OTC and dermatology products due to their balance of durability and print quality.
Market Drivers:
Strong Shift Toward High-Barrier and Contamination-Resistant Tube Formats
Growth in the U.S. Pharmaceutical Tubes Market stays firm due to strong demand for high-barrier packaging formats that protect sensitive formulations. Drug makers prefer laminated and aluminum tubes that block oxygen, light, and moisture. Rising production of ointments and gels increases use of tubes with strong sealing properties. Brands choose tamper-evident designs to support regulatory needs across controlled drug classes. It supports stable product delivery across dermatology and pain care products. Contract manufacturers upgrade lines to support rapid-fill, high-output systems. Growing consumer interest in clean and sterile packaging strengthens adoption across OTC categories. Tube suppliers invest in barrier-coating improvements for enhanced durability.
- For instance, Neopac’s Polyfoil mono-material barrier tubes use an HDPE structure with a strong EVOH barrier against oxygen and moisture to protect sensitive pharmaceutical and dental products.
Rising Adoption of User-Friendly and Precision-Dosing Tube Packaging
Demand rises due to growing preference for tubes that improve patient comfort during daily application routines. Drug companies shift toward nozzle-based and single-dose tubes to ensure accurate dispensing. Growth in chronic disease care increases the need for controlled-flow designs. The U.S. Pharmaceutical Tubes Market gains support from new usability standards across regulated packaging lines. It benefits patient adherence through lightweight and portable formats. Oral care, topical care, and pediatric formulations push higher volumes across retail channels. Hospitals and clinics prefer tubes that support safe handling and minimal contamination risk. Convenience features help strengthen consumer trust across major brands.
- For instance, Neopac offers Polyfoil tubes with dropper, pump, and child-resistant applicators designed to support correct dosage and safe application of liquid and semi-solid medications.
Expansion of Specialty Drugs and Semi-Solid Formulation Pipelines
Rising volumes of semi-solid drugs encourage companies to adopt tube solutions that maintain product integrity for longer periods. Growth in biologics and precision therapies expands use of sterile tube types. The U.S. Pharmaceutical Tubes Market benefits from expanding treatment portfolios across dermatology, oncology support care, and wound management. It supports pharma companies that need packaging with consistent barrier strength across sensitive ingredients. Contract manufacturers add dedicated cleanroom units to handle strict filling protocols. Higher focus on stability drives investment in multi-layer tube systems. Specialized drug launches increase demand for coated and UV-resistant tubes. Product developers choose tubes for controlled storage conditions across long supply chains.
Rising Digitalization and Automation Across Tube Production Facilities
Pharma packaging plants adopt automation to improve speed, quality, and precision across tube lines. AI-enabled inspection tools detect micro-defects and strengthen output uniformity. It supports the U.S. Pharmaceutical Tubes Market by lowering waste and improving compliance. Upgrade cycles increase across facilities that serve dermatology and oral care brands. Robotics improve sealing accuracy and reduce manual errors across high-volume runs. Digital tracking systems help reduce recall risks and improve supply chain transparency. Automated print-on-demand systems enhance branding accuracy for OTC products. Continuous upgrades help tube suppliers meet strict FDA and cGMP standards.
Market Trends:
Growing Shift Toward Eco-Friendly and Recyclable Tube Materials
Sustainability drives strong movement toward recyclable aluminum and mono-material plastic tubes. Drug companies introduce eco-focused packaging commitments to meet rising consumer expectations. The U.S. Pharmaceutical Tubes Market sees rapid growth in bio-based and PCR-based tube formats. It encourages suppliers to redesign tube structures with fewer material layers. Brands explore compostable or low-impact barrier options for non-sterile formulations. Retailers push greener packaging lines across topical and oral care shelves. Recycling initiatives gain visibility as states tighten waste-management policies. Tube makers test hybrid structures that reduce resin use without harming performance.
- For instance, EPL (formerly Essel Propack) has annual capacity of about 8 billion tubes and promotes eco-friendly laminated and extruded tubes as part of its “Leading the pack sustainably” strategy.
Emergence of Smart and Connected Tube Packaging
Technology adoption grows through coded tubes that support authentication and anti-counterfeit functions. Drug makers test digital markers to verify product identity at the point of use. The U.S. Pharmaceutical Tubes Market benefits from rising interest in serialization for OTC and prescription units. It improves traceability across large distribution networks. Smart printing technology supports batch data integration for better supply chain control. Patients gain access to guided-use information through QR-enabled tubes. Pharma firms experiment with color-changing indicators for temperature-sensitive drugs. Innovation helps reduce counterfeit penetration across vulnerable channels.
- For instance, Huhtamaki operates 101 locations in 36 countries, giving it a broad network for deploying serialized and smart-packaging solutions at industrial scale.
Higher Adoption of Premium Aesthetic Designs for Consumer Health Products
Consumer health brands focus on premium tube designs that improve shelf appeal. Growth across oral care, cosmetic-grade dermatology, and wellness categories supports high-quality laminated tubes. The U.S. Pharmaceutical Tubes Market advances through demand for smooth-finish, high-gloss printing and soft-touch surfaces. It encourages suppliers to invest in advanced graphics systems. Retail competition increases the use of elegant caps and applicators that enhance user comfort. Brands also push visually distinctive designs to build stronger loyalty. Customization expands across private-label healthcare products. Tube developers scale design capabilities to match rising brand differentiation needs.
Shift Toward Lightweight and Transport-Efficient Tube Construction
Demand rises for tube formats that lower freight weight and improve warehouse efficiency. Pharma suppliers move toward thinner walls supported by strong barrier coatings. The U.S. Pharmaceutical Tubes Market benefits from reduced material usage trends. It helps large distributors lower shipping costs across regional networks. Lightweight tubes improve handling in high-volume clinical settings. Logistics firms support these trends through new packaging standards. Brands also value low-weight options for e-commerce shipments. The trend supports stronger sustainability scores for large pharma firms.
Market Challenges Analysis:
Rising Compliance Pressure and Complex Regulatory Demands
The U.S. Pharmaceutical Tubes Market faces challenges due to strict packaging regulations that require high traceability and product stability. It must meet evolving FDA rules for labeling, sterility, and tamper-proof features. Smaller suppliers struggle to invest in advanced testing systems. Documentation workloads rise for multi-layer tube structures. High audit frequency increases operating strain across contract manufacturers. Complex material validation steps slow launch cycles. Tube makers must align with strict chemical safety rules. Regulatory variations across states add more complexity for nationwide distribution.
Higher Production Costs and Raw Material Price Volatility
Profitability pressure grows due to rising resin and aluminum prices. The U.S. Pharmaceutical Tubes Market experiences cost instability that affects planning for long contracts. It forces suppliers to adjust production schedules and tooling investments. Energy-intensive processes raise cost burdens across large tube plants. Firms struggle to maintain stable pricing for long-term pharma clients. Packaging upgrades require expensive machinery with long payback cycles. Skilled labor shortages increase wages across regulated facilities. Supply chain delays further reduce efficiency for high-volume orders.
Market Opportunities:
Expansion of Sustainable Tube Material Innovations
Stronger demand for recyclable and bio-based tubes creates new growth space. The U.S. Pharmaceutical Tubes Market benefits from rising interest in mono-material designs that reduce environmental impact. It encourages suppliers to launch eco-safe laminated structures. Pharma brands promote greener packaging to meet corporate sustainability targets. Tube makers can expand through partnerships with resin innovators. Retail pressure supports fast adoption of low-impact formats. Growth in clean-label consumer health products strengthens future demand.
Rising Demand for Tube Packaging in Specialized and Niche Drug Categories
Growth in dermatology, pediatrics, and wound care increases use of advanced tube formats. The U.S. Pharmaceutical Tubes Market gains advantage from rising development of semi-solid and gel-based therapies. It supports adoption of sterile and precision-dosing tube structures. Contract manufacturers can expand with tailored filling lines. Niche drug pipelines create new opportunities for premium tubes. Strong shift toward home-based care drives demand for easy-use formats. Brands value tubes for safe dispensing across sensitive formulations.
Market Segmentation Analysis:
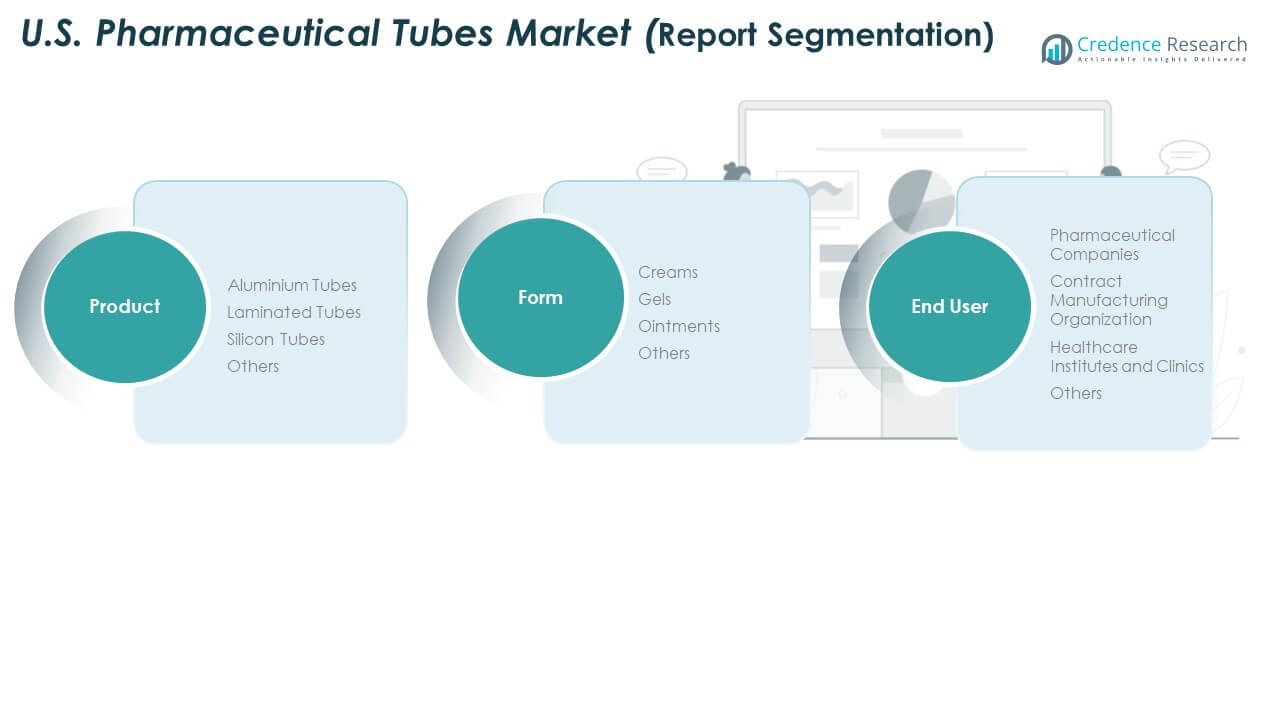
Product Segments
Aluminium tubes hold strong demand due to their high barrier strength and long shelf-life protection for sensitive formulations. Laminated tubes gain traction for their light weight and strong print quality that supports branding needs across OTC categories. Silicon tubes serve premium applications that require high flexibility and smooth dispensing. Other materials support niche uses where durability or low-reactive properties matter. The U.S. Pharmaceutical Tubes Market gains steady momentum from broad adoption of multi-layer structures across topical and oral care applications. It supports brands that need consistent sealing and contamination-resistant formats across regulated product lines.
Form Segments
Creams lead due to high usage in dermatology, wound care, and pain relief therapies. Gels expand through wider application in oral care, anti-inflammatory products, and specialty treatments. Ointments maintain strong demand across prescription skin therapies that require protective barrier delivery. Other semi-solid forms strengthen growth through niche formulations and pediatric use. Tube suppliers design barrier structures that match the stability needs of each form. It supports smooth filling operations and stable performance across varied viscosity levels. The segment mix broadens as drug makers diversify product pipelines.
- For instance, the European Tube Manufacturers Association (ETMA) reports that Europe’s annual production volume has varied in recent years, with a reported 11.5 billion tubes manufactured in 2020 and again in 2024 (down from a peak of nearly 11.9 billion in 2023). The figures consistently show that laminated tubes represent the largest share of this volume, at approximately 38%, underlining how creams, gels, and ointments rely heavily on laminated formats for their barrier properties and hygiene.
End User Segments
Pharmaceutical companies dominate demand due to large production volumes across branded and generic portfolios. Contract manufacturing organizations expand fast by offering flexible capacity and advanced tube-filling capabilities. Healthcare institutes and clinics strengthen procurement for treatment-based dispensing needs across dermatology and wound management. Other end users adopt tubes for specialty and wellness formulations. Growth stays strong due to rising focus on secure, hygienic, and patient-friendly packaging. It supports wider adoption across retail and clinical channels. The segment landscape reflects strong integration between drug developers and tube converters.
Segmentation:
Product Segments
- Aluminium Tubes
- Laminated Tubes
- Silicon Tubes
- Others
Form Segments
- Creams
- Gels
- Ointments
- Others
End User Segments
- Pharmaceutical Companies
- Contract Manufacturing Organization
- Healthcare Institutes and Clinics
- Others
Regional Analysis:
Northeast Region
The U.S. Pharmaceutical Tubes Market shows strong presence in the Northeast, holding an estimated 35% share. The region leads due to a dense base of pharmaceutical manufacturers and research-driven drug developers. It benefits from advanced production hubs in New Jersey, Pennsylvania, and Massachusetts. Large prescription volumes support steady procurement of high-barrier tubes for topical and oral formulations. It gains support from strong distribution networks that connect major medical centers and retail pharmacies. Contract manufacturers expand capacity to meet rising orders from specialty drug producers. Tube suppliers focus on premium laminated and aluminium formats to match high regulatory standards.
Midwest and South
The Midwest accounts for nearly 30% of the national share due to strong industrial infrastructure and high CMO penetration. It benefits from efficient supply chains and large-scale plants that handle bulk tube production. The U.S. Pharmaceutical Tubes Market grows in this region through expanding dermatology and wound care drug pipelines. It supports investments in automation and cleanroom-grade filling operations. The South holds close to 25% share driven by rapid growth of pharmaceutical clusters in states such as Texas, North Carolina, and Georgia. It strengthens tube demand through expanding biologics and specialty care production. Retail-driven OTC categories also boost procurement volumes.
West Region
The West contributes around 10% share supported by strong consumer health and wellness product manufacturing. It benefits from innovation-led companies that favor sustainable and lightweight tube formats. Tube suppliers respond to rising demand for recyclable and mono-material packaging. The U.S. Pharmaceutical Tubes Market in this region gains support from high prescription activity and strong healthcare access. It attracts growing investment from niche pharmaceutical brands and natural product developers. Production sites expand to serve rising demand for dermatology and pain relief formulations. The region also gains traction through e-commerce-driven distribution of tube-based OTC products.
Key Player Analysis:
Competitive Analysis:
The U.S. Pharmaceutical Tubes Market reflects strong competition driven by packaging specialists, diversified converters, and contract manufacturers. It features companies that invest in high-barrier materials, automated filling lines, and sustainable tube designs. Large players focus on laminated and aluminium tubes to meet regulatory and performance needs across prescription and OTC categories. Mid-sized firms gain ground through agile production and customization services. It maintains steady rivalry across product quality, printing precision, and compliance capabilities. Innovation in recyclable formats shapes competitive advantages for leading manufacturers. Partnerships with pharmaceutical companies strengthen long-term supply agreements.
Recent Developments:
- In January 2025, Albéa Group launched the ‘Metamorphosis’ paper-based tube for the North American market. Produced at its Mexico plant, this innovation offers pharmaceutical and personal care brands a highly sustainable tube solution using up to 50% FSC-certified paper and EcoFusion Top technology, which drastically reduces plastic content. The new launch caters to brands looking for dramatic reductions in plastic usage in their tube packaging.
- In April 2025, Huhtamaki Oyj announced its acquisition of Zellwin Farms Company for USD 18 million. The deal is set to strengthen Huhtamaki’s growth in the U.S. molded fiber segment, which includes sustainable packaging for health-related products. Zellwin Farms, based in Florida, has long served egg producers and its integration with Huhtamaki will significantly enhance capacity for U.S. fiber-based packaging, indirectly supporting the pharmaceutical tubes market as Huhtamaki expands its sustainable packaging portfolio in the region.
- In May 2024, Neopac reinforced its commitment to sustainable pharmaceutical packaging by announcing new tube solutions and launching the Polyfoil® Sensation series at its U.S. facility. This new product line is designed for advanced barrier protection, making it suitable for sensitive pharmaceutical applications.
Shape Your Report to Specific Countries or Regions & Enjoy 30% Off!
Report Coverage:
The research report offers an in-depth analysis based on product, form, and end user segments. It details leading market players, providing an overview of their business, product offerings, investments, revenue streams, and key applications. Additionally, the report includes insights into the competitive environment, SWOT analysis, current market trends, as well as the primary drivers and constraints. Furthermore, it discusses various factors that have driven market expansion in recent years. The report also explores market dynamics, regulatory scenarios, and technological advancements that are shaping the industry. It assesses the impact of external factors and global economic changes on market growth. Lastly, it provides strategic recommendations for new entrants and established companies to navigate the complexities of the market.
Future Outlook:
- Demand for lightweight laminated and aluminium tubes will strengthen across pharmaceutical production.
- Sustainable mono-material designs will gain wider adoption due to rising environmental priorities.
- Automation and AI-driven inspection systems will reshape tube manufacturing efficiency.
- Contract manufacturing groups will expand capacity to support flexible high-volume orders.
- Precision-dosing and user-friendly dispensing formats will see greater integration.
- Growth in dermatology and wound care drugs will push higher tube procurement.
- Digital traceability and authentication features will enter mainstream packaging.
- Regulatory pressure will drive upgrades in material safety and barrier performance.
- Innovations in recyclable caps and seals will enhance circular packaging programs.
- Regional expansion of pharma clusters will increase localized production partnerships.


