Market Overview
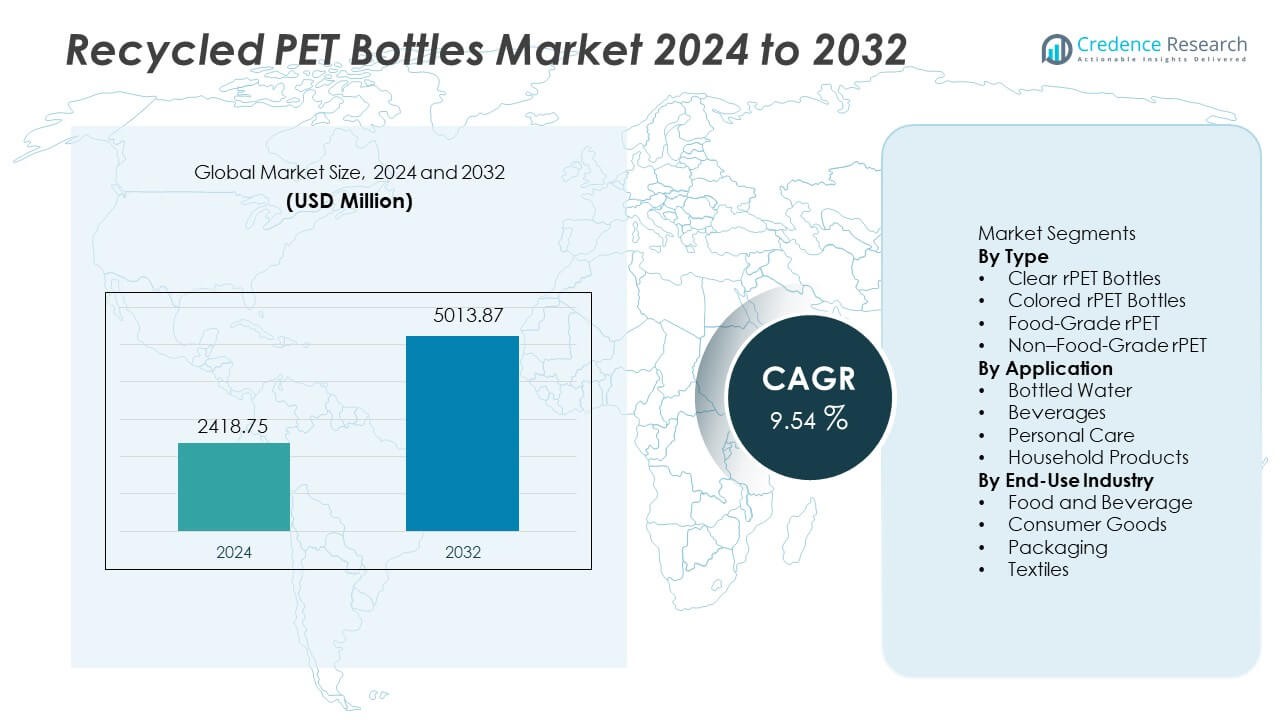
The Recycled PET Bottles Market reached USD 2,418.75 million in 2024 and is expected to reach USD 5,013.87 million by 2032, expanding at a CAGR of 9.54% during the forecast period.
| REPORT ATTRIBUTE |
DETAILS |
| Historical Period |
2020-2023 |
| Base Year |
2024 |
| Forecast Period |
2025-2032 |
| Recycled PET Bottles Market Size 2024 |
USD 2,418.75 Million |
| Recycled PET Bottles Market, CAGR |
9.54% |
| Recycled PET Bottles Market Size 2032 |
USD 5,013.87 Million |
Top players in the Recycled PET Bottles market include Plastipak Holdings Inc., Indorama Ventures Public Company Limited, ALPLA Group, Far Eastern New Century Corporation, Phoenix Technologies International LLC, CarbonLITE Industries LLC, DAK Americas LLC, Evergreen Plastics, PolyQuest Inc., and Clear Path Recycling LLC. These companies invest in bottle-to-bottle recycling capacity, food-grade pellet upgrades, and long-term supply agreements with global beverage brands. North America leads the market with 33% share, supported by strong consumption of bottled water and advanced recycling systems, followed by Europe at 30%, driven by strict recycled content mandates and high collection rates. Asia Pacific holds 27%, supported by rising beverage demand and expanding recycling infrastructure across major economies.
Access crucial information at unmatched prices!
Request your sample report today & start making informed decisions powered by Credence Research Inc.!
Download Sample
Market Insights
- The market reached USD 2,418.75 million in 2024 and is projected to reach USD 5,013.87 million by 2032 at 9.54% CAGR, supported by wider adoption of recycled content across beverage and personal care packaging lines.
- Rising bottled water consumption and sustainability goals drive clear rPET bottles that hold 52% share, with growing use of food-grade pellets in beverages and bottled water due to brand commitments and regulatory approvals across developed markets.
- Key trends include expansion of bottle-to-bottle recycling capacity, increased decontamination technology investments, and growing rPET use in personal care and household goods supported by sustainable branding initiatives across multiple retail channels.
- Competitive activity remains strong as major recyclers partner with beverage companies, expand food-grade processing, and develop traceable sourcing programs; technology upgrades improve quality and help global players secure long-term supply agreements.
- North America holds 33% share, followed by Europe at 30% and Asia Pacific at 27%, supported by advanced recycling systems, strong collection networks, and rising demand for sustainable packaging across beverages and consumer goods.
 Market Segmentation Analysis:
By Type
Clear rPET bottles lead this segment with near 52% share, supported by high-quality transparency and strong demand in beverage and bottled water applications. Food-grade rPET follows with near 28% share, driven by regulatory approvals that support large beverage brands adopting recycled materials. Colored rPET holds near 14% share, mainly used in personal care and household products that require brand-specific shades. Non–food-grade rPET captures near 6% share, supported by industrial and textile applications. Growth relies on improved recycling processes and food-grade pellet technology that increases adoption in high-volume packaging lines across global markets.
- For instance, Coca-Cola uses rPET bottles that can include a significant amount of recycled content, backed by robust supply chain efforts. Coca-Cola also operates numerous recycling partnerships worldwide to improve the supply of food-grade rPET.
By Application
Bottled water leads with near 43% share, supported by large consumption and strong sustainability targets among beverage brands. Beverages capture near 32% share, driven by carbonated drinks and juice brands shifting to recycled packaging formats. Personal care holds near 15% share, where cosmetic and hygiene brands promote recycled packaging to support eco claims. Household products represent near 10% share, supported by cleaning and detergent brands using recycled PET containers. Strong focus on circular consumption encourages manufacturers to integrate rPET into mainstream consumer packaging. Growth continues as major beverage companies adopt recycled content mandates in global operations.
- For instance, PepsiCo now uses rPET across more than 20 European bottled drink lines, and some local brands reached 100 percent rPET packaging.
By End-Use Industry
Food and beverage lead with near 46% share, supported by high recycled usage in water and soft drink packaging. Packaging holds near 29% share, due to strong adoption in branded retail goods, refill packs, and sustainable catering solutions. Consumer goods capture near 15% share, led by hygiene and cosmetic products introducing recycled PET formats. Textiles hold near 10% share, supported by polyester fiber production from recycled bottle flakes. Rising sustainability goals and regulatory rules on recycled content encourage wider adoption across end-use categories. Global brands continue investing in recycled PET to reduce environmental footprint and secure long-term supply.
Key Growth Drivers
Rising Beverage and Bottled Water Consumption
Growing global demand for bottled water and ready-to-drink beverages increases the need for recycled PET bottles across food and beverage packaging lines. Major beverage brands adopt higher recycled content targets to align with sustainability goals. Several governments support recycled mandates that encourage beverage producers to use rPET instead of virgin PET. The growth of eco-labeled consumer goods also drives demand for transparent and food-grade rPET. Higher collection rates and investment in bottle-to-bottle recycling strengthen feedstock availability, supporting long-term market expansion across developed and developing regions.
- For instance, Nestlé is actively working to increase its use of recycled plastics globally and in its water brands in Europe and North America to reduce its reliance on new plastic.
Corporate Sustainability and Circular Packaging Commitments
Global consumer brands invest in circular packaging initiatives that reduce plastic waste and increase the use of recycled PET bottles in mainstream product ranges. Brand commitments include pledges to increase recycled content in beverage packaging and personal care portfolios. Retailers support recycled packaging formats to meet sustainability expectations and promote environmentally friendly products. These initiatives expand adoption of food-grade rPET in beverages and bottled water. Strong commitments from multinational companies accelerate large-scale market penetration, supporting broader adoption in high-volume packaging categories with clear recycling pathways.
- For instance, Unilever confirmed recycled material use across a significant amount of plastic packaging across its product range and is investing in technology and infrastructure to expand capacity for high-grade recycled plastic.
Regulatory Support and Recycling Investments
Recycling rules encourage use of food-grade rPET in beverages and fast-moving consumer goods. Many regions implement recycled content mandates for plastic packaging, accelerating adoption across bottled water and beverage segments. Investment in recycling technology improves cleaning and decontamination processes, enabling wider food-grade certification. Government action supports bottle collection systems and coastal recovery programs, raising feedstock availability. Regional funding promotes expansion of bottle-to-bottle recycling plants, improving long-term supply stability. These developments create a favorable regulatory environment for sustained rPET market growth.
Key Trends and Opportunities
Adoption of Bottle-to-Bottle Recycling Technology
Bottle-to-bottle systems increase the percentage of recovered PET reused in new bottles without degrading clarity or strength. New cleaning and decontamination technologies support food-contact standards and expand recycled usage in premium beverage packaging. Producers benefit from lower dependence on virgin PET and reduced carbon footprint benefits. High-quality rPET from closed-loop systems unlocks opportunities for large beverage companies to achieve sustainability targets. This trend encourages long-term investment in advanced recycling infrastructure and supports global expansion of bottle-to-bottle capacity.
- For instance, Indorama Ventures operates over 20 bottle-to-bottle recycling facilities and processed more than 342,000 metric tons of PET through advanced depolymerization and pelletization units in 2022.
Growing Use of rPET in Personal Care and Household Products
Cosmetic and household brands adopt rPET packaging as part of sustainability claims and eco-friendly product positioning. Personal care companies redesign bottles to support recycled content while maintaining brand aesthetics. Digital labeling and eco messaging also encourage consumer acceptance of recycled packaging. Household cleaning brands expand use of colored rPET containers in liquid cleaners and detergents. These changes create opportunities in mid-range and premium segments. Growing demand for sustainable packaging enables wider adoption of rPET products across personal care and household goods categories.
- For instance, L’Oréal used recycled plastics in more than 209 million cosmetic units during 2022 and upgraded packaging designs that integrate up to 97 percent post-consumer resin in certain hair-care products.
Key Challenges
Quality Variation and Food-Grade Certification Limitations
Recycled PET bottles must meet strict hygiene and quality standards for food-contact applications. Variations in feedstock quality increase processing requirements and limit food-grade approvals in certain regions. Contamination during collection and sorting raises costs and affects supply consistency. Food and beverage brands need certified material that meets clarity and safety requirements for bottled water and beverages. Quality variation remains a major barrier for large-scale adoption of rPET in regulated markets, pushing suppliers to invest in enhanced decontamination and upgrading technologies.
Limited Collection Infrastructure and Supply Shortage
Regions lack adequate bottle collection systems, resulting in insufficient supply of high-quality PET feedstock. Many developing markets see high post-consumer waste levels, but limited infrastructure restricts recycling capacity. Seasonal demand fluctuations also strain supply chains and increase pricing volatility. The shortage of food-grade material limits adoption in high-volume beverage applications and makes brands dependent on global supply networks. Developing efficient collection systems remains essential for long-term market expansion and stable supply conditions.
Regional Analysis
North America
North America holds near 33% share supported by strong beverage consumption, high recycling rates, and established bottle-to-bottle processing capacity. The United States leads adoption of food-grade rPET in bottled water and carbonated beverages due to strong sustainability commitments among major brands. Canada invests in enhanced collection networks and expanded recycling capacity that improves rPET availability for packaging producers. Consumers increasingly prefer eco-labeled bottles, which encourages manufacturers to expand recycled content in mainstream product lines. Strong regulatory focus on plastic reduction supports long-term adoption of recycled PET across beverage and consumer product categories.
Europe
Europe captures near 30% share driven by strict packaging regulations, recycled content mandates, and advanced collection systems across major economies. Germany, France, and the United Kingdom lead adoption of rPET bottles in beverage packaging due to strong sustainability targets and extended producer responsibility rules. The European Union encourages bottle-to-bottle recycling infrastructure and supports circular packaging investments. Many beverage and personal care companies promote high recycled content on product labels to strengthen brand reputation. Growing environmental awareness encourages long-term use of recycled PET in multiple packaging applications across retail and consumer goods sectors.
Asia Pacific
Asia Pacific holds near 27% share supported by large beverage consumption and expanding recycling capacity in China, Japan, and India. China invests in domestic bottle recycling plants that improve supply of food-grade rPET for beverage brands. Japan leads consumption of recycled materials due to strong recycling culture and advanced collection networks. India develops urban collection systems but continues to face supply constraints in food-grade material. Strong growth in bottled water and personal care packaging increases rPET usage across retail markets. Regional sustainability commitments support long-term adoption of recycled PET across consumer products and beverages.
Latin America
Latin America holds near 6% share influenced by growing regulatory focus on plastic waste reduction and rising beverage consumption. Brazil promotes recycled PET usage in bottled water and soft drink packaging due to strong environmental policies. Mexico invests in bottle collection and processing networks that expand supply of recycled content for packaging producers. Limited infrastructure in several countries slows broad adoption, yet sustainability programs support gradual expansion of bottle-to-bottle recycling capacity. Retail brands promote recycled content in personal care and household goods. Growth continues as consumers show increasing interest in sustainable packaging.
Middle East and Africa
Middle East and Africa account for near 4% share, driven by early-stage recycling programs and rising demand for bottled water and beverages. South Africa develops recycling initiatives that support food-grade supply for regional brands. Gulf countries launch pilot projects for bottle collection and rPET processing to support sustainability goals. Limited recycling infrastructure remains a barrier for widespread adoption, yet consumer interest in eco-friendly packaging grows across urban markets. International beverage companies introduce recycled content bottles in premium segments first. Long-term growth depends on stronger recycling capacity and consistent bottle collection systems across major urban centers.
Market Segmentations:
By Type
- Clear rPET Bottles
- Colored rPET Bottles
- Food-Grade rPET
- Non–Food-Grade rPET
By Application
- Bottled Water
- Beverages
- Personal Care
- Household Products
By End-Use Industry
- Food and Beverage
- Consumer Goods
- Packaging
- Textiles
By Geography
- North America
- Europe
- Germany
- France
- U.K.
- Italy
- Spain
- Rest of Europe
- Asia Pacific
- China
- Japan
- India
- South Korea
- South-east Asia
- Rest of Asia Pacific
- Latin America
- Brazil
- Argentina
- Rest of Latin America
- Middle East & Africa
- GCC Countries
- South Africa
- Rest of the Middle East and Africa
Competitive Landscape
Competitive landscape includes Plastipak Holdings Inc., Indorama Ventures Public Company Limited, ALPLA Group, Far Eastern New Century Corporation, Phoenix Technologies International LLC, CarbonLITE Industries LLC, DAK Americas LLC, Evergreen Plastics, PolyQuest Inc., and Clear Path Recycling LLC. Leading producers focus on expanding bottle-to-bottle recycling capacity and improving food-grade rPET supply for beverage and bottled water brands. Many companies invest in advanced decontamination and cleaning technologies that enable wider use in regulated packaging. Strategic partnerships with global beverage companies help secure long-term supply agreements and increase recycled content across major brands. Some producers integrate sustainability programs that support collection and reverse logistics for PET bottles in urban areas. Expansion into high-growth regions, including Asia Pacific and Latin America, improves supply access and supports rising beverage consumption. Technology investments and merger activity strengthen regional presence and long-term competitiveness in the global recycled PET bottles market.
Key Player Analysis
- Plastipak Holdings Inc.
- Indorama Ventures Public Company Limited
- ALPLA Group
- Far Eastern New Century Corporation
- Phoenix Technologies International LLC
- CarbonLITE Industries LLC
- DAK Americas LLC
- Evergreen Plastics
- PolyQuest Inc.
- Clear Path Recycling LLC
Recent Developments
- In August 2025, Indorama Ventures Public Company Limited announced it had recycled 150 billion PET bottles since 2011.
- In October 2023, Phoenix Technologies International LLC (together with Indorama Ventures) expressed optimism that rising brand sustainability commitments and evolving extended-producer-responsibility laws would spur greater demand for recycled PET, despite slower-than-expected growth in demand at that time.
Shape Your Report to Specific Countries or Regions & Enjoy 30% Off!
Report Coverage
The research report offers an in-depth analysis based on Type, Application, End-Use Industry and Geography. It details leading market players, providing an overview of their business, product offerings, investments, revenue streams, and key applications. Additionally, the report includes insights into the competitive environment, SWOT analysis, current market trends, as well as the primary drivers and constraints. Furthermore, it discusses various factors that have driven market expansion in recent years. The report also explores market dynamics, regulatory scenarios, and technological advancements that are shaping the industry. It assesses the impact of external factors and global economic changes on market growth. Lastly, it provides strategic recommendations for new entrants and established companies to navigate the complexities of the market.
Future Outlook
- Beverage brands will increase recycled content targets in bottled water and soft drinks.
- Bottle-to-bottle capacity will expand through new decontamination investments.
- Food-grade approvals will rise across global beverage packaging lines.
- rPET use will grow in personal care and household cleaning products.
- Coastal recovery programs will strengthen regional feedstock supply.
- Digital traceability will support brand claims linked to recycled content.
- Global regulations will encourage higher recycled content in plastic bottles.
- Retailers will promote recycled labels that improve consumer acceptance.
- Partnerships with beverage companies will secure long-term rPET demand.
- Expansion in emerging markets will support growth in regional supply and consumption.


