Market Overview:
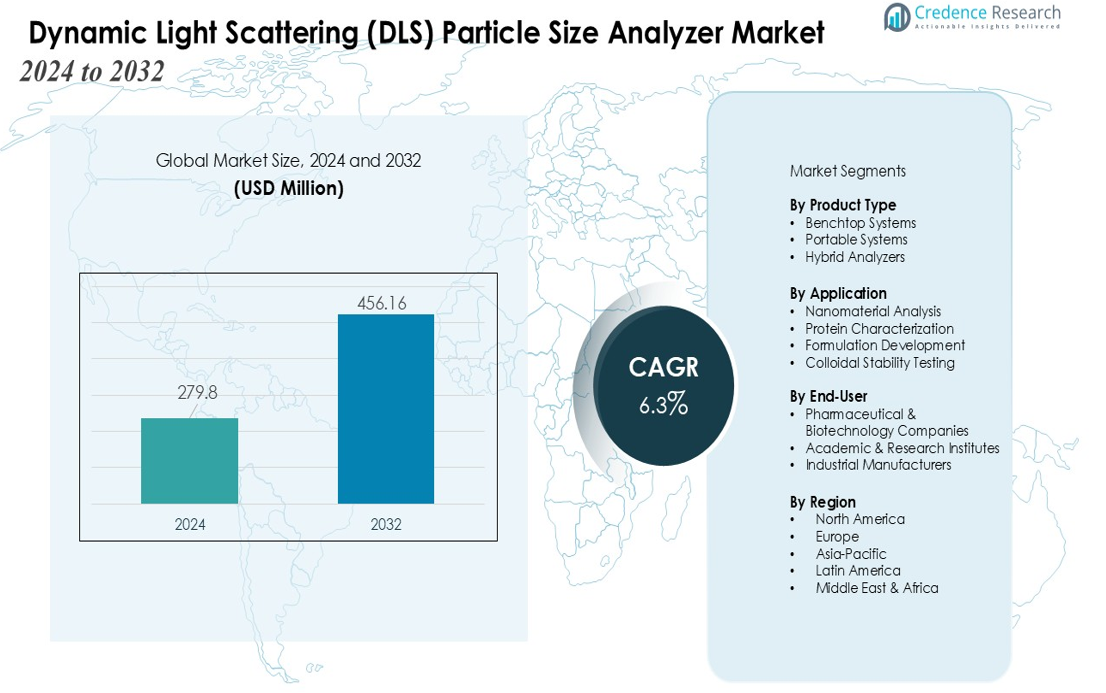
The Dynamic Light Scattering (DLS) Particle Size Analyzer Market size was valued at USD 279.8 million in 2024 and is anticipated to reach USD 456.16 million by 2032, at a CAGR of 6.3% during the forecast period (2024-2032).
| REPORT ATTRIBUTE |
DETAILS |
| Historical Period |
2020-2023 |
| Base Year |
2024 |
| Forecast Period |
2025-2032 |
| Dynamic Light Scattering (DLS) Particle Size Analyzer Market Size 2024 |
USD 279.8 million |
| Dynamic Light Scattering (DLS) Particle Size Analyzer Market, CAGR |
6.3% |
| Dynamic Light Scattering (DLS) Particle Size Analyzer Market Size 2032 |
USD 456.16 million |
Market growth is primarily driven by the expanding need for accurate particle size analysis to support product development, process optimization, and regulatory compliance. Industries such as biopharmaceuticals and nanotechnology depend on DLS systems to monitor colloidal stability, ensure batch consistency, and validate formulation performance. Technological advancements—including enhanced detection sensitivity, automated workflows, and integrated data analytics—further strengthen the market outlook. Additional drivers include the rising adoption of nanoparticles in drug delivery, growing emphasis on quality control in manufacturing, and the increased focus on research-based applications.
Regionally, North America leads the market due to its strong research infrastructure, advanced pharmaceutical sector, and sustained investment in material characterization technologies. Europe follows closely, supported by robust scientific research and strict quality standards. Meanwhile, Asia-Pacific is emerging as the fastest-growing region, driven by expanding manufacturing capabilities, rising R&D spending, and growing adoption of nanotechnology across China, Japan, and South Korea.
Market Insights:
- The Dynamic Light Scattering (DLS) Particle Size Analyzer Market was valued at USD 279.8 million in 2024 and is projected to reach USD 456.16 million by 2032, registering a CAGR of 6.3%.
- Rising demand for accurate nanoparticle and protein characterization in biopharmaceutical R&D strengthens market expansion across drug development and formulation workflows.
- Increasing adoption of DLS systems in nanotechnology and advanced materials supports consistent product quality, batch uniformity, and process optimization.
- Continuous technological advancements, including high-sensitivity detection, automated workflows, and smart analytics, improve system performance and accelerate user adoption.
- High instrument costs, sensitivity to sample conditions, and challenges in analyzing heterogeneous particles create performance and accessibility constraints for some end users.
- North America leads the market with 38% share, followed by Europe at 32%, driven by strong R&D ecosystems, regulatory standards, and advanced manufacturing capabilities.
- Asia-Pacific holds 24% share and represents the fastest-growing region due to expanding biotechnology clusters, increasing nanomaterial research, and rapid industrial modernization.
Access crucial information at unmatched prices!
Request your sample report today & start making informed decisions powered by Credence Research Inc.!
Download Sample
Market Drivers:
Rising Adoption in Biopharmaceutical Research and Drug Development
The Dynamic Light Scattering (DLS) Particle Size Analyzer Market expands due to strong demand from biopharmaceutical laboratories focused on nanoparticle analysis, protein characterization, and formulation stability. It supports critical workflows in monoclonal antibody production, gene therapy vectors, and vaccine development. Researchers rely on DLS to detect aggregation, verify size distribution, and ensure product integrity. Consistent use of particle sizing tools strengthens quality assurance across early discovery and commercial-scale activities.
- For instance, Dynamic Light Scattering (DLS) is a common method used to facilitate purity and stability analyses of adenoviral vectors, which are typically sized within the 0.07 µm (70 nm) – 0.1 µm (100 nm) range.
Growing Emphasis on Nanomaterial Quality and Industrial Process Control
Industries working with polymers, coatings, and advanced materials depend on particle size data to maintain uniformity and performance standards. The market grows as manufacturers integrate DLS systems into process control frameworks to improve product consistency. It enables real-time insights that help professionals refine formulations and reduce variability. Increased focus on high-precision characterization elevates the role of DLS instruments in industrial production environments.
- For instance, Entegris reported that their Nicomp® DLS system delivers high sensitivity and resolution in measuring sub-micron particle size and zeta potential, providing manufacturers real-time data to tightly control product consistency with precision down to sub-10 nanometer scale.
Advancements in Detection Sensitivity and Automation Capabilities
Technological enhancements fuel market momentum by improving measurement accuracy, sample throughput, and ease of operation. Modern DLS analyzers offer higher sensitivity for ultra-fine particle detection, enhancing their value in research-intensive sectors. It benefits users through automated alignment, intuitive software, and integrated analytics that support rapid decision-making. Enhanced operational efficiency encourages wider adoption across academic institutes and industrial laboratories.
Rising Regulatory Focus on Product Safety and Analytical Compliance
Stricter global regulations on drug quality, environmental monitoring, and material validation contribute to sustained market growth. The market gains traction as organizations adopt DLS instruments to meet evolving standards for particle characterization and purity verification. It supports compliance efforts by providing reliable, traceable, and repeatable measurement outputs. Expansion of regulatory frameworks across pharmaceuticals and specialty chemicals reinforces demand for precise particle sizing technologies.
Market Trends:
Increasing Integration of Automation, AI Analytics, and High-Sensitivity Detection
The Dynamic Light Scattering (DLS) Particle Size Analyzer Market progresses through rapid advancements in automation and intelligent data processing. Many laboratories upgrade to systems that deliver higher sensitivity, improved repeatability, and streamlined workflows. It enhances productivity by reducing manual intervention and supporting accurate interpretation of complex particle distributions. AI-enabled analytics gain traction for anomaly detection, data validation, and trend modeling. Hybrid optical technologies extend measurement ranges and improve performance for polydisperse samples. Demand for user-friendly interfaces grows as organizations prioritize efficiency and consistent quality in research and manufacturing environments.
- For instance, Malvern Panalytical’s Mastersizer Auto-Lab automates the analysis of up to 45 samples in a queue, drastically reducing manual work time from 7.5 hours to just about 60 minutes of setup, significantly boosting laboratory efficiency.
Expanding Use in Nanomedicine, Biotechnology, and Advanced Materials Development
The market strengthens as nanomedicine and biotherapeutics accelerate global investment in nanoparticle characterization. It plays an essential role in quality assessment for lipid nanoparticles, viral vectors, and protein-based formulations. Rising emphasis on the stability and safety of nanoscale drug carriers drives wider integration in R&D settings. Adoption increases within materials science where engineers evaluate colloidal behavior, dispersion quality, and polymer performance. Market momentum grows with the expansion of green materials and functional nanomaterials across electronics, energy, and environmental sectors. Collaboration between research institutions and instrument manufacturers supports continuous innovation and broader market penetration.
- For instance, Pfizer-BioNTech utilized lipid nanoparticle characterization for their mRNA SARS-CoV-2 vaccine formulation, incorporating ALC, cholesterol, DSPC, and a proprietary PEG-lipid to achieve over 90% encapsulation efficiency for mRNA cargo.
Market Challenges Analysis:
High Technical Complexity and Limitations in Measuring Heterogeneous Samples
The Dynamic Light Scattering (DLS) Particle Size Analyzer Market faces challenges related to the inherent sensitivity of the technique. It struggles with accurate characterization when samples contain wide size distributions or irregularly shaped particles. Users often encounter errors caused by dust, contaminants, or improper sample preparation. High dependency on operator expertise limits repeatability in less-controlled environments. Constraints in measuring highly concentrated or opaque samples reduce suitability for some industrial workflows. These technical barriers create a need for complementary analytical tools, increasing overall operational complexity.
High Instrument Costs and Limited Accessibility for Small Laboratories
The market experiences pressure from the high cost of advanced DLS analyzers, which restricts adoption among academic institutions and small research facilities. It requires substantial investment in maintenance, calibration, and technical support, raising long-term ownership expenses. Limited funding in emerging economies slows penetration of high-end systems. Price-sensitive users opt for alternative particle sizing methods with lower operational demands. The gap between advanced capabilities and affordability continues to challenge broader deployment across global markets.
Market Opportunities:
Growing Demand from Nanomedicine, Biologics, and Advanced Therapeutics
The Dynamic Light Scattering (DLS) Particle Size Analyzer Market benefits from expanding applications in nanomedicine, lipid-based drug delivery, viral vector development, and protein formulation. It supports rising requirements for high-precision characterization to ensure stability and safety of nanoscale therapeutics. Increasing research on targeted drug delivery and gene therapy creates new opportunities for advanced particle sizing solutions. Strong growth in biologics pipelines drives demand for tools that monitor aggregation and colloidal behavior. Adoption rises as pharmaceutical companies emphasize stringent quality standards. The shift toward complex biologic modalities strengthens the long-term opportunity landscape.
Expansion in Emerging Markets and Integration with Smart Laboratory Ecosystems
The market gains momentum in Asia-Pacific, Latin America, and the Middle East, where R&D investments continue to rise. It aligns with regional efforts to improve material science capabilities, strengthen biotech sectors, and modernize quality control infrastructure. Integration of DLS systems with digital laboratory platforms opens new potential for automated workflows and centralized data management. Hybrid instruments combining DLS with complementary optical methods widen application scopes in industrial and academic settings. Growth of contract research and manufacturing organizations fuels broader deployment of advanced analyzers. Increasing emphasis on digital transformation in laboratories creates sustained opportunities for next-generation DLS technologies.
Market Segmentation Analysis:
By Product Type
The Dynamic Light Scattering (DLS) Particle Size Analyzer Market segments into benchtop systems, portable instruments, and hybrid analyzers. Benchtop systems hold the largest share due to their high accuracy, advanced optics, and suitability for complex research workflows. It gains traction in pharmaceutical, biotechnology, and materials laboratories that require precise and repeatable measurements. Portable instruments expand steadily with rising demand for flexible, on-site particle characterization. Hybrid analyzers grow in adoption as users seek integrated solutions that combine DLS with complementary analytical techniques.
- For instance, the Xtal Concepts SpectroLight 600/610 benchtop in situ DLS device enables ultra-precise particle size measurements with sample volumes as low as 0.08 µl and typical high-end accuracy meeting relevant ISO standards, thus setting a benchmark in pharmaceutical and biotech research applications.
By Application
The market categorizes applications into nanomaterial analysis, protein characterization, formulation development, and colloidal stability testing. Nanomaterial analysis leads the segment due to rapid growth in advanced materials, coatings, and electronic components. It supports industries that require tight control over particle size distribution and dispersion quality. Protein characterization expands in line with the surge in biologics, vaccines, and gene therapy research. Formulation development and stability testing maintain strong demand within pharmaceuticals, specialty chemicals, and food science.
- For instance, Nanophase Technologies Corporation produces nanostructured coatings with zinc oxide nanoparticles providing 99% UV protection and scratch resistance ratings exceeding 5H hardness.
By End-User
The market serves pharmaceutical and biotechnology companies, academic and research institutes, and industrial manufacturers. Pharmaceutical and biotechnology companies dominate due to intensive reliance on nanoparticle and protein analysis for R&D and quality control. It strengthens adoption as companies prioritize regulatory compliance and product consistency. Academic and research institutes contribute significant demand driven by expanding nanoscience programs. Industrial manufacturers leverage DLS instruments to optimize production processes and maintain material performance standards.
Segmentations:
By Product Type
- Benchtop Systems
- Portable Systems
- Hybrid Analyzers
By Application
- Nanomaterial Analysis
- Protein Characterization
- Formulation Development
- Colloidal Stability Testing
By End-User
- Pharmaceutical & Biotechnology Companies
- Academic & Research Institutes
- Industrial Manufacturers
By Region
- North America
- Europe
- Germany
- France
- U.K.
- Italy
- Spain
- Rest of Europe
- Asia Pacific
- China
- Japan
- India
- South Korea
- South-east Asia
- Rest of Asia Pacific
- Latin America
- Brazil
- Argentina
- Rest of Latin America
- Middle East & Africa
- GCC Countries
- South Africa
- Rest of the Middle East and Africa
Regional Analysis:
North America
North America accounted for 38% of the Dynamic Light Scattering (DLS) Particle Size Analyzer Market in 2024, supported by strong adoption across pharmaceutical and biotechnology industries. The region maintained the lead due to high investment in precision analytical technologies. Research institutions across the United States drive advancements in nanoparticle characterization and biologics development. It benefits from strong collaborations between academic laboratories and instrument manufacturers. Demand continues to rise as facilities adopt automation, digital data systems, and high-throughput workflows. Regulatory focus on analytical accuracy strengthens long-term regional dominance.
Europe
Europe held 32% of the market in 2024, driven by strict regulatory standards and a mature research ecosystem. The region sustains high adoption of advanced particle sizing systems across Germany, the United Kingdom, and France. It aligns with industry demand for reliable analytical tools that support compliance and product quality assurance. Laboratories integrate DLS technologies to enhance repeatability and process efficiency. Investments in nanotechnology, polymer engineering, and pharmaceutical R&D reinforce growth. Strong academic–industrial collaboration further supports technology penetration across the region.
Asia-Pacific
Asia-Pacific captured 24% of the market in 2024, reflecting rapid industrial expansion and growing R&D capabilities. The region demonstrates rising adoption of DLS analyzers across China, Japan, South Korea, and India. It benefits from significant investment in biotechnology, nanomaterials, and advanced manufacturing. Government-funded innovation programs strengthen demand for precision measurement instruments. Industrial modernization increases the need for accurate quality-control technologies. Expanding pharmaceutical and specialty material production positions Asia-Pacific as a key accelerator of global market growth.Top of Form
Shape Your Report to Specific Countries or Regions & Enjoy 30% Off!
Key Player Analysis:
- Malvern Panalytical
- Beckman Coulter
- Horiba Scientific
- Anton Paar
- Brookhaven Instruments
- Wyatt Technology
- Microtrac MRB
- Particle Sizing Systems
- Cilas Particle Size
- Sympatec GmbH
- Bettersize Instruments
- Cordouan Technologies
Competitive Analysis:
The Dynamic Light Scattering (DLS) Particle Size Analyzer Market features strong competition driven by continuous technological innovation and expanding application requirements. Market leaders focus on high-sensitivity detection, robust system stability, and advanced automation to strengthen product differentiation. It benefits from sustained investment in software capabilities that enhance data accuracy, workflow efficiency, and user accessibility. Established companies expand their global presence through strategic partnerships, distributor networks, and targeted product launches that address emerging research and industrial needs. New entrants emphasize cost-effective solutions and compact instrument designs to capture demand from small laboratories and academic institutions. Competitive pressure intensifies as manufacturers integrate hybrid technologies that combine DLS with complementary measurement methods. The market remains dynamic, with ongoing advancements in nanomaterials, biopharmaceutical development, and quality control driving continuous upgrades across product portfolios.
Recent Developments:
- In July 2024, Malvern Panalytical agreed to acquire Micromeritics Instrument Corporation for $630 million plus up to $53 million deferred, to become a world leader in particle characterization and broaden its material characterization offerings.
- In April 2025, Horiba Scientific launched the Veloci™ A-TEEM BioPharma Analyzer, expanding its instrument offerings for pharmaceutical and biopharma applications.
Report Coverage:
The research report offers an in-depth analysis based on Product Type, Application, End-User and Region. It details leading market players, providing an overview of their business, product offerings, investments, revenue streams, and key applications. Additionally, the report includes insights into the competitive environment, SWOT analysis, current market trends, as well as the primary drivers and constraints. Furthermore, it discusses various factors that have driven market expansion in recent years. The report also explores market dynamics, regulatory scenarios, and technological advancements that are shaping the industry. It assesses the impact of external factors and ITALY economic changes on market growth. Lastly, it provides strategic recommendations for new entrants and established companies to navigate the complexities of the market.
Future Outlook:
- The Dynamic Light Scattering (DLS) Particle Size Analyzer Market will experience sustained demand driven by expanding nanotechnology research across academia and industry.
- Adoption will increase as pharmaceutical companies intensify focus on biologics, gene therapies, and nanoparticle-based formulations.
- Instrument manufacturers will advance automation and digital integration to support faster workflows and high-volume analytical environments.
- Data analytics and AI-enabled interpretation tools will strengthen measurement accuracy and reduce dependency on operator expertise.
- Hybrid systems that combine DLS with complementary optical and scattering techniques will gain higher market penetration.
- Growth in material science and polymer engineering will elevate the need for precise particle size control during product development.
- Emerging countries will expand investments in R&D infrastructure, improving regional accessibility to advanced analytical instruments.
- Regulatory agencies will reinforce requirements for particle characterization in pharmaceuticals and specialty chemicals, increasing reliance on DLS technologies.
- Miniaturized and portable DLS instruments will attract users seeking flexible and cost-effective solutions for routine analysis.
- Collaborations between research institutions and instrument manufacturers will accelerate innovation and broaden the application scope of DLS systems globally.


