CHAPTER NO. 1 : INTRODUCTION 24
1.1.1. Report Description 24
Purpose of the Report 24
USP & Key Offerings 24
1.1.2. Key Benefits for Stakeholders 24
1.1.3. Target Audience 25
1.1.4. Report Scope 25
1.1.5. Regional Scope 26
CHAPTER NO. 2 : EXECUTIVE SUMMARY 27
2.1. Fluid Loss Control Additives Market Snapshot 27
2.1.1. Global Fluid Loss Control Additives Market, 2018 – 2032 (USD Million) 28
CHAPTER NO. 3 : FLUID LOSS CONTROL ADDITIVES MARKET – INDUSTRY ANALYSIS 29
3.1. Introduction 29
3.2. Market Drivers 30
3.2.1. Expansion of unconventional and deepwater drilling operations 30
3.2.2. Increasing focus on operational efficiency and wellbore stability 31
3.3. Market Restraints 32
3.3.1. High costs associated with advanced additive technologies 32
3.4. Market Opportunities 33
3.4.1. Market Opportunity Analysis 33
3.5. Porter’s Five Forces Analysis 34
3.6. Value Chain Analysis 35
3.7. Buying Criteria 36
CHAPTER NO. 4 : ANALYSIS COMPETITIVE LANDSCAPE 37
4.1. Company Market Share Analysis – 2024 37
4.1.1. Global Fluid Loss Control Additives Market: Company Market Share, by Revenue, 2024 37
4.1.2. Global Fluid Loss Control Additives Market: Top 6 Company Market Share, by Revenue, 2024 37
4.1.3. Global Fluid Loss Control Additives Market: Top 3 Company Market Share, by Revenue, 2024 38
4.2. Global Fluid Loss Control Additives Market Company Revenue Market Share, 2024 39
4.3. Company Assessment Metrics, 2023 40
4.3.1. Stars 40
4.3.2. Emerging Leaders 40
4.3.3. Pervasive Players 40
4.3.4. Participants 40
4.4. Start-ups /SMEs Assessment Metrics, 2023 40
4.4.1. Progressive Companies 40
4.4.2. Responsive Companies 40
4.4.3. Dynamic Companies 40
4.4.4. Starting Blocks 40
4.5. Strategic Developments 41
4.5.1. Acquisitions & Mergers 41
New Product Launch 41
Regional Expansion 41
4.6. Key Players Product Matrix 42
CHAPTER NO. 5 : PESTEL & ADJACENT MARKET ANALYSIS 43
5.1. PESTEL 43
5.1.1. Political Factors 43
5.1.2. Economic Factors 43
5.1.3. Social Factors 43
5.1.4. Technological Factors 43
5.1.5. Environmental Factors 43
5.1.6. Legal Factors 43
5.2. Adjacent Market Analysis 43
CHAPTER NO. 6 : FLUID LOSS CONTROL ADDITIVES MARKET – BY TYPE SEGMENT ANALYSIS 44
6.1. Fluid Loss Control Additives Market Overview, by Type Segment 44
6.1.1. Fluid Loss Control Additives Market Revenue Share, By Type, 2023 & 2032 45
6.1.2. Fluid Loss Control Additives Market Attractiveness Analysis, By Type 46
6.1.3. Incremental Revenue Growth Opportunity, by Type, 2024 – 2032 46
6.1.4. Fluid Loss Control Additives Market Revenue, By Type, 2018, 2023, 2027 & 2032 47
6.2. Polymers 48
6.3. Fibers 49
6.4. Non-Polymeric Additives 50
CHAPTER NO. 7 : FLUID LOSS CONTROL ADDITIVES MARKET – BY TECHNOLOGY SEGMENT ANALYSIS 51
7.1. Fluid Loss Control Additives Market Overview, by Technology Segment 51
7.1.1. Fluid Loss Control Additives Market Revenue Share, By Technology, 2023 & 2032 52
7.1.2. Fluid Loss Control Additives Market Attractiveness Analysis, By Technology 53
7.1.3. Incremental Revenue Growth Opportunity, by Technology, 2024 – 2032 53
7.1.4. Fluid Loss Control Additives Market Revenue, By Technology, 2018, 2023, 2027 & 2032 54
7.2. Conventional Additives 55
7.3. Smart Additives 56
7.4. Nano-Additives 57
7.5. Bio-based Additives 58
7.6. Others 59
CHAPTER NO. 8 : FLUID LOSS CONTROL ADDITIVES MARKET – BY END USER SEGMENT ANALYSIS 60
8.1. Fluid Loss Control Additives Market Overview, by End User Segment 60
8.1.1. Fluid Loss Control Additives Market Revenue Share, By End User, 2023 & 2032 61
8.1.2. Fluid Loss Control Additives Market Attractiveness Analysis, By End User 62
8.1.3. Incremental Revenue Growth Opportunity, by End User, 2024 – 2032 62
8.1.4. Fluid Loss Control Additives Market Revenue, By End User, 2018, 2023, 2027 & 2032 63
8.2. Exploration and Production Companies 64
8.3. Service Providers 65
8.4. Drilling Contractors 66
8.5. Oilfield Chemicals Manufacturers 67
8.6. Others 68
CHAPTER NO. 9 : FLUID LOSS CONTROL ADDITIVES MARKET – REGIONAL ANALYSIS 69
9.1. Fluid Loss Control Additives Market Overview, by Regional Segments 69
9.2. Region 70
9.2.1. Global Fluid Loss Control Additives Market Revenue Share, By Region, 2023 & 2032 70
9.2.2. Fluid Loss Control Additives Market Attractiveness Analysis, By Region 71
9.2.3. Incremental Revenue Growth Opportunity, by Region, 2024 – 2032 71
9.2.4. Fluid Loss Control Additives Market Revenue, By Region, 2018, 2023, 2027 & 2032 72
9.2.5. Global Fluid Loss Control Additives Market Revenue, By Region, 2018 – 2023 (USD Million) 73
9.2.6. Global Fluid Loss Control Additives Market Revenue, By Region, 2024 – 2032 (USD Million) 73
9.3. Type 74
9.3.1. Global Fluid Loss Control Additives Market Revenue, By Type, 2018 – 2023 (USD Million) 74
9.3.2. Global Fluid Loss Control Additives Market Revenue, By Type, 2024 – 2032 (USD Million) 74
9.4. Technology 75
9.4.1. Global Fluid Loss Control Additives Market Revenue, By Technology, 2018 – 2023 (USD Million) 75
9.4.2. Global Fluid Loss Control Additives Market Revenue, By Technology, 2024 – 2032 (USD Million) 75
9.5. End User 76
9.5.1. Global Fluid Loss Control Additives Market Revenue, By End User, 2018 – 2023 (USD Million) 76
9.5.2. Global Fluid Loss Control Additives Market Revenue, By End User, 2024 – 2032 (USD Million) 77
CHAPTER NO. 10 : FLUID LOSS CONTROL ADDITIVES MARKET – NORTH AMERICA 78
10.1. North America 78
10.1.1. Key Highlights 78
10.1.2. North America Fluid Loss Control Additives Market Revenue, By Country, 2018 – 2023 (USD Million) 79
10.1.3. North America Fluid Loss Control Additives Market Revenue, By Type, 2018 – 2023 (USD Million) 80
10.1.4. North America Fluid Loss Control Additives Market Revenue, By Technology, 2018 – 2023 (USD Million) 81
10.1.5. North America Fluid Loss Control Additives Market Revenue, By End User, 2018 – 2023 (USD Million) 82
10.2. U.S. 83
10.3. Canada 83
10.4. Mexico 83
CHAPTER NO. 11 : FLUID LOSS CONTROL ADDITIVES MARKET – EUROPE 84
11.1. Europe 84
11.1.1. Key Highlights 84
11.1.2. Europe Fluid Loss Control Additives Market Revenue, By Country, 2018 – 2023 (USD Million) 85
11.1.3. Europe Fluid Loss Control Additives Market Revenue, By Type, 2018 – 2023 (USD Million) 86
11.1.4. Europe Fluid Loss Control Additives Market Revenue, By Technology, 2018 – 2023 (USD Million) 87
11.1.5. Europe Fluid Loss Control Additives Market Revenue, By End User, 2018 – 2023 (USD Million) 88
11.2. UK 89
11.3. France 89
11.4. Germany 89
11.5. Italy 89
11.6. Spain 89
11.7. Russia 89
11.8. Belgium 89
11.9. Netherland 89
11.10. Austria 89
11.11. Sweden 89
11.12. Poland 89
11.13. Denmark 89
11.14. Switzerland 89
11.15. Rest of Europe 89
CHAPTER NO. 12 : FLUID LOSS CONTROL ADDITIVES MARKET – ASIA PACIFIC 90
12.1. Asia Pacific 90
12.1.1. Key Highlights 90
12.1.2. Asia Pacific Fluid Loss Control Additives Market Revenue, By Country, 2018 – 2023 (USD Million) 91
12.1.3. Asia Pacific Fluid Loss Control Additives Market Revenue, By Type, 2018 – 2023 (USD Million) 92
12.1.4. Asia Pacific Fluid Loss Control Additives Market Revenue, By Technology, 2018 – 2023 (USD Million) 93
12.1.5. Asia Pacific Fluid Loss Control Additives Market Revenue, By End User, 2018 – 2023 (USD Million) 94
12.2. China 95
12.3. Japan 95
12.4. South Korea 95
12.5. India 95
12.6. Australia 95
12.7. Thailand 95
12.8. Indonesia 95
12.9. Vietnam 95
12.10. Malaysia 95
12.11. Philippines 95
12.12. Taiwan 95
12.13. Rest of Asia Pacific 95
CHAPTER NO. 13 : FLUID LOSS CONTROL ADDITIVES MARKET – LATIN AMERICA 96
13.1. Latin America 96
13.1.1. Key Highlights 96
13.1.2. Latin America Fluid Loss Control Additives Market Revenue, By Country, 2018 – 2023 (USD Million) 97
13.1.3. Latin America Fluid Loss Control Additives Market Revenue, By Type, 2018 – 2023 (USD Million) 98
13.1.4. Latin America Fluid Loss Control Additives Market Revenue, By Technology, 2018 – 2023 (USD Million) 99
13.1.5. Latin America Fluid Loss Control Additives Market Revenue, By End User, 2018 – 2023 (USD Million) 100
13.2. Brazil 101
13.3. Argentina 101
13.4. Peru 101
13.5. Chile 101
13.6. Colombia 101
13.7. Rest of Latin America 101
CHAPTER NO. 14 : FLUID LOSS CONTROL ADDITIVES MARKET – MIDDLE EAST 102
14.1. Middle East 102
14.1.1. Key Highlights 102
14.1.2. Middle East Fluid Loss Control Additives Market Revenue, By Country, 2018 – 2023 (USD Million) 103
14.1.3. Middle East Fluid Loss Control Additives Market Revenue, By Type, 2018 – 2023 (USD Million) 104
14.1.4. Middle East Fluid Loss Control Additives Market Revenue, By Technology, 2018 – 2023 (USD Million) 105
14.1.5. Middle East Fluid Loss Control Additives Market Revenue, By End User, 2018 – 2023 (USD Million) 106
14.2. UAE 107
14.3. KSA 107
14.4. Israel 107
14.5. Turkey 107
14.6. Iran 107
14.7. Rest of Middle East 107
CHAPTER NO. 15 : FLUID LOSS CONTROL ADDITIVES MARKET – AFRICA 108
15.1. Africa 108
15.1.1. Key Highlights 108
15.1.2. Africa Fluid Loss Control Additives Market Revenue, By Country, 2018 – 2023 (USD Million) 109
15.1.3. Africa Fluid Loss Control Additives Market Revenue, By Type, 2018 – 2023 (USD Million) 110
15.1.4. Africa Fluid Loss Control Additives Market Revenue, By Technology, 2018 – 2023 (USD Million) 111
15.1.5. Africa Fluid Loss Control Additives Market Revenue, By End User, 2018 – 2023 (USD Million) 112
15.2. Egypt 113
15.3. Nigeria 113
15.4. Algeria 113
15.5. Morocco 113
15.6. Rest of Africa 113
CHAPTER NO. 16 : COMPANY PROFILES 114
16.1. Halliburton 114
16.1.1. Company Overview 114
16.1.2. Product Portfolio 114
16.1.3. Swot Analysis 114
16.1.4. Business Strategy 115
16.1.5. Financial Overview 115
16.2. Newpark Resources Inc. 116
16.3. Schlumberger Limited 116
16.4. Solvay 116
16.5. Clariant 116
16.6. BASF SE 116
16.7. Global Drilling Fluids and Chemicals Limited 116
16.8. Company 8 116
16.9. Company 9 116
16.10. Company 10 116
16.11. Company 11 116
16.12. Company 12 116
16.13. Company 13 116
16.14. Company 14 116
List of Figures
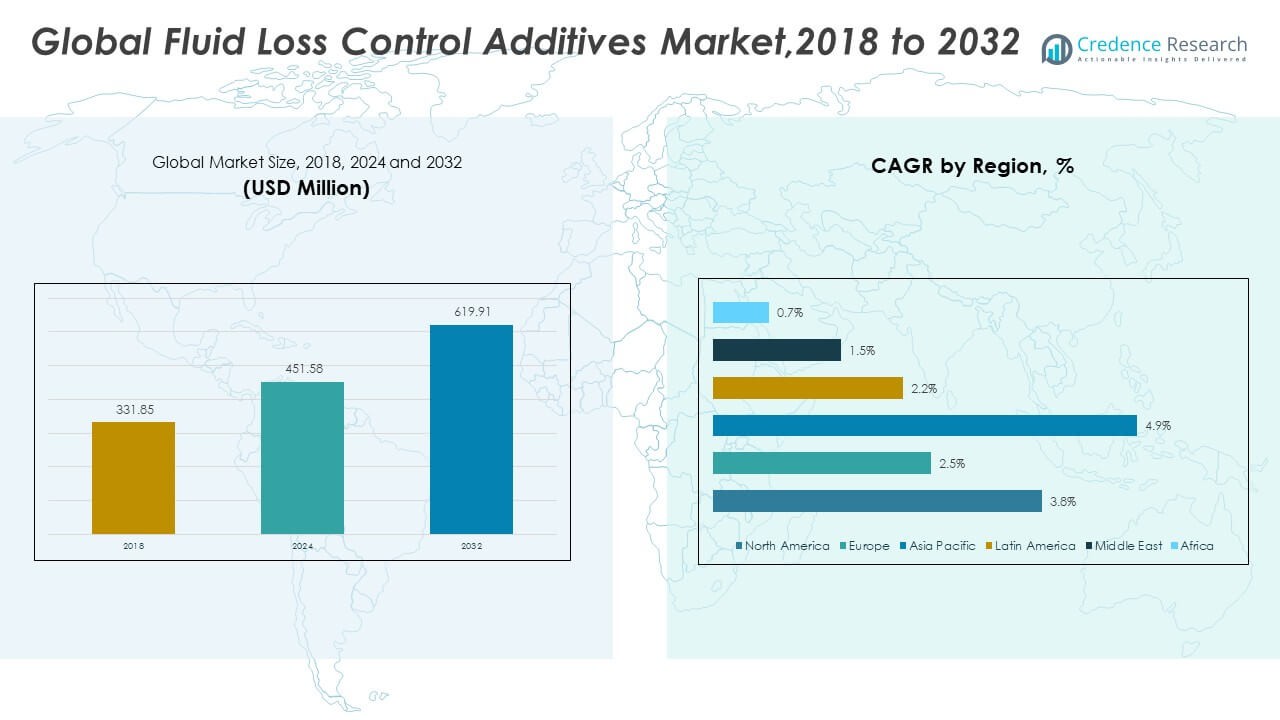
FIG NO. 1. Global Fluid Loss Control Additives Market Revenue, 2018 – 2032 (USD Million) 28
FIG NO. 2. Porter’s Five Forces Analysis for Global Fluid Loss Control Additives Market 34
FIG NO. 3. Value Chain Analysis for Global Fluid Loss Control Additives Market 35
FIG NO. 4. Company Share Analysis, 2024 37
FIG NO. 5. Company Share Analysis, 2024 37
FIG NO. 6. Company Share Analysis, 2024 38
FIG NO. 7. Fluid Loss Control Additives Market – Company Revenue Market Share, 2024 39
FIG NO. 8. Fluid Loss Control Additives Market Revenue Share, By Type, 2023 & 2032 45
FIG NO. 9. Market Attractiveness Analysis, By Type 46
FIG NO. 10. Incremental Revenue Growth Opportunity by Type, 2024 – 2032 46
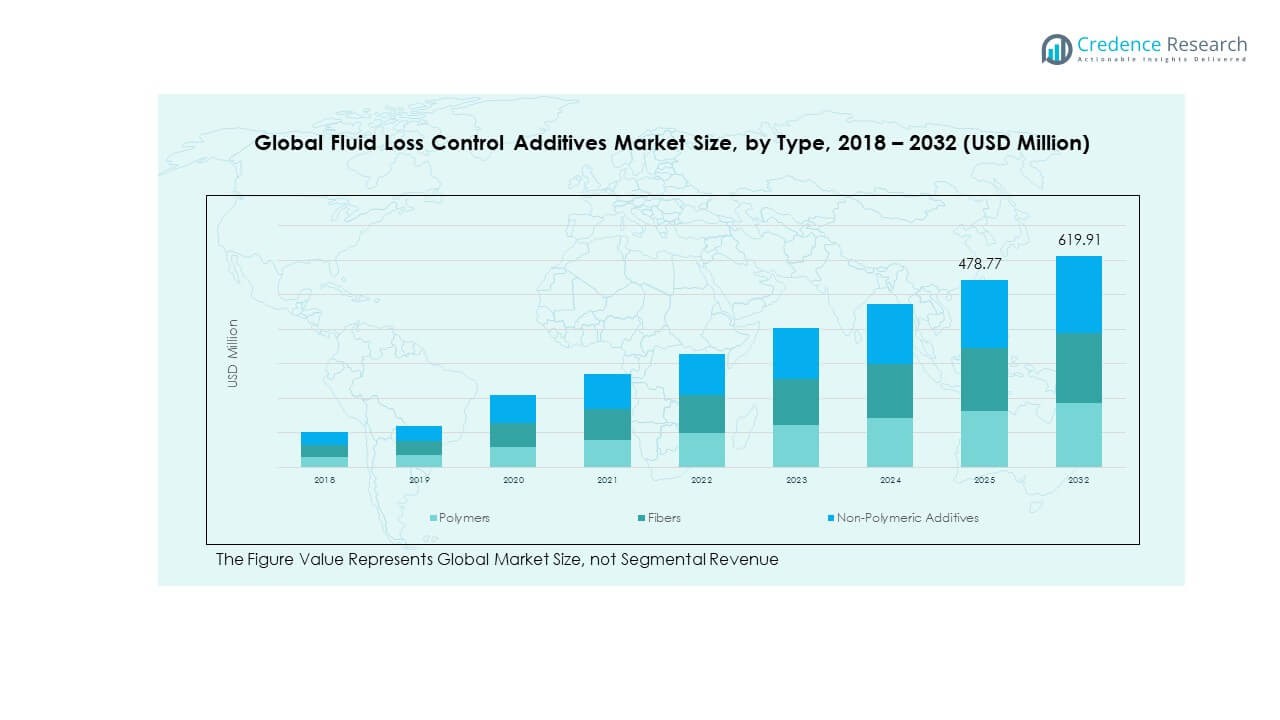
FIG NO. 11. Fluid Loss Control Additives Market Revenue, By Type, 2018, 2023, 2027 & 2032 47
FIG NO. 12. Global Fluid Loss Control Additives Market for Polymers, Revenue (USD Million) 2018 – 2032 48
FIG NO. 13. Global Fluid Loss Control Additives Market for Fibers, Revenue (USD Million) 2018 – 2032 49
FIG NO. 14. Global Fluid Loss Control Additives Market for Non-Polymeric Additives, Revenue (USD Million) 2018 – 2032 50
FIG NO. 15. Fluid Loss Control Additives Market Revenue Share, By Technology, 2023 & 2032 52
FIG NO. 16. Market Attractiveness Analysis, By Technology 53
FIG NO. 17. Incremental Revenue Growth Opportunity by Technology, 2024 – 2032 53
FIG NO. 18. Fluid Loss Control Additives Market Revenue, By Technology, 2018, 2023, 2027 & 2032 54
FIG NO. 19. Global Fluid Loss Control Additives Market for Conventional Additives, Revenue (USD Million) 2018 – 2032 55
FIG NO. 20. Global Fluid Loss Control Additives Market for Smart Additives, Revenue (USD Million) 2018 – 2032 56
FIG NO. 21. Global Fluid Loss Control Additives Market for Nano-Additives, Revenue (USD Million) 2018 – 2032 57
FIG NO. 22. Global Fluid Loss Control Additives Market for Bio-based Additives, Revenue (USD Million) 2018 – 2032 58
FIG NO. 23. Global Fluid Loss Control Additives Market for Others, Revenue (USD Million) 2018 – 2032 59
FIG NO. 24. Fluid Loss Control Additives Market Revenue Share, By End User, 2023 & 2032 61
FIG NO. 25. Market Attractiveness Analysis, By End User 62
FIG NO. 26. Incremental Revenue Growth Opportunity by End User, 2024 – 2032 62
FIG NO. 27. Fluid Loss Control Additives Market Revenue, By End User, 2018, 2023, 2027 & 2032 63
FIG NO. 28. Global Fluid Loss Control Additives Market for Exploration and Production Companies, Revenue (USD Million) 2018 – 2032 64
FIG NO. 29. Global Fluid Loss Control Additives Market for Service Providers, Revenue (USD Million) 2018 – 2032 65
FIG NO. 30. Global Fluid Loss Control Additives Market for Drilling Contractors, Revenue (USD Million) 2018 – 2032 66
FIG NO. 31. Global Fluid Loss Control Additives Market for Oilfield Chemicals Manufacturers, Revenue (USD Million) 2018 – 2032 67
FIG NO. 32. Global Fluid Loss Control Additives Market for Others, Revenue (USD Million) 2018 – 2032 68
FIG NO. 33. Global Fluid Loss Control Additives Market Revenue Share, By Region, 2023 & 2032 70
FIG NO. 34. Market Attractiveness Analysis, By Region 71
FIG NO. 35. Incremental Revenue Growth Opportunity by Region, 2024 – 2032 71
FIG NO. 36. Fluid Loss Control Additives Market Revenue, By Region, 2018, 2023, 2027 & 2032 72
FIG NO. 37. North America Fluid Loss Control Additives Market Revenue, 2018 – 2032 (USD Million) 78
FIG NO. 38. Europe Fluid Loss Control Additives Market Revenue, 2018 – 2032 (USD Million) 84
FIG NO. 39. Asia Pacific Fluid Loss Control Additives Market Revenue, 2018 – 2032 (USD Million) 90
FIG NO. 40. Latin America Fluid Loss Control Additives Market Revenue, 2018 – 2032 (USD Million) 96
FIG NO. 41. Middle East Fluid Loss Control Additives Market Revenue, 2018 – 2032 (USD Million) 102
FIG NO. 42. Africa Fluid Loss Control Additives Market Revenue, 2018 – 2032 (USD Million) 108
List of Tables
TABLE NO. 1. : Global Fluid Loss Control Additives Market: Snapshot 27
TABLE NO. 2. : Drivers for the Fluid Loss Control Additives Market: Impact Analysis 30
TABLE NO. 3. : Restraints for the Fluid Loss Control Additives Market: Impact Analysis 32
TABLE NO. 4. : Global Fluid Loss Control Additives Market Revenue, By Region, 2018 – 2023 (USD Million) 73
TABLE NO. 5. : Global Fluid Loss Control Additives Market Revenue, By Region, 2024 – 2032 (USD Million) 73
TABLE NO. 6. : Global Fluid Loss Control Additives Market Revenue, By Type, 2018 – 2023 (USD Million) 74
TABLE NO. 7. : Global Fluid Loss Control Additives Market Revenue, By Type, 2024 – 2032 (USD Million) 74
TABLE NO. 8. : Global Fluid Loss Control Additives Market Revenue, By Technology, 2018 – 2023 (USD Million) 75
TABLE NO. 9. : Global Fluid Loss Control Additives Market Revenue, By Technology, 2024 – 2032 (USD Million) 75
TABLE NO. 10. : Global Fluid Loss Control Additives Market Revenue, By End User, 2018 – 2023 (USD Million) 76
TABLE NO. 11. : Global Fluid Loss Control Additives Market Revenue, By End User, 2024 – 2032 (USD Million) 77
TABLE NO. 12. : North America Fluid Loss Control Additives Market Revenue, By Country, 2018 – 2023 (USD Million) 79
TABLE NO. 13. : North America Fluid Loss Control Additives Market Revenue, By Country, 2024 – 2032 (USD Million) 79
TABLE NO. 14. : North America Fluid Loss Control Additives Market Revenue, By Type, 2018 – 2023 (USD Million) 80
TABLE NO. 15. : North America Fluid Loss Control Additives Market Revenue, By Type, 2024 – 2032 (USD Million) 80
TABLE NO. 16. : North America Fluid Loss Control Additives Market Revenue, By Technology, 2018 – 2023 (USD Million) 81
TABLE NO. 17. : North America Fluid Loss Control Additives Market Revenue, By Technology, 2024 – 2032 (USD Million) 81
TABLE NO. 18. : North America Fluid Loss Control Additives Market Revenue, By End User, 2018 – 2023 (USD Million) 82
TABLE NO. 19. : North America Fluid Loss Control Additives Market Revenue, By End User, 2024 – 2032 (USD Million) 82
TABLE NO. 20. : Europe Fluid Loss Control Additives Market Revenue, By Country, 2018 – 2023 (USD Million) 85
TABLE NO. 21. : Europe Fluid Loss Control Additives Market Revenue, By Country, 2024 – 2032 (USD Million) 85
TABLE NO. 22. : Europe Fluid Loss Control Additives Market Revenue, By Type, 2018 – 2023 (USD Million) 86
TABLE NO. 23. : Europe Fluid Loss Control Additives Market Revenue, By Type, 2024 – 2032 (USD Million) 86
TABLE NO. 24. : Europe Fluid Loss Control Additives Market Revenue, By Technology, 2018 – 2023 (USD Million) 87
TABLE NO. 25. : Europe Fluid Loss Control Additives Market Revenue, By Technology, 2024 – 2032 (USD Million) 87
TABLE NO. 26. : Europe Fluid Loss Control Additives Market Revenue, By End User, 2018 – 2023 (USD Million) 88
TABLE NO. 27. : Europe Fluid Loss Control Additives Market Revenue, By End User, 2024 – 2032 (USD Million) 88
TABLE NO. 28. : Asia Pacific Fluid Loss Control Additives Market Revenue, By Country, 2018 – 2023 (USD Million) 91
TABLE NO. 29. : Asia Pacific Fluid Loss Control Additives Market Revenue, By Country, 2024 – 2032 (USD Million) 91
TABLE NO. 30. : Asia Pacific Fluid Loss Control Additives Market Revenue, By Type, 2018 – 2023 (USD Million) 92
TABLE NO. 31. : Asia Pacific Fluid Loss Control Additives Market Revenue, By Type, 2024 – 2032 (USD Million) 92
TABLE NO. 32. : Asia Pacific Fluid Loss Control Additives Market Revenue, By Technology, 2018 – 2023 (USD Million) 93
TABLE NO. 33. : Asia Pacific Fluid Loss Control Additives Market Revenue, By Technology, 2024 – 2032 (USD Million) 93
TABLE NO. 34. : Asia Pacific Fluid Loss Control Additives Market Revenue, By End User, 2018 – 2023 (USD Million) 94
TABLE NO. 35. : Asia Pacific Fluid Loss Control Additives Market Revenue, By End User, 2024 – 2032 (USD Million) 94
TABLE NO. 36. : Latin America Fluid Loss Control Additives Market Revenue, By Country, 2018 – 2023 (USD Million) 97
TABLE NO. 37. : Latin America Fluid Loss Control Additives Market Revenue, By Country, 2024 – 2032 (USD Million) 97
TABLE NO. 38. : Latin America Fluid Loss Control Additives Market Revenue, By Type, 2018 – 2023 (USD Million) 98
TABLE NO. 39. : Latin America Fluid Loss Control Additives Market Revenue, By Type, 2024 – 2032 (USD Million) 98
TABLE NO. 40. : Latin America Fluid Loss Control Additives Market Revenue, By Technology, 2018 – 2023 (USD Million) 99
TABLE NO. 41. : Latin America Fluid Loss Control Additives Market Revenue, By Technology, 2024 – 2032 (USD Million) 99
TABLE NO. 42. : Latin America Fluid Loss Control Additives Market Revenue, By End User, 2018 – 2023 (USD Million) 100
TABLE NO. 43. : Latin America Fluid Loss Control Additives Market Revenue, By End User, 2024 – 2032 (USD Million) 100
TABLE NO. 44. : Middle East Fluid Loss Control Additives Market Revenue, By Country, 2018 – 2023 (USD Million) 103
TABLE NO. 45. : Middle East Fluid Loss Control Additives Market Revenue, By Country, 2024 – 2032 (USD Million) 103
TABLE NO. 46. : Middle East Fluid Loss Control Additives Market Revenue, By Type, 2018 – 2023 (USD Million) 104
TABLE NO. 47. : Middle East Fluid Loss Control Additives Market Revenue, By Type, 2024 – 2032 (USD Million) 104
TABLE NO. 48. : Middle East Fluid Loss Control Additives Market Revenue, By Technology, 2018 – 2023 (USD Million) 105
TABLE NO. 49. : Middle East Fluid Loss Control Additives Market Revenue, By Technology, 2024 – 2032 (USD Million) 105
TABLE NO. 50. : Middle East Fluid Loss Control Additives Market Revenue, By End User, 2018 – 2023 (USD Million) 106
TABLE NO. 51. : Middle East Fluid Loss Control Additives Market Revenue, By End User, 2024 – 2032 (USD Million) 106
TABLE NO. 52. : Africa Fluid Loss Control Additives Market Revenue, By Country, 2018 – 2023 (USD Million) 109
TABLE NO. 53. : Africa Fluid Loss Control Additives Market Revenue, By Country, 2024 – 2032 (USD Million) 109
TABLE NO. 54. : Africa Fluid Loss Control Additives Market Revenue, By Type, 2018 – 2023 (USD Million) 110
TABLE NO. 55. : Africa Fluid Loss Control Additives Market Revenue, By Type, 2024 – 2032 (USD Million) 110
TABLE NO. 56. : Africa Fluid Loss Control Additives Market Revenue, By Technology, 2018 – 2023 (USD Million) 111
TABLE NO. 57. : Africa Fluid Loss Control Additives Market Revenue, By Technology, 2024 – 2032 (USD Million) 111
TABLE NO. 58. : Africa Fluid Loss Control Additives Market Revenue, By End User, 2018 – 2023 (USD Million) 112
TABLE NO. 59. : Africa Fluid Loss Control Additives Market Revenue, By End User, 2024 – 2032 (USD Million) 112