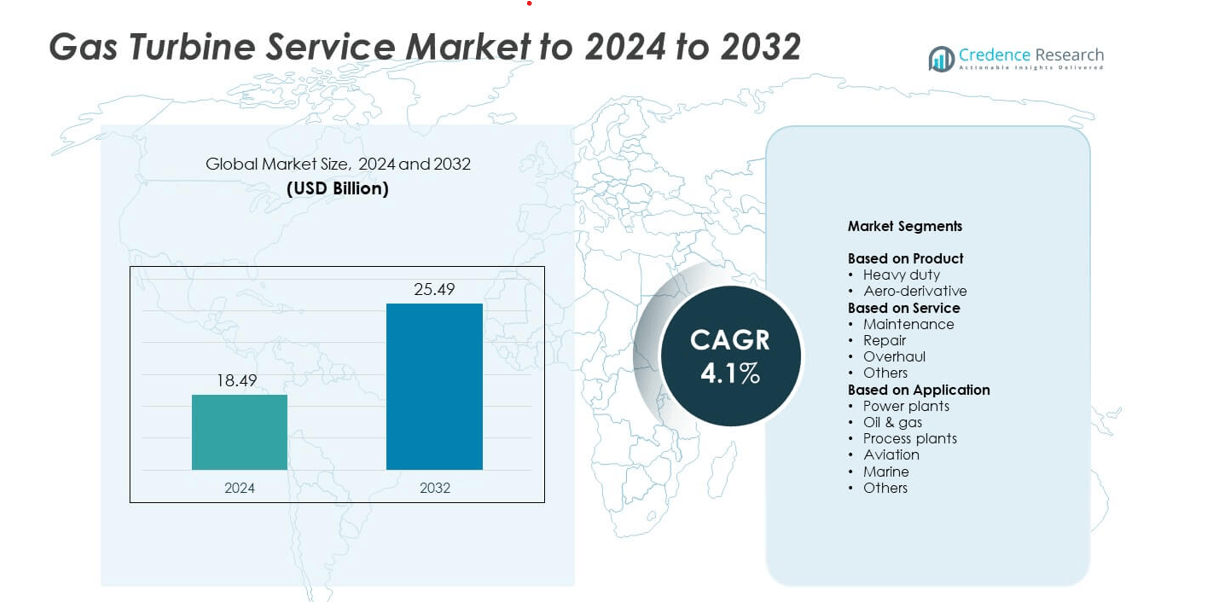
Home » Biotechnology » Gas Turbine Services Market

Gas Turbine Services Market By Type (Heavy Duty, Industrial, Aeroderivative) By Service (Maintenance & Repair, Overhaul, Spare Parts Supply) By End-Use (Power Generation, Oil & Gas, Others) – Growth, Future Prospects & Competitive Analysis, 2016 – 2028

Price: $4999

Published: | Report ID: 6258 | Report Format : PDF

About this report

The global gas turbine services market report explores the critical analysis of the gas turbine service industry using key parameters. The report consists of investment strategies, the need for investments in the gas turbine services industry, and the multiple benefits for investors. Importantly, this report sets out major changes in the global technical regulations for the gas turbine services industry and how economic and non-economic barriers are helping the market grow. Moreover, the report analyzes the global, regional, and country-level historic and forecasted market sizes. The report also provides a comprehensive analysis of key investment propositions, the demand and supply gap, competitor positioning, STAR analysis, SRC analysis, and Tornado analysis. Key technological developments and other analyses include Porter’s five forces analysis, PESTEL analysis, value chain analysis, etc.

REPORT ATTRIBUTE DETAILS
Gas Turbine Services Market by Volume Yes
Market by Value Yes
Market, Tornado Analysis Yes
Market, STAR Analysis Yes
Market, SRC Analysis Yes
Market, Import-Export Data Yes (On Demand)
Market Pricing Analysis Yes (On Demand)
Market Segment Analysis By Type (Heavy Duty, Industrial, and Aeroderivative)

By Service (Maintenance & Repair, Overhaul, and Spare Parts Supply)

By End-Use (Power Generation, Oil & Gas, and Others)

Market, Regional Analysis North America (the US and Canada)

Europe (Germany, UK, France, Italy, Spain, and the Rest of Europe)

Asia Pacific (China, India, Japan, South Korea, South East Asia, and the Rest of Asia Pacific)

Latin America (Brazil, Mexico, and the Rest of Latin America)

Middle East and Africa (GCC Countries, South Africa, and the Rest of the Middle East and Africa)

Market Key Companies MAN SE (Germany), EthosEnergy (US), Proenergy Services (US), Caterpillar (US), MJB International Limited LLC (UAE), Ansaldo Energia (Italy), Sulzer Ltd (Switzerland), Mitsubishi Heavy Industries Ltd (Japan), BHI Energy (UK), General Electric (US), Siemens (Germany), and MTU Aero Engines (Germany)
Market Competitive Landscape Market Share Analysis

Competitive Benchmarking

Key Players Market Positioning

Geographical Presence Analysis

Major Strategies Adopted

Key Highlights of the Report

How are the major segments performing in the gas turbine services market?

  • The heavy-duty type segment led the global market in 2021 and is expected to continue during the projection period. The broad range of uses for these turbines in petrochemical industries, refineries, and power utilities is primarily responsible for the segment’s growth. In addition, heavy-duty turbines offer improved thermodynamic cycles and a more efficient manufacturing process.
  • In 2021, the spare parts supply service segment held the largest global market share. The gas turbine components have a specific lifespan, which requires periodic replacement, thereby driving the segment’s growth.
  • The power generation segment at the end-user dominated the global gas turbine services market in 2021 due to strict energy productivity regulations that have made it difficult for businesses to implement viable power-generating frameworks in line with governmental reforms to reduce emissions. The global expansion of manufacturing and processing plants will drive market growth.
Design Element 2

Access crucial information at unmatched prices!

Request your free sample report today & start making informed decisions powered by Credence Research!

Download Free Sample
CTA Design Element 3

Which region dominated the gas turbine services market?

Asia Pacific dominated the global gas turbine services market in 2021 and is presumed to maintain its dominance by 2028. Demand for gas turbine services in China, India, and other developing Asian countries is driving regional market demand due to rapid urbanization and an expanding middle-class population. Additionally, the growing need for clean energy sources for power generation in these nations is anticipated to fuel regional market expansion. Transitioning from coal-based power generation to clean energy sources will propel market growth. Rapid urbanization and industrialization will promote industry penetration and government targets to reduce GHG emissions. Rapid economic growth and rising energy demand will increase market revenue, particularly in developing countries.

How is the US market performing in the gas turbine services market?

The United States dominated the North American gas turbine services market in 2021. Shale gas reserves and developments in mining and extraction technology, which consistently help lower the operational cost of extraction, are the main factors driving the market. The U.S. has an established natural gas infrastructure and several key end-use industries, which are the main sources of demand for gas turbine services in the nation. The Energy Information Administration reports that in 2018, natural gas surpassed coal as the most popular fuel for electricity in the United States. The demand for gas turbine services for mechanical drive applications in the process industry will also propel the market for gas turbine services in the United States.

What is the competitive environment of the gas turbine services market?

The major players in the gas turbine services market employ strategies like offering long-term maintenance agreements to owners of both new and existing power plants to strengthen their market positions. Key vendors compete based on the effectiveness and performance of the gas turbines they manufacture and the related services they offer to their clients. With the rapid advancement of technology and fierce competition, a company’s technological capability and R&D efforts are among its top priorities for improving its position in the market. OEMs dominate the market due to their extensive experience providing power generation services and well-structured data management techniques. Besides, OEMs are offering upgrades to existing gas turbines through service contracts to existing customers. For instance, General Electric introduced a new 6B repowering upgrade for turbines in September 2018 that can improve combined-cycle and gas turbine performance. This advancement will enable General Electric to increase its global market share further.

Executive Summary

What are the technical developments being developed in the global gas turbine services market?

Technology expertise and research and development are crucial areas for organizations to improve their market position due to rapidly evolving technology and intense competition. The industry outlook will be boosted by ongoing technological advancements that result in the design and development of extremely efficient gas turbine units. In addition, the market expansion will be positively influenced by modern overhauling technologies combined with an abundant natural gas supply. The increased environmental concern caused by the high carbon emissions from coal-based power generation has resulted in the adoption of low-carbon emission power generation technologies. This eventually leads to an increase in demand for these gas turbine services on a global scale. With the development of E, F, and H-class technology, companies in the sector are providing cutting-edge services to meet the upcoming demands of power plant operators.

Which are the key investments by the gas turbine services market players?

The companies use investment strategies to improve their market share, such as providing long-term service agreements to owners of both new and existing power plants. Competition among major vendors is driven by the efficiency and performance of their manufactured gas turbines and the associated services they provide their customers. For instance, General Electric (US) invested in and established a new business unit in May 2018 for servicing and upgrading other gas turbine equipment manufacturers. The offerings include improved cooling for turbine and combustion parts, proprietary alloys, and highly developed thermal barrier coatings. Likewise, in October 2019, GE Power upgraded two GE 13E2 gas turbines to improve operational performance and efficiency at ADNOC Refining’s Ruwais General Utilities Plant.

Some major players in the gas turbine services market are MAN SE (Germany), EthosEnergy (US), Proenergy Services (US), Caterpillar (US), MJB International Limited LLC (UAE), Ansaldo Energia (Italy), Sulzer Ltd (Switzerland), Mitsubishi Heavy Industries Ltd (Japan), BHI Energy (UK), General Electric (US), Siemens (Germany), and MTU Aero Engines (Germany).

What are the major driving factors for the gas turbine services market?

A gas turbine is a natural gas-powered combustion engine that converts the chemical energy produced by natural gas combustion into mechanical energy. This mechanical energy is then used to generate electrical energy. Gas turbine services refer to the procedures carried out on these gas turbines to keep them in working order. Government regulations requiring clean power generation and implementing pollution control technologies are anticipated to fuel market expansion. The continuous technological development that leads to the design and development of extremely efficient gas turbine units will, in turn, boost the industry’s outlook. Moreover, advanced overhauling technologies and abundant natural gas availability will positively impact market expansion.

What are the major risks for the gas turbine services market?

Global demand for gas turbine services is constrained by stringent government emission regulations, as well as high labor costs, exorbitant gas turbine spare part costs, and difficult transportation logistics. The increased effectiveness of renewable-based power generation on the global market is another factor limiting the market’s growth.

Which is the key type in the gas turbine services market?

The heavy-duty segment is expected to maintain its dominance during the forecast period due to rising concerns over plant optimization and flexibility. The wide range of applications for these turbines in petrochemical industries, refineries, and power utilities is primarily responsible for the segment’s expansion. Heavy-duty turbines also provide better thermodynamic cycles and a more effective manufacturing process. Technological advances have also improved these turbines’ power output, efficiency, and environmental compatibility. For effective and secure operations management, this technology requires maintenance and service. Moreover, prompt service offers effective torque control and the potential for integrated and intelligent control and operation concepts. Increasing peak load operation while lowering turbine inlet temperature during open-cycle power plant operations will boost market growth.

How is the gas turbine services market performing in different regions?

Asia Pacific will retain the largest gas turbine services market throughout the forecast period. Gas turbine installation capacity is rising due to the greater availability of natural gas in the Asia Pacific region, particularly in nations like China, which is helping the market grow. The rising population, rapid urbanization, and the implementation of government initiatives aimed at decarbonizing the region’s economies are expected to impact the gas turbine services market positively. Gas turbine technology advancements and the strong presence of regional market players are expected to boost the market during the forecast period.

Furthermore, North America is expected to have a significant revenue share in the global gas turbine services market in the coming years. The availability of abundant and affordable natural gas and a shift toward clean energy generation will improve the market outlook. The government’s strict emission standards for gas turbines, combined with the rapid upgrade of the gas turbine fleet, will energize the industry. The ongoing evolution of shale gas will fuel the installation of gas turbine units, favoring regional market expansion. The region’s market for gas turbine service is anticipated to grow in the coming years due to factors like upcoming gas-based power plants like the Cascade Combined-Cycle Gas Turbine (CCGT) Power Plant in Alberta and South Field Energy’s Combined-Cycle Power Plant in Ohio.

What is the regulatory landscape for the gas turbine services market?

One of the most significant factors driving up demand for gas turbines for power generation is the increasing tendency of governments worldwide to reduce the use of coal-based power plants and lower carbon emissions. The strengthening of regulatory protocols, combined with rapid technological advancements to meet the needs of a large consumer base while maintaining reliability and efficiency, will drive demand for efficient gas turbine units even further. Government regulations to address resource depletion increased harmful emissions, and climate change mitigation is a significant trend that positively affects the gas turbine services market.

What is the market size of gas turbine services in terms of value?

The global gas turbine services market is anticipated to grow at a substantial CAGR of 9.5% in the upcoming years. The global gas turbine services industry is estimated to be worth USD 27.1 billion in 2021 and is expected to be worth USD 46.71 billion by 2028.

Shape Your Report to Specific Countries or Regions & Enjoy 30% Off!

What are the major players planning for the future of the gas turbine services market?

Services for continuous turbines Key-player innovations and collaborations will boost business dynamics. Besides, growth ventures, strategic partnerships, and new technologically advanced services will propel the companies forward. Market participants provide improved services such as overhaul, repair, and scheduling. Unscheduled maintenance services, among others, satisfy the needs of aero-derivative gas turbine customers, favoring the market most likely over the forecast period. Leading players are attempting to break into markets in developing economies. They are increasing their market share through various strategies such as acquiring service contracts and agreements, mergers, and acquisitions. Plant operators view multiyear agreements as a cost-effective long-term solution. These contracts can be executed for various services, such as fundamental or comprehensive maintenance. Basic maintenance entails everything from preventive to full-service care, whereas overall maintenance includes repairs for the affected equipment.

Segmentation of Global Gas Turbine Services Market –

Global Gas Turbine Services Market – By Type

  • Heavy Duty
  • Industrial
  • Aeroderivative

Global Gas Turbine Services Market – By Service

  • Maintenance & Repair
  • Overhaul
  • Spare Parts Supply

Global Gas Turbine Services Market – By End-Use

  • Power Generation
  • Oil & Gas
  • Others

Global Gas Turbine Services Market – By Region

  • North America
    • US
    • Canada
  • Europe
    • Germany
    • France
    • UK.
    • Italy
    • Spain
    • Rest of Europe
  • Asia Pacific
    • China
    • Japan
    • India
    • South Korea
    • South-east Asia
    • Rest of Asia Pacific
  • Latin America
    • Brazil
    • Mexico
    • Rest of Latin America
  • Middle East & Africa
    • GCC Countries
    • South Africa
    • Rest of the Middle East and Africa

1. Preface
1.1. Report Description
1.1.1. Purpose of the Report
1.1.2. Target Audience
1.1.3. USP and Key Offerings
1.2. Research Scope
1.3. Research Methodology
1.3.1. Phase I – Secondary Research
1.3.2. Phase II – Primary Research
1.3.3. Phase III – Expert Panel Review
1.3.4. Approach Adopted
1.3.4.1. Top-Down Approach
1.3.4.2. Bottom-Up Approach
1.3.5. Assumptions
1.4. Market Segmentation

2. Executive Summary
2.1. Market Snapshot: Global Gas Turbine Services Market
2.2. Global Gas Turbine Services Market, By Type
2.3. Global Gas Turbine Services Market, By Service
2.4. Global Gas Turbine Services Market, By End-Use
2.5. Global Gas Turbine Services Market, By Region

3. Market Dynamics & Factors Analysis
3.1. Introduction
3.1.1. Global Gas Turbine Services Market Value, 2016-2028, (US$ Bn)
3.2. Market Dynamics
3.2.1. Key Growth Trends
3.2.2. Market Drivers
3.2.3. Market Restraints
3.2.4. Market Opportunities
3.2.5. Major Industry Challenges
3.3. Attractive Investment Proposition,2021
3.3.1. Type
3.3.2. Service
3.3.3. End-Use
3.3.4. Geography

4. Premium Insights
4.1. STAR (Situation, Task, Action, Results) Analysis
4.2. Porter’s Five Forces Analysis
4.2.1. Threat of New Entrants
4.2.2. Bargaining Power of Buyers/Consumers
4.2.3. Bargaining Power of Suppliers
4.2.4. Threat of Substitute Types
4.2.5. Intensity of Competitive Rivalry
4.3. Value Chain Analysis
4.4. Technology Analysis
4.5. Marketing Strategy Analysis
4.5.1. Direct Marketing
4.5.2. Indirect Marketing
4.5.3. Marketing Channel Development Trend

5. Market Positioning of Key Players, 2021
5.1. Company Market Share of Key Players, 2021
5.2. Competitive Benchmarking
5.3. Market Positioning of Key Vendors
5.4. Geographical Presence Analysis
5.5. Major Strategies Adopted by Key Players
5.5.1. Key Strategies Analysis
5.5.2. Mergers and Acquisitions
5.5.3. Partnerships
5.5.4. Product Launch
5.5.5. Geographical Expansion
5.5.6. Others

6. COVID-19 Impact Analysis
6.1. Global Gas Turbine Services Market Pre Vs Post COVID-19, 2019 – 2028
6.2. Impact on Import & Export
6.3. Impact on Demand & Supply

7. Global Gas Turbine Services Market
7.1. Global Gas Turbine Services Market, by Type, 2016-2028(US$ Bn)
7.1.1. Overview
7.1.2. Global Gas Turbine Services Market, By Type, 2021 vs 2028 (in%)
7.1.3. Global Gas Turbine Services Market, By Heavy Duty, 2016-2028 (US$ Bn)
7.1.4. Global Gas Turbine Services Market, By Industrial, 2016-2028 (US$ Bn)
7.1.5. Global Gas Turbine Services Market, By Aeroderivative, 2016-2028 (US$ Bn)
7.2. Global Gas Turbine Services Market, by Service, 2016-2028(US$ Bn)
7.2.1. Overview
7.2.2. Global Gas Turbine Services Market, By Service, 2021 vs 2028 (in%)
7.2.3. Global Gas Turbine Services Market, By Maintenance & Repair, 2016-2028 (US$ Bn)
7.2.4. Global Gas Turbine Services Market, By Overhaul, 2016-2028 (US$ Bn)
7.2.5. Global Gas Turbine Services Market, By Spare Parts Supply, 2016-2028 (US$ Bn)
7.3. Global Gas Turbine Services Market, by End-Use, 2016-2028(US$ Bn)
7.3.1. Overview
7.3.2. Global Gas Turbine Services Market, By End-Use, 2021 vs 2028 (in%)
7.3.3. Global Gas Turbine Services Market, By Power Generation, 2016-2028 (US$ Bn)
7.3.4. Global Gas Turbine Services Market, By Oil & Gas, 2016-2028 (US$ Bn)
7.3.5. Global Gas Turbine Services Market, By Others, 2016-2028 (US$ Bn)

8. North America Gas Turbine Services Market Analysis
8.1. North America Gas Turbine Services Market, by Type, 2016-2028(US$ Bn)
8.1.1. Overview
8.1.2. SRC Analysis
8.2. North America Gas Turbine Services Market, by Service, 2016-2028(US$ Bn)
8.2.1. Overview
8.2.2. SRC Analysis
8.3. North America Gas Turbine Services Market, by End-Use, 2016-2028(US$ Bn)
8.3.1. Overview
8.3.2. SRC Analysis
8.4. North America Gas Turbine Services Market, by Country, 2016-2028 (US$ Bn)
8.4.1. U.S.
8.4.1.1. U.S. Gas Turbine Services Market Estimates and Forecast, 2016-2028 (US$ Bn)
8.4.1.2. U.S. Gas Turbine Services, By Type, 2016-2028 (US$ Bn)
8.4.1.3. U.S. Gas Turbine Services, By Service, 2016-2028 (US$ Bn)
8.4.1.4. U.S. Gas Turbine Services, By End-Use, 2016-2028 (US$ Bn)
8.4.2. Canada
8.4.2.1. Canada Gas Turbine Services Market Estimates and Forecast, 2016-2028 (US$ Bn)
8.4.2.2. Canada Gas Turbine Services, By Type, 2016-2028 (US$ Bn)
8.4.2.3. Canada Gas Turbine Services, By Service, 2016-2028 (US$ Bn)
8.4.2.4. Canada Gas Turbine Services, By End-Use, 2016-2028 (US$ Bn)

9. Europe Gas Turbine Services Market Analysis
9.1. Europe Gas Turbine Services Market, by Type, 2016-2028(US$ Bn)
9.1.1. Overview
9.1.2. SRC Analysis
9.2. Europe Gas Turbine Services Market, by Service, 2016-2028(US$ Bn)
9.2.1. Overview
9.2.2. SRC Analysis
9.3. Europe Gas Turbine Services Market, by End-Use, 2016-2028(US$ Bn)
9.3.1. Overview
9.3.2. SRC Analysis
9.4. Europe Gas Turbine Services Market, by Country, 2016-2028 (US$ Bn)
9.4.1. Germany
9.4.1.1. Germany Gas Turbine Services Market Estimates and Forecast, 2016-2028 (US$ Bn)
9.4.1.2. Germany Gas Turbine Services, By Type, 2016-2028 (US$ Bn)
9.4.1.3. Germany Gas Turbine Services, By Service, 2016-2028 (US$ Bn)
9.4.1.4. Germany Gas Turbine Services, By End-Use, 2016-2028 (US$ Bn)
9.4.2. France
9.4.2.1. France Gas Turbine Services Market Estimates and Forecast, 2016-2028 (US$ Bn)
9.4.2.2. France Gas Turbine Services, By Type, 2016-2028 (US$ Bn)
9.4.2.3. France Gas Turbine Services, By Service, 2016-2028 (US$ Bn)
9.4.2.4. France Gas Turbine Services, By End-Use, 2016-2028 (US$ Bn)
9.4.3. UK
9.4.3.1. UK Gas Turbine Services Market Estimates and Forecast, 2016-2028 (US$ Bn)
9.4.3.2. UK Gas Turbine Services, By Type, 2016-2028 (US$ Bn)
9.4.3.3. UK Gas Turbine Services, By Service, 2016-2028 (US$ Bn)
9.4.3.4. UK Gas Turbine Services, By End-Use, 2016-2028 (US$ Bn)
9.4.4. Italy
9.4.4.1. Italy Gas Turbine Services Market Estimates and Forecast, 2016-2028 (US$ Bn)
9.4.4.2. Italy Gas Turbine Services, By Type, 2016-2028 (US$ Bn)
9.4.4.3. Italy Gas Turbine Services, By Service, 2016-2028 (US$ Bn)
9.4.4.4. Italy Gas Turbine Services, By End-Use, 2016-2028 (US$ Bn)
9.4.5. Spain
9.4.5.1. Spain Gas Turbine Services Market Estimates and Forecast, 2016-2028 (US$ Bn)
9.4.5.2. Spain Gas Turbine Services, By Type, 2016-2028 (US$ Bn)
9.4.5.3. Spain Gas Turbine Services, By Service, 2016-2028 (US$ Bn)
9.4.5.4. Spain Gas Turbine Services, By End-Use, 2016-2028 (US$ Bn)
9.4.6. Rest of Europe
9.4.6.1. Rest of Europe Gas Turbine Services Market Estimates and Forecast, 2016-2028 (US$ Bn)
9.4.6.2. Rest of Europe Gas Turbine Services, By Type, 2016-2028 (US$ Bn)
9.4.6.3. Rest of Europe Gas Turbine Services, By Service, 2016-2028 (US$ Bn)
9.4.6.4. Rest of Europe Gas Turbine Services, By End-Use, 2016-2028 (US$ Bn)

10. Asia Pacific Gas Turbine Services Market Analysis
10.1. Asia Pacific Gas Turbine Services Market, by Type, 2016-2028(US$ Bn)
10.1.1. Overview
10.1.2. SRC Analysis
10.2. Asia Pacific Gas Turbine Services Market, by Service, 2016-2028(US$ Bn)
10.2.1. Overview
10.2.2. SRC Analysis
10.3. Asia Pacific Gas Turbine Services Market, by End-Use, 2016-2028(US$ Bn)
10.3.1. Overview
10.3.2. SRC Analysis
10.4. Asia Pacific Gas Turbine Services Market, by Country, 2016-2028 (US$ Bn)
10.4.1. China
10.4.1.1. China Gas Turbine Services Market Estimates and Forecast, 2016-2028 (US$ Bn)
10.4.1.2. China Gas Turbine Services, By Type, 2016-2028 (US$ Bn)
10.4.1.3. China Gas Turbine Services, By Service, 2016-2028 (US$ Bn)
10.4.1.4. China Gas Turbine Services, By End-Use, 2016-2028 (US$ Bn)
10.4.2. Japan
10.4.2.1. Japan Gas Turbine Services Market Estimates and Forecast, 2016-2028 (US$ Bn)
10.4.2.2. Japan Gas Turbine Services, By Type, 2016-2028 (US$ Bn)
10.4.2.3. Japan Gas Turbine Services, By Service, 2016-2028 (US$ Bn)
10.4.2.4. Japan Gas Turbine Services, By End-Use, 2016-2028 (US$ Bn)
10.4.3. India
10.4.3.1. India Gas Turbine Services Market Estimates and Forecast, 2016-2028 (US$ Bn)
10.4.3.2. India Gas Turbine Services, By Type, 2016-2028 (US$ Bn)
10.4.3.3. India Gas Turbine Services, By Service, 2016-2028 (US$ Bn)
10.4.3.4. India Gas Turbine Services, By End-Use, 2016-2028 (US$ Bn)
10.4.4. South Korea
10.4.4.1. South Korea Gas Turbine Services Market Estimates and Forecast, 2016-2028 (US$ Bn)
10.4.4.2. South Korea Gas Turbine Services, By Type, 2016-2028 (US$ Bn)
10.4.4.3. South Korea Gas Turbine Services, By Service, 2016-2028 (US$ Bn)
10.4.4.4. South Korea Gas Turbine Services, By End-Use, 2016-2028 (US$ Bn)
10.4.5. South-East Asia
10.4.5.1. South-East Asia Gas Turbine Services Market Estimates and Forecast, 2016-2028 (US$ Bn)
10.4.5.2. South-East Asia Gas Turbine Services, By Type, 2016-2028 (US$ Bn)
10.4.5.3. South-East Asia Gas Turbine Services, By Service, 2016-2028 (US$ Bn)
10.4.5.4. South-East Asia Gas Turbine Services, By End-Use, 2016-2028 (US$ Bn)
10.4.6. Rest of Asia Pacific
10.4.6.1. Rest of Asia Pacific Gas Turbine Services Market Estimates and Forecast, 2016-2028 (US$ Bn)
10.4.6.2. Rest of Asia Pacific Gas Turbine Services, By Type, 2016-2028 (US$ Bn)
10.4.6.3. Rest of Asia Pacific Gas Turbine Services, By Service, 2016-2028 (US$ Bn)
10.4.6.4. Rest of Asia Pacific Gas Turbine Services, By End-Use, 2016-2028 (US$ Bn)

11. Latin America Gas Turbine Services Market Analysis
11.1. Latin America Gas Turbine Services Market, by Type, 2016-2028(US$ Bn)
11.1.1. Overview
11.1.2. SRC Analysis
11.2. Latin America Gas Turbine Services Market, by Service, 2016-2028(US$ Bn)
11.2.1. Overview
11.2.2. SRC Analysis
11.3. Latin America Gas Turbine Services Market, by End-Use, 2016-2028(US$ Bn)
11.3.1. Overview
11.3.2. SRC Analysis
11.4. Latin America Gas Turbine Services Market, by Country, 2016-2028 (US$ Bn)
11.4.1. Brazil
11.4.1.1. Brazil Gas Turbine Services Market Estimates and Forecast, 2016-2028 (US$ Bn)
11.4.1.2. Brazil Gas Turbine Services, By Type, 2016-2028 (US$ Bn)
11.4.1.3. Brazil Gas Turbine Services, By Service, 2016-2028 (US$ Bn)
11.4.1.4. Brazil Gas Turbine Services, By End-Use, 2016-2028 (US$ Bn)
11.4.2. Mexico
11.4.2.1. Mexico Gas Turbine Services Market Estimates and Forecast, 2016-2028 (US$ Bn)
11.4.2.2. Mexico Gas Turbine Services, By Type, 2016-2028 (US$ Bn)
11.4.2.3. Mexico Gas Turbine Services, By Service, 2016-2028 (US$ Bn)
11.4.2.4. Mexico Gas Turbine Services, By End-Use, 2016-2028 (US$ Bn)
11.4.3. Rest of Latin America
11.4.3.1. Rest of Latin America Gas Turbine Services Market Estimates and Forecast, 2016-2028 (US$ Bn)
11.4.3.2. Rest of Latin America Gas Turbine Services, By Type, 2016-2028 (US$ Bn)
11.4.3.3. Rest of Latin America Gas Turbine Services, By Service, 2016-2028 (US$ Bn)
11.4.3.4. Rest of Latin America Gas Turbine Services, By End-Use, 2016-2028 (US$ Bn)

12. Middle East and Africa Gas Turbine Services Market Analysis
12.1. Middle East and Africa Gas Turbine Services Market, by Type, 2016-2028(US$ Bn)
12.1.1. Overview
12.1.2. SRC Analysis
12.2. Middle East and Africa Gas Turbine Services Market, by Service, 2016-2028(US$ Bn)
12.2.1. Overview
12.2.2. SRC Analysis
12.3. Middle East and Africa Gas Turbine Services Market, by End-Use, 2016-2028(US$ Bn)
12.3.1. Overview
12.3.2. SRC Analysis
12.4. Middle East and Africa Gas Turbine Services Market, by Country, 2016-2028 (US$ Bn)
12.4.1. GCC Countries
12.4.1.1. GCC Countries Gas Turbine Services Market Estimates and Forecast, 2016-2028 (US$ Bn)
12.4.1.2. GCC Countries Gas Turbine Services, By Type, 2016-2028 (US$ Bn)
12.4.1.3. GCC Countries Gas Turbine Services, By Service, 2016-2028 (US$ Bn)
12.4.1.4. GCC Countries Gas Turbine Services, By End-Use, 2016-2028 (US$ Bn)
12.4.2. South Africa
12.4.2.1. South Africa Gas Turbine Services Market Estimates and Forecast, 2016-2028 (US$ Bn)
12.4.2.2. South Africa Gas Turbine Services, By Type, 2016-2028 (US$ Bn)
12.4.2.3. South Africa Gas Turbine Services, By Service, 2016-2028 (US$ Bn)
12.4.2.4. South Africa Gas Turbine Services, By End-Use, 2016-2028 (US$ Bn)
12.4.3. Rest of Middle East and Africa
12.4.3.1. Rest of Middle East and Africa Gas Turbine Services Market Estimates and Forecast, 2016-2028 (US$ Bn)
12.4.3.2. Rest of Middle East and Africa Gas Turbine Services, By Type, 2016-2028 (US$ Bn)
12.4.3.3. Rest of Middle East and Africa Gas Turbine Services, By Service, 2016-2028 (US$ Bn)
12.4.3.4. Rest of Middle East and Africa Gas Turbine Services, By End-Use, 2016-2028 (US$ Bn)

13. Company Profiles
13.1. MAN SE (Germany)
13.1.1. Company Overview
13.1.2. Products/Services Portfolio
13.1.3. Geographical Presence
13.1.4. Financial Summary
13.1.4.1. Market Revenue and Net Profit (2019-2021)
13.1.4.2. Business Segment Revenue Analysis
13.1.4.3. Geographical Revenue Analysis
13.2. EthosEnergy (US)
13.3. Proenergy Services (US)
13.4. Caterpillar (US)
13.5. MJB International Limited LLC (UAE)
13.6. Ansaldo Energia (Italy)
13.7. Sulzer Ltd (Switzerland)
13.8. Mitsubishi Heavy Industries Ltd (Japan)
13.9. BHI Energy (UK)
13.10. General Electric (US)
13.11. Siemens (Germany)
13.12. MTU Aero Engines (Germany)

List of Figures

FIG. 1 Global Gas Turbine Services Market: Research Methodology
FIG. 2 Market Size Estimation – Top Down & Bottom up Approach
FIG. 3 Global Gas Turbine Services Market Segmentation
FIG. 4 Global Gas Turbine Services Market, by Type, 2021 (US$ Bn)
FIG. 5 Global Gas Turbine Services Market, by Service, 2021 (US$ Bn)
FIG. 6 Global Gas Turbine Services Market, by End-Use, 2021 (US$ Bn)
FIG. 7 Global Gas Turbine Services Market, by Geography, 2021 (US$ Bn)
FIG. 8 Attractive Investment Proposition, by Type, 2021
FIG. 9 Attractive Investment Proposition, by Service, 2021
FIG. 10 Attractive Investment Proposition, by End-Use, 2021
FIG. 11 Attractive Investment Proposition, by Geography, 2021
FIG. 12 Global Market Share Analysis of Key Gas Turbine Services Market Manufacturers, 2021
FIG. 13 Global Market Positioning of Key Gas Turbine Services Market Manufacturers, 2021
FIG. 14 Global Gas Turbine Services Market Value Contribution, By Type, 2021 & 2028 (Value %)
FIG. 15 Global Gas Turbine Services Market, by Heavy Duty, Value, 2016-2028 (US$ Bn)
FIG. 16 Global Gas Turbine Services Market, by Industrial, Value, 2016-2028 (US$ Bn)
FIG. 17 Global Gas Turbine Services Market, by Aeroderivative, Value, 2016-2028 (US$ Bn)
FIG. 18 Global Gas Turbine Services Market Value Contribution, By Service, 2021 & 2028 (Value %)
FIG. 19 Global Gas Turbine Services Market, by Maintenance & Repair, Value, 2016-2028 (US$ Bn)
FIG. 20 Global Gas Turbine Services Market, by Overhaul, Value, 2016-2028 (US$ Bn)
FIG. 21 Global Gas Turbine Services Market, by Spare Parts Supply, Value, 2016-2028 (US$ Bn)
FIG. 22 Global Gas Turbine Services Market Value Contribution, By End-Use, 2021 & 2028 (Value %)
FIG. 23 Global Gas Turbine Services Market, by Power Generation, Value, 2016-2028 (US$ Bn)
FIG. 24 Global Gas Turbine Services Market, by Oil & Gas, Value, 2016-2028 (US$ Bn)
FIG. 25 Global Gas Turbine Services Market, by Others, Value, 2016-2028 (US$ Bn)
FIG. 26 U.S. Gas Turbine Services Market, 2016-2028 (US$ Bn)
FIG. 27 Canada Gas Turbine Services Market, 2016-2028 (US$ Bn)
FIG. 28 Germany Gas Turbine Services Market, 2016-2028 (US$ Bn)
FIG. 29 France Gas Turbine Services Market, 2016-2028 (US$ Bn)
FIG. 30 U.K. Gas Turbine Services Market, 2016-2028 (US$ Bn)
FIG. 31 Italy Gas Turbine Services Market, 2016-2028 (US$ Bn)
FIG. 32 Spain Gas Turbine Services Market, 2016-2028 (US$ Bn)
FIG. 33 Rest of Europe Gas Turbine Services Market, 2016-2028 (US$ Bn)
FIG. 34 China Gas Turbine Services Market, 2016-2028 (US$ Bn)
FIG. 35 Japan Gas Turbine Services Market, 2016-2028 (US$ Bn)
FIG. 36 India Gas Turbine Services Market, 2016-2028 (US$ Bn)
FIG. 37 South Korea Gas Turbine Services Market, 2016-2028 (US$ Bn)
FIG. 38 Southeast Asia Gas Turbine Services Market, 2016-2028 (US$ Bn)
FIG. 39 Rest of Asia Pacific Gas Turbine Services Market, 2016-2028 (US$ Bn)
FIG. 40 Latin America Gas Turbine Services Market, 2016-2028 (US$ Bn)
FIG. 41 Brazil Gas Turbine Services Market, 2016-2028 (US$ Bn)
FIG. 42 Mexico Gas Turbine Services Market, 2016-2028 (US$ Bn)
FIG. 43 Rest of Latin America Gas Turbine Services Market, 2016-2028 (US$ Bn)
FIG. 44 Middle East & Africa Gas Turbine Services Market, 2016-2028 (US$ Bn)
FIG. 45 GCC Countries Gas Turbine Services Market, 2016-2028 (US$ Bn)
FIG. 46 South Africa Gas Turbine Services Market, 2016-2028 (US$ Bn)
FIG. 47 Rest of Middle East and Africa Gas Turbine Services Market, 2016-2028 (US$ Bn)

List of Tables

TABLE 1 Market Snapshot: Global Gas Turbine Services Market
TABLE 2 Global Gas Turbine Services Market, by Competitive Benchmarking, 2021
TABLE 3 Global Gas Turbine Services Market, by Geographical Presence Analysis, 2021
TABLE 4 Global Gas Turbine Services Market, by Key Strategies Analysis, 2021
TABLE 5 Global Gas Turbine Services Market, by Type, 2016-2028 (US$ Bn)
TABLE 6 Global Gas Turbine Services Market, by Service, 2016-2028 (US$ Bn)
TABLE 7 Global Gas Turbine Services Market, by End-Use, 2016-2028 (US$ Bn)
TABLE 8 Global Gas Turbine Services Market, by Geography, 2016-2028 (US$ Bn)
TABLE 9 North America Gas Turbine Services Market, by Type, 2016-2028 (US$ Bn)
TABLE 10 North America Gas Turbine Services Market, by Service, 2016-2028 (US$ Bn)
TABLE 11 North America Gas Turbine Services Market, by End-Use, 2016-2028 (US$ Bn)
TABLE 12 North America Gas Turbine Services Market, by Country, 2016-2028 (US$ Bn)
TABLE 13 US Gas Turbine Services Market, by Type, 2016-2028 (US$ Bn)
TABLE 14 US Gas Turbine Services Market, by Service, 2016-2028 (US$ Bn)
TABLE 15 US Gas Turbine Services Market, by End-Use, 2016-2028 (US$ Bn)
TABLE 16 Canada Gas Turbine Services Market, by Type, 2016-2028 (US$ Bn)
TABLE 17 Canada Gas Turbine Services Market, by Service, 2016-2028 (US$ Bn)
TABLE 18 Canada Gas Turbine Services Market, by End-Use, 2016-2028 (US$ Bn)
TABLE 19 Europe Gas Turbine Services Market, by Type, 2016-2028 (US$ Bn)
TABLE 20 Europe Gas Turbine Services Market, by Service, 2016-2028 (US$ Bn)
TABLE 21 Europe Gas Turbine Services Market, by End-Use, 2016-2028 (US$ Bn)
TABLE 22 Europe Gas Turbine Services Market, by Country, 2016-2028 (US$ Bn)
TABLE 23 Germany Gas Turbine Services Market, by Type, 2016-2028 (US$ Bn)
TABLE 24 Germany Gas Turbine Services Market, by Service, 2016-2028 (US$ Bn)
TABLE 25 Germany Gas Turbine Services Market, by End-Use, 2016-2028 (US$ Bn)
TABLE 26 France Gas Turbine Services Market, by Type, 2016-2028 (US$ Bn)
TABLE 27 France Gas Turbine Services Market, by Service, 2016-2028 (US$ Bn)
TABLE 28 France Gas Turbine Services Market, by End-Use, 2016-2028 (US$ Bn)
TABLE 29 UK Gas Turbine Services Market, by Type, 2016-2028 (US$ Bn)
TABLE 30 UK Gas Turbine Services Market, by Service, 2016-2028 (US$ Bn)
TABLE 31 UK Gas Turbine Services Market, by End-Use, 2016-2028 (US$ Bn)
TABLE 32 Italy Gas Turbine Services Market, by Type, 2016-2028 (US$ Bn)
TABLE 33 Italy Gas Turbine Services Market, by Service, 2016-2028 (US$ Bn)
TABLE 34 Italy Gas Turbine Services Market, by End-Use, 2016-2028 (US$ Bn)
TABLE 35 Spain Gas Turbine Services Market, by Type, 2016-2028 (US$ Bn)
TABLE 36 Spain Gas Turbine Services Market, by Service, 2016-2028 (US$ Bn)
TABLE 37 Spain Gas Turbine Services Market, by End-Use, 2016-2028 (US$ Bn)
TABLE 38 Rest of Europe Gas Turbine Services Market, by Type, 2016-2028 (US$ Bn)
TABLE 39 Rest of Europe Gas Turbine Services Market, by Service, 2016-2028 (US$ Bn)
TABLE 40 Rest of Europe Gas Turbine Services Market, by End-Use, 2016-2028 (US$ Bn)
TABLE 41 Asia Pacific Gas Turbine Services Market, by Type, 2016-2028 (US$ Bn)
TABLE 42 Asia Pacific Gas Turbine Services Market, by Service, 2016-2028 (US$ Bn)
TABLE 43 Asia Pacific Gas Turbine Services Market, by End-Use, 2016-2028 (US$ Bn)
TABLE 44 Asia Pacific Gas Turbine Services Market, by Country, 2016-2028 (US$ Bn)
TABLE 45 China Gas Turbine Services Market, by Type, 2016-2028 (US$ Bn)
TABLE 46 China Gas Turbine Services Market, by Service, 2016-2028 (US$ Bn)
TABLE 47 China Gas Turbine Services Market, by End-Use, 2016-2028 (US$ Bn)
TABLE 48 Japan Gas Turbine Services Market, by Type, 2016-2028 (US$ Bn)
TABLE 49 Japan Gas Turbine Services Market, by Service, 2016-2028 (US$ Bn)
TABLE 50 Japan Gas Turbine Services Market, by End-Use, 2016-2028 (US$ Bn)
TABLE 51 India Gas Turbine Services Market, by Type, 2016-2028 (US$ Bn)
TABLE 52 India Gas Turbine Services Market, by Service, 2016-2028 (US$ Bn)
TABLE 53 India Gas Turbine Services Market, by End-Use, 2016-2028 (US$ Bn)
TABLE 54 South Korea Gas Turbine Services Market, by Type, 2016-2028 (US$ Bn)
TABLE 55 South Korea Gas Turbine Services Market, by Service, 2016-2028 (US$ Bn)
TABLE 56 South Korea Gas Turbine Services Market, by End-Use, 2016-2028 (US$ Bn)
TABLE 57 South East Asia Gas Turbine Services Market, by Type, 2016-2028 (US$ Bn)
TABLE 58 South East Asia Gas Turbine Services Market, by Service, 2016-2028 (US$ Bn)
TABLE 59 South East Asia Gas Turbine Services Market, by End-Use, 2016-2028 (US$ Bn)
TABLE 60 Rest of Asia Pacific Gas Turbine Services Market, by Type, 2016-2028 (US$ Bn)
TABLE 61 Rest of Asia Pacific Gas Turbine Services Market, by Service, 2016-2028 (US$ Bn)
TABLE 62 Rest of Asia Pacific Gas Turbine Services Market, by End-Use, 2016-2028 (US$ Bn)
TABLE 63 Latin America Gas Turbine Services Market, by Type, 2016-2028 (US$ Bn)
TABLE 64 Latin America Gas Turbine Services Market, by Service, 2016-2028 (US$ Bn)
TABLE 65 Latin America Gas Turbine Services Market, by End-Use, 2016-2028 (US$ Bn)
TABLE 66 Latin America Gas Turbine Services Market, by Country, 2016-2028 (US$ Bn)
TABLE 67 Brazil Gas Turbine Services Market, by Type, 2016-2028 (US$ Bn)
TABLE 68 Brazil Gas Turbine Services Market, by Service, 2016-2028 (US$ Bn)
TABLE 69 Brazil Gas Turbine Services Market, by End-Use, 2016-2028 (US$ Bn)
TABLE 70 Mexico Gas Turbine Services Market, by Type, 2016-2028 (US$ Bn)
TABLE 71 Mexico Gas Turbine Services Market, by Service, 2016-2028 (US$ Bn)
TABLE 72 Mexico Gas Turbine Services Market, by End-Use, 2016-2028 (US$ Bn)
TABLE 73 Rest of Latin America Gas Turbine Services Market, by Type, 2016-2028 (US$ Bn)
TABLE 74 Rest of Latin America Gas Turbine Services Market, by Service, 2016-2028 (US$ Bn)
TABLE 75 Rest of Latin America Gas Turbine Services Market, by End-Use, 2016-2028 (US$ Bn)
TABLE 76 Middle East and Africa Gas Turbine Services Market, by Type, 2016-2028 (US$ Bn)
TABLE 77 Middle East and Africa Gas Turbine Services Market, by Service, 2016-2028 (US$ Bn)
TABLE 78 Middle East and Africa Gas Turbine Services Market, by End-Use, 2016-2028 (US$ Bn)
TABLE 79 Middle East and Africa Gas Turbine Services Market, by Country, 2016-2028 (US$ Bn)
TABLE 80 GCC Countries Gas Turbine Services Market, by Type, 2016-2028 (US$ Bn)
TABLE 81 GCC Countries Gas Turbine Services Market, by Service, 2016-2028 (US$ Bn)
TABLE 82 GCC Countries Gas Turbine Services Market, by End-Use, 2016-2028 (US$ Bn)
TABLE 83 South Africa Gas Turbine Services Market, by Type, 2016-2028 (US$ Bn)
TABLE 84 South Africa Gas Turbine Services Market, by Service, 2016-2028 (US$ Bn)
TABLE 85 South Africa Gas Turbine Services Market, by End-Use, 2016-2028 (US$ Bn)
TABLE 86 Rest of Middle East and Africa Gas Turbine Services Market, by Type, 2016-2028 (US$ Bn)
TABLE 87 Rest of Middle East and Africa Gas Turbine Services Market, by Service, 2016-2028 (US$ Bn)
TABLE 88 Rest of Middle East and Africa Gas Turbine Services Market, by End-Use, 2016-2028 (US$ Bn)

Frequently Asked Questions

How does COVID-19 impact the global gas turbine services market?

The global gas turbine services market also suffered from the COVID-19 pandemic, which resulted in a decline of over 4.6% in revenue generated in 2020.

Which is the leading region of the market for gas turbine services?

Asia Pacific accounted for the most heightened share in the global gas turbine services market.

What are the key drivers for the global gas turbine services market growth?

Rising environmental concerns caused by the significant carbon emissions from coal-based power generation have led to the adoption of low-carbon emission power generation technologies, one of the key factors fueling the growth of the global gas turbine services market.

Which is the major segment in the gas turbine services market by service?

The spare parts supply segment had a major share in the global market in 2021.

Which is the major segment in the gas turbine services market by end-user?

The power generation segment had a major share in the global market.

Cell Culture Media And Reagents Market

Published:
Report ID: 3489

Viral Antigens Market

Published:
Report ID: 36114

Recombinant Protein Market

Published:
Report ID: 35991

Bacteriophage Market

Published:
Report ID: 2114

India Bone Marrow Transplantation (BMT) Market

Published:
Report ID: 35571

Bioengineered Skin And Skin Substitutes Market

Published:
Report ID: 3472

DNA and RNA Sample Preparation Market

Published:
Report ID: 34911

Laboratory Filtration Market

Published:
Report ID: 7940

Adult Hemoglobinopathy Testing Market

Published:
Report ID: 34717

Nanobiotechnology Market

Published:
Report ID: 14350

Canine Stem Cell Therapy Market

Published:
Report ID: 34386

Humanized Mice Model Market

Published:
Report ID: 34329

Purchase Options

$2999
Delivery Format: Excel.
$4999
Designed for the individual purchaser.
$6999
Users located at a single corporate site or regional office.
$7999
Allowed for unlimited sharing globally within one company.
Smallform of Sample request

Have a question?

User Profile

Don’t settle for less – trust Mitul to help you find the best solution.

Report delivery within 24 to 48 hours

– Other Info –

What people say?-

User Review

I am very impressed with the information in this report. The author clearly did their research when they came up with this product and it has already given me a lot of ideas.

Jana Schmidt
CEDAR CX Technologies

– Connect with us –

Phone

+91 6232 49 3207


support

24/7 Research Support


sales@credenceresearch.com

– Research Methodology –

Going beyond the basics: advanced techniques in research methodology

– Trusted By –

Pepshi, LG, Nestle
Motorola, Honeywell, Johnson and johnson
LG Chem, SIEMENS, Pfizer
Unilever, Samsonite, QIAGEN