Market Overview
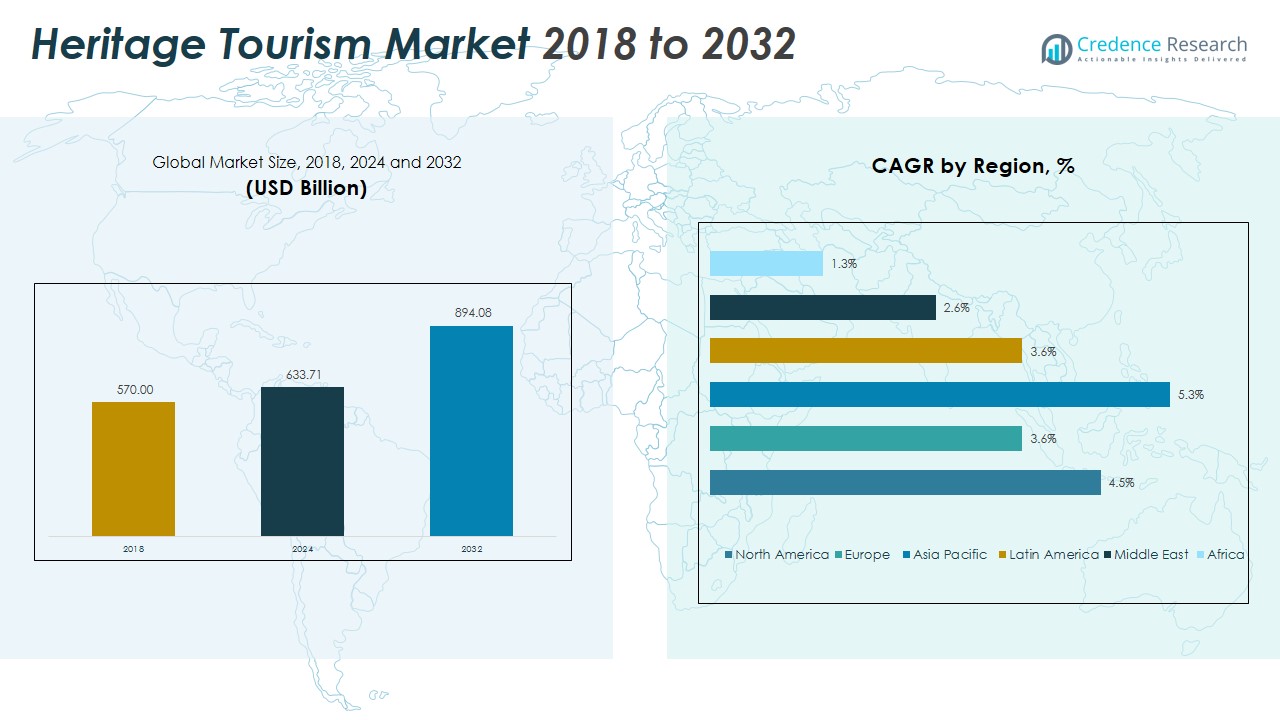
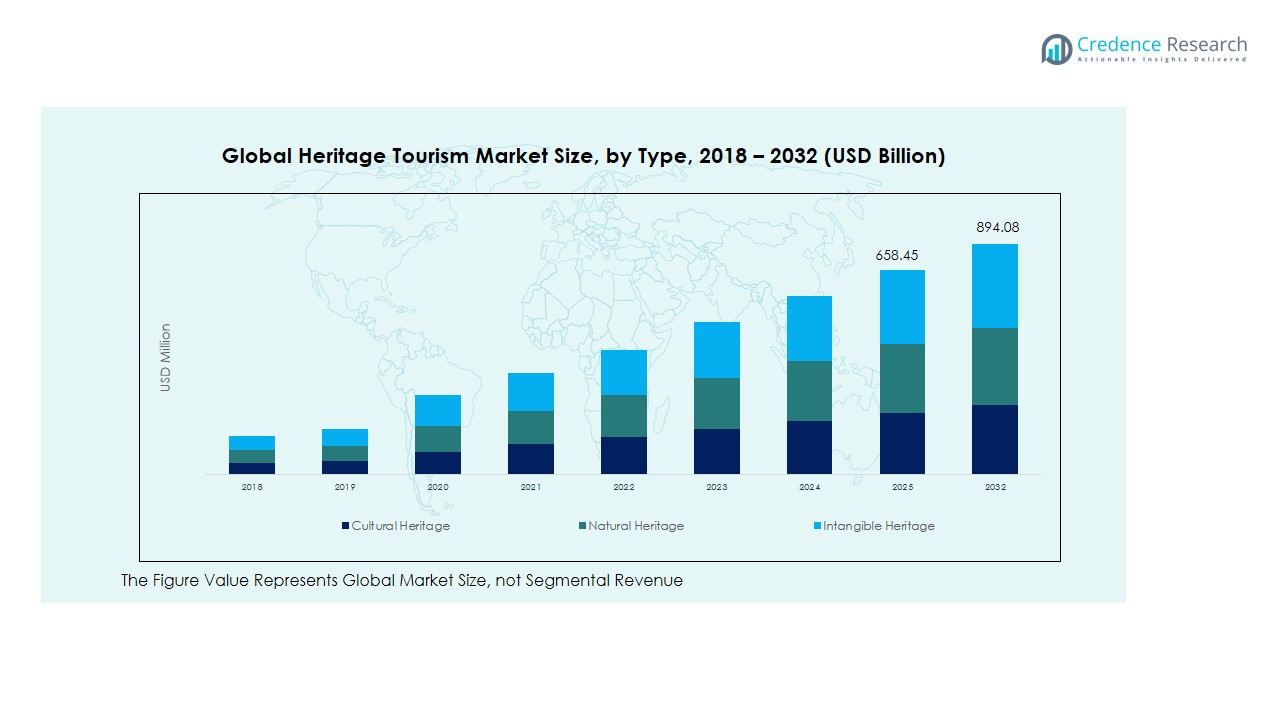
The Heritage Tourism Market size was valued at USD 570.00 Billion in 2018, reached USD 633.71 Billion in 2024, and is anticipated to reach USD 894.08 Billion by 2032, at a CAGR of 4.47% during the forecast period.
| REPORT ATTRIBUTE |
DETAILS |
| Historical Period |
2020-2023 |
| Base Year |
2024 |
| Forecast Period |
2025-2032 |
| Heritage Tourism Market Size 2024 |
USD 633.71 Billion |
| Heritage Tourism Market, CAGR |
4.47% |
| Heritage Tourism Market Size 2032 |
USD 894.08 Billion |
The Heritage Tourism Market is shaped by a blend of global operators and niche cultural specialists. Leading companies include Expedia Group, Inc., TUI AG, BCD Travel, Carlson Wagonlit Travel, ACE Cultural Tours Ltd., Martin Randall Travel Ltd., Exodus Travels Ltd., Kesari Tours Pvt. Ltd., ATG Travel, and Travel Leaders Group, all competing through digital platforms, immersive packages, and sustainable practices. These players emphasize innovative booking systems, heritage-focused itineraries, and strong partnerships with cultural institutions. Regionally, Asia Pacific dominated the market in 2024 with a 40.5% share, driven by rising middle-class incomes, government heritage initiatives, and expanding domestic and international tourism flows.
Access crucial information at unmatched prices!
Request your sample report today & start making informed decisions powered by Credence Research Inc.!
Download Sample
Market Insights
- The Heritage Tourism Market grew from USD 570.00 Billion in 2018 to USD 633.71 Billion in 2024 and is projected to reach USD 894.08 Billion by 2032 at a CAGR of 47%.
- Cultural tourism led the market in 2024 with a 42% share, supported by demand for festivals, art, and authentic traditions, while historical and religious tourism also showed strong traction.
- The 26-35 years age group dominated with a 34% share in 2024, driven by affordable travel packages, digital platforms, and immersive experiences, followed by the 36-45 years segment.
- Online booking accounted for 61% share in 2024, boosted by mobile apps, virtual tours, and digital payment systems, while offline booking remained relevant for older and rural travelers.
- Asia Pacific dominated with a 5% share in 2024, followed by North America at 25.4% and Europe at 22.2%, driven by strong domestic demand, cultural investments, and infrastructure.
Market Segment Insights
By Type
Cultural tourism dominated the heritage tourism market in 2024 with a 42% share. Growth is driven by rising interest in cultural festivals, art, and local traditions. Travelers seek immersive experiences that connect them with authentic lifestyles and heritage communities. Historical tourism follows closely, supported by visits to iconic landmarks and UNESCO sites. Religious and spiritual tourism maintains steady demand, particularly in Asia and the Middle East. Educational tourism attracts student groups, while “others” include niche heritage travel options.
By Age Group
The 26–35 years segment led the market in 2024 with a 34% share. This group values affordable travel packages, online booking platforms, and experiential tourism. Young adults prioritize cultural immersion and adventure linked to heritage destinations. The 36–45 years group follows, contributing strongly to family and group travel demand. The 46–55 and 56+ years groups focus on comfort and guided tours. Meanwhile, the 15–25 years segment grows steadily, supported by student exchange programs and budget travel initiatives.
- For instance, TUI launched family-friendly Mediterranean cruise packages catering largely to this demographic, including onboard childcare and multi-destination itineraries.
By Booking Mode
Online booking held a 61% share in 2024, making it the dominant mode in heritage tourism. The rise of mobile applications, virtual tours, and digital payment systems has accelerated adoption. Consumers increasingly use online channels for price comparisons, instant confirmations, and personalized recommendations. Offline booking still serves an important role, especially among older age groups and rural areas where digital access remains limited. Traditional travel agencies maintain relevance by offering tailored packages and expert guidance for complex heritage trips.
- For instance, MakeMyTrip partnered with Archaeological Survey of India (ASI) to enable tourists to book entry tickets for over 120 heritage monuments directly through its app, enhancing convenience for domestic and international travelers.
Key Growth Drivers
Rising Cultural Awareness and Preservation Initiatives
Governments and organizations are investing heavily in preserving cultural heritage, which directly boosts tourism. Increased promotion of UNESCO World Heritage sites and local heritage festivals attracts domestic and international visitors. Educational campaigns, cultural events, and heritage trails enhance awareness among younger generations. This emphasis on cultural preservation not only safeguards historical assets but also creates new opportunities for tourism operators. As more destinations invest in restoration and promotion, the market benefits from a steady inflow of culturally motivated travelers.
- For instance, UNESCO and Saudi Arabia’s Ministry of Culture partnered to restore Diriyah, a UNESCO-listed heritage site, as part of a $50 billion master plan to develop the area into a global cultural tourism hub.
Expanding Digital Platforms and Online Bookings
The rise of online booking platforms and mobile applications significantly accelerates market growth. Tourists can now explore heritage sites virtually, compare travel packages, and make instant bookings. Enhanced digital tools, including AI-driven personalization and virtual reality previews, improve customer engagement. These innovations appeal particularly to younger age groups seeking convenience and flexibility. Digital promotion by governments and private players also increases visibility of lesser-known heritage sites. The rapid digital shift provides a scalable way to reach global audiences efficiently.
- For instance, Airbnb expanded its “Airbnb Experiences” platform to include heritage walks and cultural workshops across Europe and Asia, providing small local operators with global visibility through digital booking tools.
Growing Demand for Experiential and Educational Travel
Tourists are increasingly seeking experiences that go beyond sightseeing, favoring immersive learning opportunities. Heritage tourism aligns perfectly with this demand, offering guided tours, workshops, and cultural exchanges. Educational institutions support this trend by organizing field trips and study tours, especially for history and anthropology students. Travelers also engage with local communities to learn crafts, traditions, and cuisines. This growing preference for meaningful travel experiences strengthens demand for heritage-based tours. It also encourages operators to design more interactive and educational packages.
Key Trends & Opportunities
Integration of Technology in Heritage Experiences
Technology is reshaping heritage tourism through virtual tours, augmented reality (AR), and mobile apps. These tools enhance visitor engagement by providing interactive storytelling and real-time site information. Virtual reality enables global audiences to experience heritage destinations remotely, widening accessibility. Governments and private operators are adopting such solutions to attract tech-savvy tourists and improve visitor satisfaction. This trend presents opportunities for digital innovators and destination managers to expand heritage offerings, bridging cultural history with modern-day technology-driven experiences.
- For instance, the British Museum collaborated with Oculus to launch VR reconstructions of ancient Egyptian galleries, enabling online visitors to explore artifacts with lifelike detail.
Rising Focus on Sustainable and Responsible Tourism
Sustainability is becoming central to heritage tourism strategies worldwide. Tourists increasingly favor eco-friendly options that preserve cultural assets and minimize environmental impacts. Governments are implementing stricter guidelines to manage crowding at heritage sites and ensure long-term conservation. Operators offering sustainable travel packages, including low-carbon transport and community-based tourism, stand to gain. Responsible tourism not only supports local economies but also appeals to conscious travelers. This trend creates opportunities to design heritage experiences that balance cultural preservation with sustainable practices.
- For instance, in Varanasi, India, sustainable tourism policies have engaged local artisans like Banarasi silk weavers directly with tourists, promoting fair trade and economic benefits while supporting heritage crafts.
Key Challenges
Overcrowding and Preservation Concerns
The growing popularity of heritage destinations often results in overcrowding, threatening site integrity. Popular monuments and cultural landmarks face deterioration due to excessive footfall. This challenge demands stricter visitor management policies, capacity limits, and advanced conservation efforts. Without effective preservation strategies, key sites risk long-term damage and diminished appeal. Balancing accessibility with protection remains a critical issue. Heritage managers must invest in sustainable practices to ensure tourism does not compromise the historical and cultural value of destinations.
Digital Divide in Access to Heritage Tourism
While digital platforms drive growth, many potential travelers lack access to advanced technologies. Rural communities, older demographics, and regions with limited internet connectivity are often excluded from online booking systems. This divide restricts participation in emerging digital-driven heritage tourism models. Offline channels remain necessary, but their growth is slower compared to online modes. Bridging this gap through hybrid booking systems and improved digital literacy is essential. Otherwise, the market risks excluding key customer segments and losing opportunities.
Geopolitical Instability and Safety Concerns
Heritage tourism is highly sensitive to geopolitical tensions, regional conflicts, and safety concerns. Political instability can deter international travelers from visiting culturally rich regions. Natural disasters and pandemics also pose risks to heritage tourism flows. These uncertainties lead to revenue fluctuations for operators and local economies dependent on tourism. Ensuring safety, implementing crisis management strategies, and diversifying tourism offerings across multiple regions can help reduce the impact. Stability and resilience remain key for sustained heritage tourism growth.
Regional Analysis
North America
The North America heritage tourism market was valued at USD 147.57 Billion in 2018, increased to USD 161.28 Billion in 2024, and is projected to reach USD 227.10 Billion by 2032, registering a CAGR of 4.5%. The region accounted for 25.4% of the global market in 2024, driven by strong cultural promotion, robust infrastructure, and digital integration in travel services. Demand is supported by high disposable incomes and government initiatives to preserve and showcase heritage landmarks, positioning North America as a leading contributor to global heritage tourism growth.
Europe
Europe recorded USD 132.47 Billion in 2018, reaching USD 140.79 Billion in 2024, and is anticipated to achieve USD 186.10 Billion by 2032, at a CAGR of 3.6%. The region held a 22.2% market share in 2024, supported by a dense concentration of UNESCO World Heritage sites, historic cities, and rich cultural traditions. Demand is reinforced by international tourists drawn to art, architecture, and heritage festivals. Europe continues to attract repeat visitors, though growth is modest compared to emerging markets due to market maturity and established tourism infrastructure.
Asia Pacific
The Asia Pacific heritage tourism market stood at USD 224.69 Billion in 2018, expanded to USD 256.68 Billion in 2024, and is expected to reach USD 385.80 Billion by 2032, registering the highest CAGR of 5.3%. The region accounted for 40.5% of the global share in 2024, making it the largest regional market. Growth is fueled by rising middle-class incomes, strong domestic tourism demand, and increasing government investments in heritage conservation. Popular destinations in China, India, and Southeast Asia drive significant inflows, supported by digital platforms that expand access to heritage experiences.
Latin America
Latin America was valued at USD 41.04 Billion in 2018, rose to USD 45.24 Billion in 2024, and is anticipated to reach USD 59.79 Billion by 2032, recording a CAGR of 3.6%. The region represented 7.1% of the global market in 2024, supported by attractions such as ancient civilizations, colonial heritage, and vibrant festivals. Countries like Mexico, Brazil, and Peru are focal points for cultural tourism, with growing demand from North American and European travelers. Investments in infrastructure and community-based tourism are strengthening Latin America’s position in global heritage tourism.
Middle East
The Middle East heritage tourism market reached USD 15.85 Billion in 2018, modestly growing to USD 16.09 Billion in 2024, and projected to hit USD 19.59 Billion by 2032, with a CAGR of 2.6%. The region captured 2.5% of the global share in 2024, reflecting limited but steady growth. Religious tourism to destinations such as Saudi Arabia and Israel remains a key driver, complemented by cultural attractions in the UAE and Egypt. Political stability, security improvements, and heritage promotion initiatives are essential for unlocking higher growth potential in the Middle East.
Africa
Africa was valued at USD 8.38 Billion in 2018, increased to USD 13.63 Billion in 2024, and is expected to reach USD 15.71 Billion by 2032, growing at a CAGR of 1.3%. The region accounted for 2.2% of the global share in 2024, representing the smallest market. Despite its wealth of cultural heritage and archaeological sites, limited infrastructure, political instability, and low investment in tourism restrict growth. However, rising awareness of African heritage, combined with global interest in eco-cultural travel, provides long-term opportunities for heritage tourism expansion in the region.
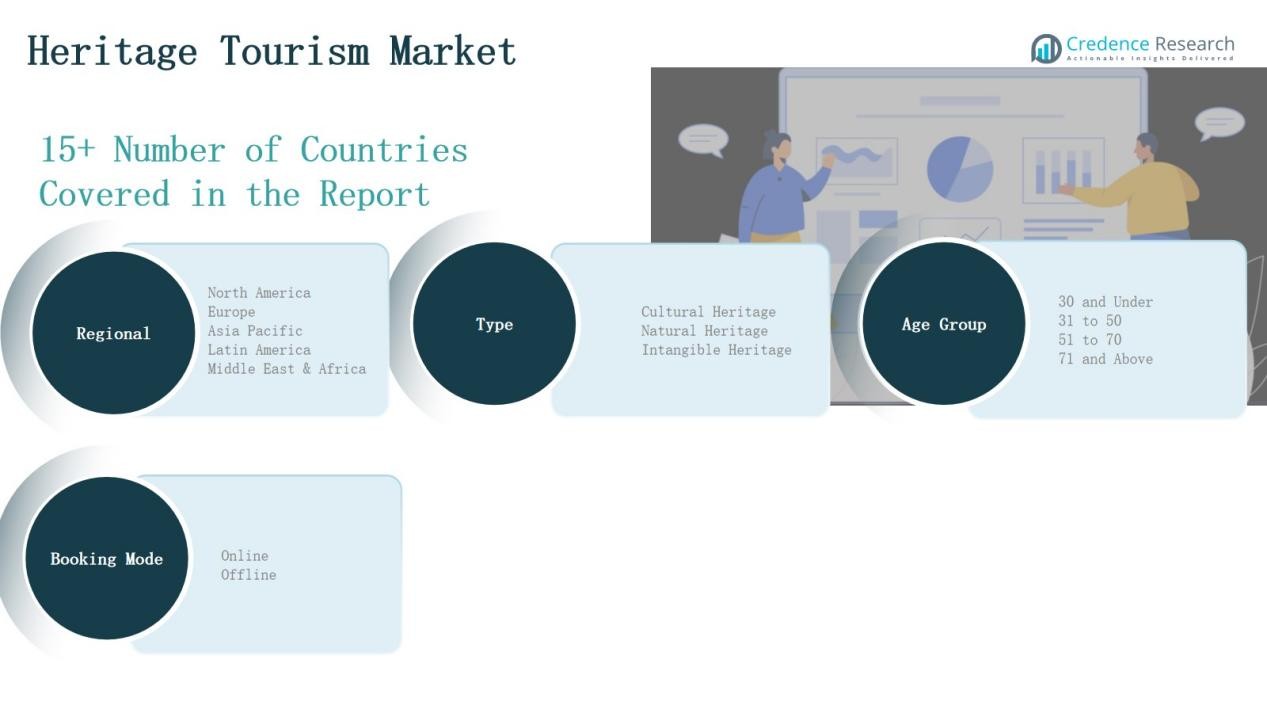
Market Segmentations:
By Type
- Cultural Tourism
- Historical Tourism
- Religious/Spiritual Tourism
- Educational Tourism
- Others
By Age Group
- 15–25 Years
- 26–35 Years
- 36–45 Years
- 46–55 Years
- 56+ Years
By Booking Mode
- Online Booking
- Offline Booking
By Region
- North America
- Europe
- Germany
- France
- U.K.
- Italy
- Spain
- Rest of Europe
- Asia Pacific
- China
- Japan
- India
- South Korea
- South-east Asia
- Rest of Asia Pacific
- Latin America
- Brazil
- Argentina
- Rest of Latin America
- Middle East & Africa
- GCC Countries
- South Africa
- Rest of the Middle East and Africa
Competitive Landscape
The heritage tourism market is characterized by a mix of global travel operators, regional specialists, and niche cultural tour providers. Key players such as Expedia Group, Inc., TUI AG, BCD Travel, and Carlson Wagonlit Travel leverage strong digital platforms, extensive distribution networks, and partnerships with heritage sites to maintain a competitive edge. Companies like ACE Cultural Tours Ltd., Martin Randall Travel Ltd., and Kesari Tours Pvt. Ltd. focus on specialized cultural and historical packages, catering to niche traveler preferences. Innovation in online booking systems, personalized itineraries, and immersive experiences such as guided tours and cultural workshops have become central to differentiation. Sustainability and responsible tourism practices are gaining traction, with players emphasizing eco-friendly operations and community engagement. The competitive environment is further shaped by strategic collaborations, acquisitions, and digital marketing campaigns, as operators seek to expand their reach and capture a growing base of culturally motivated travelers.
Shape Your Report to Specific Countries or Regions & Enjoy 30% Off!
Key Players
Recent Developments
- In September 2025, Journeys International and MEJDI Tours announced a partnership to expand cross-cultural and heritage travel offerings.
- In May 2025, Vitruvian Partners completed the acquisition of Great Rail Journeys, strengthening its presence in heritage and rail tourism.
- In July 2025, Belmond launched the Belmond Britannic Explorer, a new luxury sleeper train designed to highlight heritage travel experiences.
- In April 2025, UNESCO launched the “World Heritage, Sustainable Development and Local Communities” project in Taj Ganj, Agra, focusing on empowering local artisans through design innovation and market linkages.
Report Coverage
The research report offers an in-depth analysis based on Type, Age Group, Booking Mode and Region. It details leading market players, providing an overview of their business, product offerings, investments, revenue streams, and key applications. Additionally, the report includes insights into the competitive environment, SWOT analysis, current market trends, as well as the primary drivers and constraints. Furthermore, it discusses various factors that have driven market expansion in recent years. The report also explores market dynamics, regulatory scenarios, and technological advancements that are shaping the industry. It assesses the impact of external factors and global economic changes on market growth. Lastly, it provides strategic recommendations for new entrants and established companies to navigate the complexities of the market.
Future Outlook
- Demand for immersive cultural and historical experiences will continue to rise globally.
- Digital platforms will drive higher adoption of online bookings for heritage tours.
- Investments in site preservation and restoration will strengthen long-term tourism potential.
- Younger travelers will increasingly seek experiential and educational heritage packages.
- Governments will expand promotion of lesser-known heritage destinations to attract visitors.
- Integration of AR and VR tools will enhance visitor engagement and site accessibility.
- Sustainable and responsible tourism practices will shape future operator strategies.
- Cross-border collaborations will boost multi-destination heritage travel itineraries.
- Growing middle-class populations in Asia will create strong domestic heritage demand.
- Partnerships between local communities and global operators will enhance authenticity and growth.


