CHAPTER NO. 1 : INTRODUCTION 29
1.1.1. Report Description 29
Purpose of the Report 29
USP & Key Offerings 29
1.1.2. Key Benefits for Stakeholders 29
1.1.3. Target Audience 30
1.1.4. Report Scope 30
1.1.5. Regional Scope 31
CHAPTER NO. 2 : EXECUTIVE SUMMARY 32
2.1. Industrial Solvents Market Snapshot 32
2.1.1. Global Industrial Solvents Market, 2018 – 2032 (USD Million) 33
CHAPTER NO. 3 : GEOPOLITICAL CRISIS IMPACT ANALYSIS 34
3.1. Russia-Ukraine and Israel-Palestine War Impacts 34
CHAPTER NO. 4 : INDUSTRIAL SOLVENTS MARKET – INDUSTRY ANALYSIS 35
4.1. Introduction 35
4.2. Market Drivers 36
4.2.1. Rising demand for eco-friendly and bio-based solvents 36
4.2.2. Rising demand for eco-friendly and bio-based solvents 37
4.3. Market Restraints 38
4.3.1. Stringent environmental regulations regarding the use of volatile organic compounds (VOCs) 38
4.4. Market Opportunities 39
4.4.1. Innovations in green chemistry to develop sustainable solvent alternatives 39
4.5. Porter’s Five Forces Analysis 40
4.6. Value Chain Analysis 41
4.7. Buying Criteria 42
CHAPTER NO. 5 : IMPORT EXPORT ANALYSIS 43
5.1. Import Analysis by Region 43
5.1.1. Global Industrial Solvents Market Import Volume/Revenue, By Region, 2018 – 2023 43
5.2. Export Analysis by Region 44
5.2.1. Global Industrial Solvents Market Export Volume/Revenue, By Region, 2018 – 2023 44
CHAPTER NO. 6 : DEMAND SUPPLY ANALYSIS 45
6.1. Demand Analysis by Region 45
6.1.1. Global Industrial Solvents Market Demand Volume/Revenue, By Region, 2018 – 2023 45
6.2. Supply Analysis by Region 46
6.2.1. Global Industrial Solvents Market Supply Volume/Revenue, By Region, 2018 – 2023 46
CHAPTER NO. 7 : PRODUCTION ANALYSIS 47
7.1. Production Analysis by Region 47
7.1.1. Global Industrial Solvents Market Production Volume/Revenue, By Region, 2018 – 2023 47
CHAPTER NO. 8 : PRICE ANALYSIS 48
8.1. Price Analysis by Region 48
8.1.1. Global Industrial Solvents Market Price, By Region, 2018 – 2023 48
8.1.2. Global Type Market Price, By Region, 2018 – 2023 48
8.2. Price Analysis by Type 49
8.2.1. Global Industrial Solvents Market Price, By Type, 2018 – 2023 49
8.2.2. Global Type Market Price, By Type, 2018 – 2023 49
CHAPTER NO. 9 : RAW MATERIALS ANALYSIS 50
9.1. Key Raw Materials and Suppliers 50
9.2. Key Raw Materials Price Trend 50
CHAPTER NO. 10 : MANUFACTURING COST ANALYSIS 51
10.1. Manufacturing Cost Analysis 51
10.2. Manufacturing Process 51
CHAPTER NO. 11 : ANALYSIS COMPETITIVE LANDSCAPE 52
11.1. Company Market Share Analysis – 2023 52
11.1.1. Global Industrial Solvents Market: Company Market Share, by Volume, 2023 52
11.1.2. Global Industrial Solvents Market: Company Market Share, by Revenue, 2023 53
11.1.3. Global Industrial Solvents Market: Top 6 Company Market Share, by Revenue, 2023 53
11.1.4. Global Industrial Solvents Market: Top 3 Company Market Share, by Revenue, 2023 54
11.2. Global Industrial Solvents Market Company Volume Market Share, 2023 55
11.3. Global Industrial Solvents Market Company Revenue Market Share, 2023 56
11.4. Company Assessment Metrics, 2023 56
11.4.1. Stars 56
11.4.2. Emerging Leaders 56
11.4.3. Pervasive Players 56
11.4.4. Participants 56
11.5. Start-ups /SMEs Assessment Metrics, 2023 56
11.5.1. Progressive Companies 56
11.5.2. Responsive Companies 57
11.5.3. Dynamic Companies 57
11.5.4. Starting Blocks 57
11.6. Strategic Developments 58
11.6.1. Acquisitions & Mergers 58
New Product Launch 58
Regional Expansion 58
11.7. Key Players Product Matrix 59
CHAPTER NO. 12 : PESTEL & ADJACENT MARKET ANALYSIS 60
12.1. PESTEL 60
12.1.1. Political Factors 60
12.1.2. Economic Factors 60
12.1.3. Social Factors 60
12.1.4. Technological Factors 60
12.1.5. Environmental Factors 60
12.1.6. Legal Factors 60
12.2. Adjacent Market Analysis 60
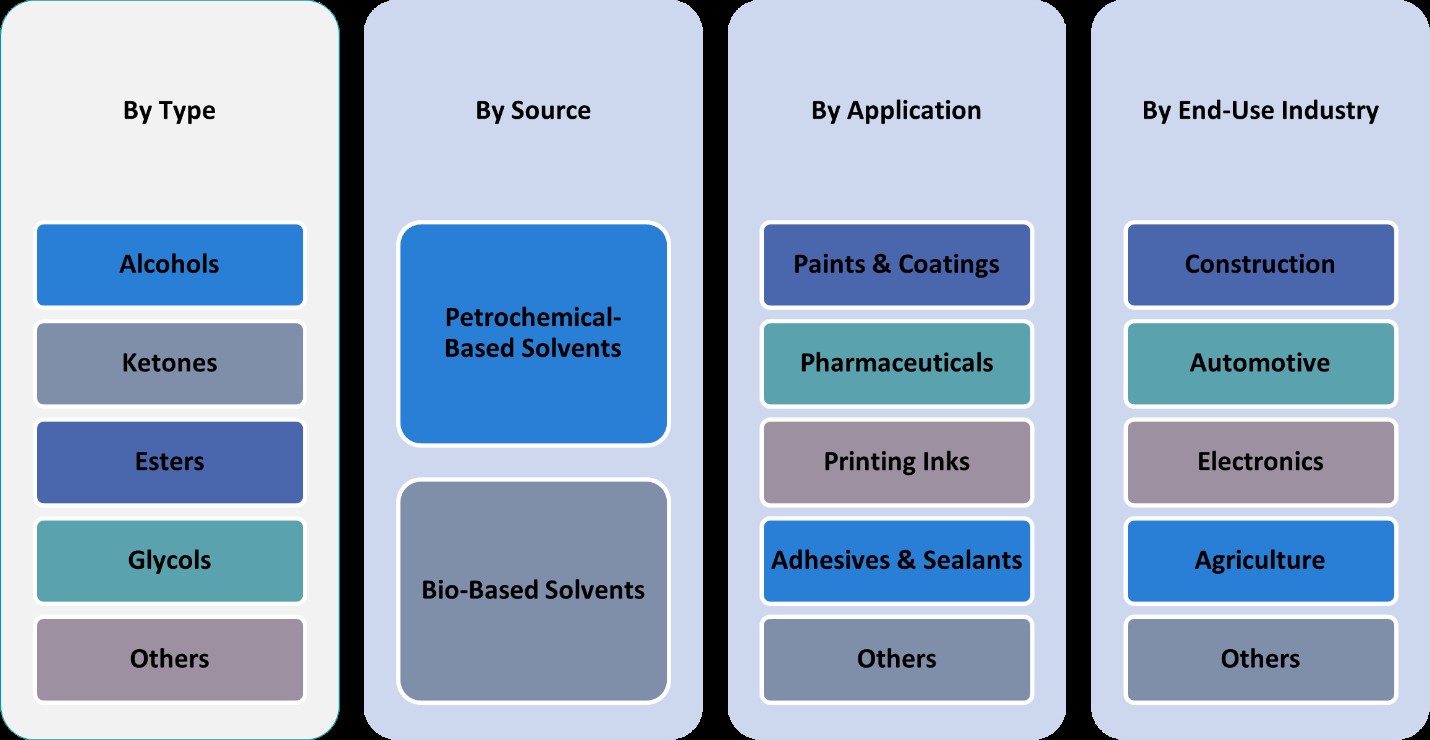
CHAPTER NO. 13 : INDUSTRIAL SOLVENTS MARKET – BY TYPE SEGMENT ANALYSIS 61
13.1. Industrial Solvents Market Overview, by Type Segment 61
13.1.1. Industrial Solvents Market Revenue Share, By Type, 2023 & 2032 62
13.1.2. Industrial Solvents Market Attractiveness Analysis, By Type 63
13.1.3. Incremental Revenue Growth Opportunity, by Type, 2024 – 2032 63
13.1.4. Industrial Solvents Market Revenue, By Type, 2018, 2023, 2027 & 2032 64
13.2. Alcohols 65
13.2.1. Global Alcohols Industrial Solvents Market Revenue, By Region, 2018 – 2023 (USD Million) 66
13.2.2. Global Alcohols Industrial Solvents Market Revenue, By Region, 2024 – 2032 (USD Million) 66
13.3. Ketones 67
13.3.1. Global Ketones Industrial Solvents Market Revenue, By Region, 2018 – 2023 (USD Million) 68
13.3.2. Global Ketones Industrial Solvents Market Revenue, By Region, 2024 – 2032 (USD Million) 68
13.4. Esters 69
13.4.1. Global Esters Industrial Solvents Market Revenue, By Region, 2018 – 2023 (USD Million) 70
13.4.2. Global Esters Industrial Solvents Market Revenue, By Region, 2024 – 2032 (USD Million) 70
13.5. Glycols 71
13.5.1. Global Glycols Industrial Solvents Market Revenue, By Region, 2018 – 2023 (USD Million) 72
13.5.2. Global Glycols Industrial Solvents Market Revenue, By Region, 2024 – 2032 (USD Million) 72
13.6. Others 73
13.6.1. Global Others Industrial Solvents Market Revenue, By Region, 2018 – 2023 (USD Million) 74
13.6.2. Global Others Industrial Solvents Market Revenue, By Region, 2024 – 2032 (USD Million) 74
CHAPTER NO. 14 : INDUSTRIAL SOLVENTS MARKET – BY APPLICATION SEGMENT ANALYSIS 75
14.1. Industrial Solvents Market Overview, by Application Segment 75
14.1.1. Industrial Solvents Market Revenue Share, By Application, 2023 & 2032 76
14.1.2. Industrial Solvents Market Attractiveness Analysis, By Application 77
14.1.3. Incremental Revenue Growth Opportunity, by Application, 2024 – 2032 77
14.1.4. Industrial Solvents Market Revenue, By Application, 2018, 2023, 2027 & 2032 78
14.2. Paints & Coatings 79
14.2.1. Global Paints & Coatings Industrial Solvents Market Revenue, By Region, 2018 – 2023 (USD Million) 80
14.2.2. Global Paints & Coatings Industrial Solvents Market Revenue, By Region, 2024 – 2032 (USD Million) 80
14.3. Pharmaceuticals 81
14.3.1. Global Pharmaceuticals Industrial Solvents Market Revenue, By Region, 2018 – 2023 (USD Million) 82
14.3.2. Global Pharmaceuticals Industrial Solvents Market Revenue, By Region, 2024 – 2032 (USD Million) 82
14.4. Printing Inks 83
14.4.1. Global Printing Inks Industrial Solvents Market Revenue, By Region, 2018 – 2023 (USD Million) 84
14.4.2. Global Printing Inks Industrial Solvents Market Revenue, By Region, 2024 – 2032 (USD Million) 84
14.5. Adhesives & Sealants 85
14.5.1. Global Adhesives & Sealants Industrial Solvents Market Revenue, By Region, 2018 – 2023 (USD Million) 86
14.5.2. Global Adhesives & Sealants Industrial Solvents Market Revenue, By Region, 2024 – 2032 (USD Million) 86
14.6. Others 87
14.6.1. Global Others Industrial Solvents Market Revenue, By Region, 2018 – 2023 (USD Million) 88
14.6.2. Global Others Industrial Solvents Market Revenue, By Region, 2024 – 2032 (USD Million) 88
CHAPTER NO. 15 : INDUSTRIAL SOLVENTS MARKET – BY END-USE INDUSTRY SEGMENT ANALYSIS 89
15.1. Industrial Solvents Market Overview, by End-Use Industry Segment 89
15.1.1. Industrial Solvents Market Revenue Share, By End-Use Industry, 2023 & 2032 90
15.1.2. Industrial Solvents Market Attractiveness Analysis, By End-Use Industry 91
15.1.3. Incremental Revenue Growth Opportunity, by End-Use Industry, 2024 – 2032 91
15.1.4. Industrial Solvents Market Revenue, By End-Use Industry, 2018, 2023, 2027 & 2032 92
15.2. Construction 93
15.2.1. Global Construction Industrial Solvents Market Revenue, By Region, 2018 – 2023 (USD Million) 94
15.2.2. Global Construction Industrial Solvents Market Revenue, By Region, 2024 – 2032 (USD Million) 94
15.3. Automotive 95
15.3.1. Global Automotive Industrial Solvents Market Revenue, By Region, 2018 – 2023 (USD Million) 96
15.3.2. Global Automotive Industrial Solvents Market Revenue, By Region, 2024 – 2032 (USD Million) 96
15.4. Electronics 97
15.4.1. Global Electronics Industrial Solvents Market Revenue, By Region, 2018 – 2023 (USD Million) 98
15.4.2. Global Electronics Industrial Solvents Market Revenue, By Region, 2024 – 2032 (USD Million) 98
15.5. Agriculture 99
15.5.1. Global Agriculture Industrial Solvents Market Revenue, By Region, 2018 – 2023 (USD Million) 100
15.5.2. Global Agriculture Industrial Solvents Market Revenue, By Region, 2024 – 2032 (USD Million) 100
15.6. Others 101
15.6.1. Global Others Industrial Solvents Market Revenue, By Region, 2018 – 2023 (USD Million) 102
15.6.2. Global Others Industrial Solvents Market Revenue, By Region, 2024 – 2032 (USD Million) 102
CHAPTER NO. 16 : INDUSTRIAL SOLVENTS MARKET – BY SOURCE SEGMENT ANALYSIS 103
16.1. Industrial Solvents Market Overview, by Source Segment 103
16.1.1. Industrial Solvents Market Revenue Share, By Source, 2023 & 2032 104
16.1.2. Industrial Solvents Market Attractiveness Analysis, By Source 105
16.1.3. Incremental Revenue Growth Opportunity, by Source, 2024 – 2032 105
16.1.4. Industrial Solvents Market Revenue, By Source, 2018, 2023, 2027 & 2032 106
16.2. Petrochemical-Based Solvents 107
16.2.1. Global Petrochemical-Based Solvents Industrial Solvents Market Revenue, By Region, 2018 – 2023 (USD Million) 108
16.2.2. Global Petrochemical-Based Solvents Industrial Solvents Market Revenue, By Region, 2024 – 2032 (USD Million) 108
16.3. Bio-Based Solvents 109
16.3.1. Global Bio-Based Solvents Industrial Solvents Market Revenue, By Region, 2018 – 2023 (USD Million) 110
16.3.2. Global Bio-Based Solvents Industrial Solvents Market Revenue, By Region, 2024 – 2032 (USD Million) 110
CHAPTER NO. 17 : INDUSTRIAL SOLVENTS MARKET – REGIONAL ANALYSIS 111
17.1. Industrial Solvents Market Overview, by Regional Segments 111
17.2. Region 112
17.2.1. Global Industrial Solvents Market Revenue Share, By Region, 2023 & 2032 112
17.2.2. Industrial Solvents Market Attractiveness Analysis, By Region 113
17.2.3. Incremental Revenue Growth Opportunity, by Region, 2024 – 2032 113
17.2.4. Industrial Solvents Market Revenue, By Region, 2018, 2023, 2027 & 2032 114
17.2.5. Global Industrial Solvents Market Revenue, By Region, 2018 – 2023 (USD Million) 115
17.2.6. Global Industrial Solvents Market Revenue, By Region, 2024 – 2032 (USD Million) 115
17.3. Type 116
17.3.1. Global Industrial Solvents Market Revenue, By Type, 2018 – 2023 (USD Million) 116
17.4. Global Industrial Solvents Market Revenue, By Type, 2024 – 2032 (USD Million) 116
17.5. Application 117
17.5.1. Global Industrial Solvents Market Revenue, By Application, 2018 – 2023 (USD Million) 117
17.5.2. Global Industrial Solvents Market Revenue, By Application, 2024 – 2032 (USD Million) 117
17.6. End-Use Industry 118
17.6.1. Global Industrial Solvents Market Revenue, By End-Use Industry, 2018 – 2023 (USD Million) 118
17.6.2. Global Industrial Solvents Market Revenue, By End-Use Industry, 2024 – 2032 (USD Million) 118
17.7. Source 119
17.7.1. Global Industrial Solvents Market Revenue, By Source, 2018 – 2023 (USD Million) 119
17.7.2. Global Industrial Solvents Market Revenue, By Source, 2024 – 2032 (USD Million) 119
CHAPTER NO. 18 : INDUSTRIAL SOLVENTS MARKET – NORTH AMERICA 120
18.1. North America 120
18.1.1. Key Highlights 120
18.1.2. North America Industrial Solvents Market Revenue, By Country, 2018 – 2023 (USD Million) 121
18.1.3. North America Industrial Solvents Market Revenue, By Type, 2018 – 2023 (USD Million) 122
18.1.4. North America Industrial Solvents Market Revenue, By Application, 2018 – 2023 (USD Million) 123
18.1.5. North America Industrial Solvents Market Revenue, By End-Use Industry, 2018 – 2023 (USD Million) 124
18.1.6. North America Industrial Solvents Market Revenue, By Source, 2018 – 2023 (USD Million) 125
18.2. U.S. 126
18.3. Canada 126
18.4. Mexico 126
CHAPTER NO. 19 : INDUSTRIAL SOLVENTS MARKET – EUROPE 127
19.1. Europe 127
19.1.1. Key Highlights 127
19.1.2. Europe Industrial Solvents Market Revenue, By Country, 2018 – 2023 (USD Million) 128
19.1.3. Europe Industrial Solvents Market Revenue, By Type, 2018 – 2023 (USD Million) 129
19.1.4. Europe Industrial Solvents Market Revenue, By Application, 2018 – 2023 (USD Million) 130
19.1.5. Europe Industrial Solvents Market Revenue, By End-Use Industry, 2018 – 2023 (USD Million) 131
19.1.6. Europe Industrial Solvents Market Revenue, By Source, 2018 – 2023 (USD Million) 132
19.2. UK 133
19.3. France 133
19.4. Germany 133
19.5. Italy 133
19.6. Spain 133
19.7. Russia 133
19.8. Belgium 133
19.9. Netherland 133
19.10. Austria 133
19.11. Sweden 133
19.12. Poland 133
19.13. Denmark 133
19.14. Switzerland 133
19.15. Rest of Europe 133
CHAPTER NO. 20 : INDUSTRIAL SOLVENTS MARKET – ASIA PACIFIC 134
20.1. Asia Pacific 134
20.1.1. Key Highlights 134
20.1.2. Asia Pacific Industrial Solvents Market Revenue, By Country, 2018 – 2023 (USD Million) 135
20.1.3. Asia Pacific Industrial Solvents Market Revenue, By Type, 2018 – 2023 (USD Million) 136
20.1.4. Asia Pacific Industrial Solvents Market Revenue, By Application, 2018 – 2023 (USD Million) 137
20.1.5. Asia Pacific Industrial Solvents Market Revenue, By End-Use Industry, 2018 – 2023 (USD Million) 138
20.1.6. Asia Pacific Industrial Solvents Market Revenue, By Source, 2018 – 2023 (USD Million) 139
20.2. China 140
20.3. Japan 140
20.4. South Korea 140
20.5. India 140
20.6. Australia 140
20.7. Thailand 140
20.8. Indonesia 140
20.9. Vietnam 140
20.10. Malaysia 140
20.11. Philippines 140
20.12. Taiwan 140
20.13. Rest of Asia Pacific 140
CHAPTER NO. 21 : INDUSTRIAL SOLVENTS MARKET – LATIN AMERICA 141
21.1. Latin America 141
21.1.1. Key Highlights 141
21.1.2. Latin America Industrial Solvents Market Revenue, By Country, 2018 – 2023 (USD Million) 142
21.1.3. Latin America Industrial Solvents Market Revenue, By Type, 2018 – 2023 (USD Million) 143
21.1.4. Latin America Industrial Solvents Market Revenue, By Application, 2018 – 2023 (USD Million) 144
21.1.5. Latin America Industrial Solvents Market Revenue, By End-Use Industry, 2018 – 2023 (USD Million) 145
21.1.6. Latin America Industrial Solvents Market Revenue, By Source, 2018 – 2023 (USD Million) 146
21.2. Brazil 147
21.3. Argentina 147
21.4. Peru 147
21.5. Chile 147
21.6. Colombia 147
21.7. Rest of Latin America 147
CHAPTER NO. 22 : INDUSTRIAL SOLVENTS MARKET – MIDDLE EAST 148
22.1. Middle East 148
22.1.1. Key Highlights 148
22.1.2. Middle East Industrial Solvents Market Revenue, By Country, 2018 – 2023 (USD Million) 149
22.1.3. Middle East Industrial Solvents Market Revenue, By Type, 2018 – 2023 (USD Million) 150
22.1.4. Middle East Industrial Solvents Market Revenue, By Application, 2018 – 2023 (USD Million) 151
22.1.5. Middle East Industrial Solvents Market Revenue, By End-Use Industry, 2018 – 2023 (USD Million) 152
22.1.6. Middle East Industrial Solvents Market Revenue, By Source, 2018 – 2023 (USD Million) 153
22.2. UAE 154
22.3. KSA 154
22.4. Israel 154
22.5. Turkey 154
22.6. Iran 154
22.7. Rest of Middle East 154
CHAPTER NO. 23 : INDUSTRIAL SOLVENTS MARKET – AFRICA 155
23.1. Africa 155
23.1.1. Key Highlights 155
23.1.2. Africa Industrial Solvents Market Revenue, By Country, 2018 – 2023 (USD Million) 156
23.1.3. Africa Industrial Solvents Market Revenue, By Type, 2018 – 2023 (USD Million) 157
23.1.4. Africa Industrial Solvents Market Revenue, By Application, 2018 – 2023 (USD Million) 158
23.1.5. Africa Industrial Solvents Market Revenue, By End-Use Industry, 2018 – 2023 (USD Million) 159
23.1.6. Africa Industrial Solvents Market Revenue, By Source, 2018 – 2023 (USD Million) 160
23.2. Egypt 161
23.3. Nigeria 161
23.4. Algeria 161
23.5. Morocco 161
23.6. Rest of Africa 161
CHAPTER NO. 24 : COMPANY PROFILES 162
24.1. BASF SE 162
24.1.1. Company Overview 162
24.1.2. Product Portfolio 162
24.1.3. Swot Analysis 162
24.1.4. Business Strategy 163
24.1.5. Financial Overview 163
24.2. Dow Inc. 164
24.3. ExxonMobil Corporation 164
24.4. Shell Chemicals 164
24.5. LyondellBasell Industries 164
24.6. Solvay S.A. 164
24.7. Eastman Chemical Company 164
24.8. INEOS Group 164
24.9. Arkema S.A. 164
24.10. Ashland Global Holdings Inc. 164
List of Figures
FIG NO. 1. Global Industrial Solvents Market Revenue, 2018 – 2032 (USD Million) 33
FIG NO. 2. Porter’s Five Forces Analysis for Global Industrial Solvents Market 40
FIG NO. 3. Value Chain Analysis for Global Industrial Solvents Market 41
FIG NO. 4. Global Industrial Solvents Market Import Volume/Revenue, By Region, 2018 – 2023 43
FIG NO. 5. Global Industrial Solvents Market Export Volume/Revenue, By Region, 2018 – 2023 44
FIG NO. 6. Global Industrial Solvents Market Demand Volume/Revenue, By Region, 2018 – 2023 45
FIG NO. 7. Global Industrial Solvents Market Supply Volume/Revenue, By Region, 2018 – 2023 46
FIG NO. 8. Global Industrial Solvents Market Production Volume/Revenue, By Region, 2018 – 2023 47
FIG NO. 9. Global Industrial Solvents Market Price, By Region, 2018 – 2023 48
FIG NO. 10. Global Industrial Solvents Market Price, By Type, 2018 – 2023 49
FIG NO. 11. Raw Materials Price Trend Analysis, 2018 – 2023 50
FIG NO. 12. Manufacturing Cost Analysis 51
FIG NO. 13. Manufacturing Process 51
FIG NO. 14. Company Share Analysis, 2023 52
FIG NO. 15. Company Share Analysis, 2023 53
FIG NO. 16. Company Share Analysis, 2023 53
FIG NO. 17. Company Share Analysis, 2023 54
FIG NO. 18. Industrial Solvents Market – Company Volume Market Share, 2023 55
FIG NO. 19. Industrial Solvents Market – Company Revenue Market Share, 2023 56
FIG NO. 20. Industrial Solvents Market Revenue Share, By Type, 2023 & 2032 62
FIG NO. 21. Market Attractiveness Analysis, By Type 63
FIG NO. 22. Incremental Revenue Growth Opportunity by Type, 2024 – 2032 63
FIG NO. 23. Industrial Solvents Market Revenue, By Type, 2018, 2023, 2027 & 2032 64
FIG NO. 24. Global Industrial Solvents Market for Alcohols, Revenue (USD Million) 2018 – 2032 65
FIG NO. 25. Global Industrial Solvents Market for Ketones, Revenue (USD Million) 2018 – 2032 67
FIG NO. 26. Global Industrial Solvents Market for Esters, Revenue (USD Million) 2018 – 2032 69
FIG NO. 27. Global Industrial Solvents Market for Glycols, Revenue (USD Million) 2018 – 2032 71
FIG NO. 28. Global Industrial Solvents Market for Others, Revenue (USD Million) 2018 – 2032 73
FIG NO. 29. Industrial Solvents Market Revenue Share, By Application, 2023 & 2032 76
FIG NO. 30. Market Attractiveness Analysis, By Application 77
FIG NO. 31. Incremental Revenue Growth Opportunity by Application, 2024 – 2032 77
FIG NO. 32. Industrial Solvents Market Revenue, By Application, 2018, 2023, 2027 & 2032 78
FIG NO. 33. Global Industrial Solvents Market for Paints & Coatings, Revenue (USD Million) 2018 – 2032 79
FIG NO. 34. Global Industrial Solvents Market for Pharmaceuticals, Revenue (USD Million) 2018 – 2032 81
FIG NO. 35. Global Industrial Solvents Market for Printing Inks, Revenue (USD Million) 2018 – 2032 83
FIG NO. 36. Global Industrial Solvents Market for Adhesives & Sealants, Revenue (USD Million) 2018 – 2032 85
FIG NO. 37. Global Industrial Solvents Market for Others, Revenue (USD Million) 2018 – 2032 87
FIG NO. 38. Industrial Solvents Market Revenue Share, By End-Use Industry, 2023 & 2032 90
FIG NO. 39. Market Attractiveness Analysis, By End-Use Industry 91
FIG NO. 40. Incremental Revenue Growth Opportunity by End-Use Industry, 2024 – 2032 91
FIG NO. 41. Industrial Solvents Market Revenue, By End-Use Industry, 2018, 2023, 2027 & 2032 92
FIG NO. 42. Global Industrial Solvents Market for Construction, Revenue (USD Million) 2018 – 2032 93
FIG NO. 43. Global Industrial Solvents Market for Automotive, Revenue (USD Million) 2018 – 2032 95
FIG NO. 44. Global Industrial Solvents Market for Electronics, Revenue (USD Million) 2018 – 2032 97
FIG NO. 45. Global Industrial Solvents Market for Agriculture, Revenue (USD Million) 2018 – 2032 99
FIG NO. 46. Global Industrial Solvents Market for Others, Revenue (USD Million) 2018 – 2032 101
FIG NO. 47. Industrial Solvents Market Revenue Share, By Source, 2023 & 2032 104
FIG NO. 48. Market Attractiveness Analysis, By Source 105
FIG NO. 49. Incremental Revenue Growth Opportunity by Source, 2024 – 2032 105
FIG NO. 50. Industrial Solvents Market Revenue, By Source, 2018, 2023, 2027 & 2032 106
FIG NO. 51. Global Industrial Solvents Market for Petrochemical-Based Solvents, Revenue (USD Million) 2018 – 2032 107
FIG NO. 52. Global Industrial Solvents Market for Bio-Based Solvents, Revenue (USD Million) 2018 – 2032 109
FIG NO. 53. Global Industrial Solvents Market Revenue Share, By Region, 2023 & 2032 112
FIG NO. 54. Market Attractiveness Analysis, By Region 113
FIG NO. 55. Incremental Revenue Growth Opportunity by Region, 2024 – 2032 113
FIG NO. 56. Industrial Solvents Market Revenue, By Region, 2018, 2023, 2027 & 2032 114
FIG NO. 57. North America Industrial Solvents Market Revenue, 2018 – 2032 (USD Million) 120
FIG NO. 58. Europe Industrial Solvents Market Revenue, 2018 – 2032 (USD Million) 127
FIG NO. 59. Asia Pacific Industrial Solvents Market Revenue, 2018 – 2032 (USD Million) 134
FIG NO. 60. Latin America Industrial Solvents Market Revenue, 2018 – 2032 (USD Million) 141
FIG NO. 61. Middle East Industrial Solvents Market Revenue, 2018 – 2032 (USD Million) 148
FIG NO. 62. Africa Industrial Solvents Market Revenue, 2018 – 2032 (USD Million) 155
List of Tables
TABLE NO. 1. : Global Industrial Solvents Market: Snapshot 31
TABLE NO. 2. : Drivers for the Industrial Solvents Market: Impact Analysis 35
TABLE NO. 3. : Restraints for the Industrial Solvents Market: Impact Analysis 37
TABLE NO. 4. : Global Industrial Solvents Market Revenue, By Region, 2018 – 2023 47
TABLE NO. 5. : Global Industrial Solvents Market Revenue, By Type, 2018 – 2023 48
TABLE NO. 6. : Key Raw Materials & Suppliers 49
TABLE NO. 7. : Global Alcohols Industrial Solvents Market Revenue, By Region, 2018 – 2023 (USD Million) 65
TABLE NO. 8. : Global Alcohols Industrial Solvents Market Revenue, By Region, 2024 – 2032 (USD Million) 65
TABLE NO. 9. : Global Ketones Industrial Solvents Market Revenue, By Region, 2018 – 2023 (USD Million) 67
TABLE NO. 10. : Global Ketones Industrial Solvents Market Revenue, By Region, 2024 – 2032 (USD Million) 67
TABLE NO. 11. : Global Esters Industrial Solvents Market Revenue, By Region, 2018 – 2023 (USD Million) 69
TABLE NO. 12. : Global Esters Industrial Solvents Market Revenue, By Region, 2024 – 2032 (USD Million) 69
TABLE NO. 13. : Global Glycols Industrial Solvents Market Revenue, By Region, 2018 – 2023 (USD Million) 71
TABLE NO. 14. : Global Glycols Industrial Solvents Market Revenue, By Region, 2024 – 2032 (USD Million) 71
TABLE NO. 15. : Global Others Industrial Solvents Market Revenue, By Region, 2018 – 2023 (USD Million) 73
TABLE NO. 16. : Global Others Industrial Solvents Market Revenue, By Region, 2024 – 2032 (USD Million) 73
TABLE NO. 17. : Global Paints & Coatings Industrial Solvents Market Revenue, By Region, 2018 – 2023 (USD Million) 79
TABLE NO. 18. : Global Paints & Coatings Industrial Solvents Market Revenue, By Region, 2024 – 2032 (USD Million) 79
TABLE NO. 19. : Global Pharmaceuticals Industrial Solvents Market Revenue, By Region, 2018 – 2023 (USD Million) 81
TABLE NO. 20. : Global Pharmaceuticals Industrial Solvents Market Revenue, By Region, 2024 – 2032 (USD Million) 81
TABLE NO. 21. : Global Printing Inks Industrial Solvents Market Revenue, By Region, 2018 – 2023 (USD Million) 83
TABLE NO. 22. : Global Printing Inks Industrial Solvents Market Revenue, By Region, 2024 – 2032 (USD Million) 83
TABLE NO. 23. : Global Adhesives & Sealants Industrial Solvents Market Revenue, By Region, 2018 – 2023 (USD Million) 85
TABLE NO. 24. : Global Adhesives & Sealants Industrial Solvents Market Revenue, By Region, 2024 – 2032 (USD Million) 85
TABLE NO. 25. : Global Others Industrial Solvents Market Revenue, By Region, 2018 – 2023 (USD Million) 87
TABLE NO. 26. : Global Others Industrial Solvents Market Revenue, By Region, 2024 – 2032 (USD Million) 87
TABLE NO. 27. : Global Construction Industrial Solvents Market Revenue, By Region, 2018 – 2023 (USD Million) 93
TABLE NO. 28. : Global Construction Industrial Solvents Market Revenue, By Region, 2024 – 2032 (USD Million) 93
TABLE NO. 29. : Global Automotive Industrial Solvents Market Revenue, By Region, 2018 – 2023 (USD Million) 95
TABLE NO. 30. : Global Automotive Industrial Solvents Market Revenue, By Region, 2024 – 2032 (USD Million) 95
TABLE NO. 31. : Global Electronics Industrial Solvents Market Revenue, By Region, 2018 – 2023 (USD Million) 97
TABLE NO. 32. : Global Electronics Industrial Solvents Market Revenue, By Region, 2024 – 2032 (USD Million) 97
TABLE NO. 33. : Global Agriculture Industrial Solvents Market Revenue, By Region, 2018 – 2023 (USD Million) 99
TABLE NO. 34. : Global Agriculture Industrial Solvents Market Revenue, By Region, 2024 – 2032 (USD Million) 99
TABLE NO. 35. : Global Others Industrial Solvents Market Revenue, By Region, 2018 – 2023 (USD Million) 101
TABLE NO. 36. : Global Others Industrial Solvents Market Revenue, By Region, 2024 – 2032 (USD Million) 101
TABLE NO. 37. : Global Petrochemical-Based Solvents Industrial Solvents Market Revenue, By Region, 2018 – 2023 (USD Million) 107
TABLE NO. 38. : Global Petrochemical-Based Solvents Industrial Solvents Market Revenue, By Region, 2024 – 2032 (USD Million) 107
TABLE NO. 39. : Global Bio-Based Solvents Industrial Solvents Market Revenue, By Region, 2018 – 2023 (USD Million) 109
TABLE NO. 40. : Global Bio-Based Solvents Industrial Solvents Market Revenue, By Region, 2024 – 2032 (USD Million) 109
TABLE NO. 41. : Global Industrial Solvents Market Revenue, By Region, 2018 – 2023 (USD Million) 114
TABLE NO. 42. : Global Industrial Solvents Market Revenue, By Region, 2024 – 2032 (USD Million) 114
TABLE NO. 43. : Global Industrial Solvents Market Revenue, By Type, 2018 – 2023 (USD Million) 115
TABLE NO. 44. : Global Industrial Solvents Market Revenue, By Type, 2024 – 2032 (USD Million) 115
TABLE NO. 45. : Global Industrial Solvents Market Revenue, By Application, 2018 – 2023 (USD Million) 116
TABLE NO. 46. : Global Industrial Solvents Market Revenue, By Application, 2024 – 2032 (USD Million) 116
TABLE NO. 47. : Global Industrial Solvents Market Revenue, By End-Use Industry, 2018 – 2023 (USD Million) 117
TABLE NO. 48. : Global Industrial Solvents Market Revenue, By End-Use Industry, 2024 – 2032 (USD Million) 117
TABLE NO. 49. : Global Industrial Solvents Market Revenue, By Source, 2018 – 2023 (USD Million) 118
TABLE NO. 50. : Global Industrial Solvents Market Revenue, By Source, 2024 – 2032 (USD Million) 118
TABLE NO. 51. : North America Industrial Solvents Market Revenue, By Country, 2018 – 2023 (USD Million) 120
TABLE NO. 52. : North America Industrial Solvents Market Revenue, By Country, 2024 – 2032 (USD Million) 120
TABLE NO. 53. : North America Industrial Solvents Market Revenue, By Type, 2018 – 2023 (USD Million) 121
TABLE NO. 54. : North America Industrial Solvents Market Revenue, By Type, 2024 – 2032 (USD Million) 121
TABLE NO. 55. : North America Industrial Solvents Market Revenue, By Application, 2018 – 2023 (USD Million) 122
TABLE NO. 56. : North America Industrial Solvents Market Revenue, By Application, 2024 – 2032 (USD Million) 122
TABLE NO. 57. : North America Industrial Solvents Market Revenue, By End-Use Industry, 2018 – 2023 (USD Million) 123
TABLE NO. 58. : North America Industrial Solvents Market Revenue, By End-Use Industry, 2024 – 2032 (USD Million) 123
TABLE NO. 59. : North America Industrial Solvents Market Revenue, By Source, 2018 – 2023 (USD Million) 124
TABLE NO. 60. : North America Industrial Solvents Market Revenue, By Source, 2024 – 2032 (USD Million) 124
TABLE NO. 61. : Europe Industrial Solvents Market Revenue, By Country, 2018 – 2023 (USD Million) 127
TABLE NO. 62. : Europe Industrial Solvents Market Revenue, By Country, 2024 – 2032 (USD Million) 127
TABLE NO. 63. : Europe Industrial Solvents Market Revenue, By Type, 2018 – 2023 (USD Million) 128
TABLE NO. 64. : Europe Industrial Solvents Market Revenue, By Type, 2024 – 2032 (USD Million) 128
TABLE NO. 65. : Europe Industrial Solvents Market Revenue, By Application, 2018 – 2023 (USD Million) 129
TABLE NO. 66. : Europe Industrial Solvents Market Revenue, By Application, 2024 – 2032 (USD Million) 129
TABLE NO. 67. : Europe Industrial Solvents Market Revenue, By End-Use Industry, 2018 – 2023 (USD Million) 130
TABLE NO. 68. : Europe Industrial Solvents Market Revenue, By End-Use Industry, 2024 – 2032 (USD Million) 130
TABLE NO. 69. : Europe Industrial Solvents Market Revenue, By Source, 2018 – 2023 (USD Million) 131
TABLE NO. 70. : Europe Industrial Solvents Market Revenue, By Source, 2024 – 2032 (USD Million) 131
TABLE NO. 71. : Asia Pacific Industrial Solvents Market Revenue, By Country, 2018 – 2023 (USD Million) 134
TABLE NO. 72. : Asia Pacific Industrial Solvents Market Revenue, By Country, 2024 – 2032 (USD Million) 134
TABLE NO. 73. : Asia Pacific Industrial Solvents Market Revenue, By Type, 2018 – 2023 (USD Million) 135
TABLE NO. 74. : Asia Pacific Industrial Solvents Market Revenue, By Type, 2024 – 2032 (USD Million) 135
TABLE NO. 75. : Asia Pacific Industrial Solvents Market Revenue, By Application, 2018 – 2023 (USD Million) 136
TABLE NO. 76. : Asia Pacific Industrial Solvents Market Revenue, By Application, 2024 – 2032 (USD Million) 136
TABLE NO. 77. : Asia Pacific Industrial Solvents Market Revenue, By End-Use Industry, 2018 – 2023 (USD Million) 137
TABLE NO. 78. : Asia Pacific Industrial Solvents Market Revenue, By End-Use Industry, 2024 – 2032 (USD Million) 137
TABLE NO. 79. : Asia Pacific Industrial Solvents Market Revenue, By Source, 2018 – 2023 (USD Million) 138
TABLE NO. 80. : Asia Pacific Industrial Solvents Market Revenue, By Source, 2024 – 2032 (USD Million) 138
TABLE NO. 81. : Latin America Industrial Solvents Market Revenue, By Country, 2018 – 2023 (USD Million) 141
TABLE NO. 82. : Latin America Industrial Solvents Market Revenue, By Country, 2024 – 2032 (USD Million) 141
TABLE NO. 83. : Latin America Industrial Solvents Market Revenue, By Type, 2018 – 2023 (USD Million) 142
TABLE NO. 84. : Latin America Industrial Solvents Market Revenue, By Type, 2024 – 2032 (USD Million) 142
TABLE NO. 85. : Latin America Industrial Solvents Market Revenue, By Application, 2018 – 2023 (USD Million) 143
TABLE NO. 86. : Latin America Industrial Solvents Market Revenue, By Application, 2024 – 2032 (USD Million) 143
TABLE NO. 87. : Latin America Industrial Solvents Market Revenue, By End-Use Industry, 2018 – 2023 (USD Million) 144
TABLE NO. 88. : Latin America Industrial Solvents Market Revenue, By End-Use Industry, 2024 – 2032 (USD Million) 144
TABLE NO. 89. : Latin America Industrial Solvents Market Revenue, By Source, 2018 – 2023 (USD Million) 145
TABLE NO. 90. : Latin America Industrial Solvents Market Revenue, By Source, 2024 – 2032 (USD Million) 145
TABLE NO. 91. : Middle East Industrial Solvents Market Revenue, By Country, 2018 – 2023 (USD Million) 148
TABLE NO. 92. : Middle East Industrial Solvents Market Revenue, By Country, 2024 – 2032 (USD Million) 148
TABLE NO. 93. : Middle East Industrial Solvents Market Revenue, By Type, 2018 – 2023 (USD Million) 149
TABLE NO. 94. : Middle East Industrial Solvents Market Revenue, By Type, 2024 – 2032 (USD Million) 149
TABLE NO. 95. : Middle East Industrial Solvents Market Revenue, By Application, 2018 – 2023 (USD Million) 150
TABLE NO. 96. : Middle East Industrial Solvents Market Revenue, By Application, 2024 – 2032 (USD Million) 150
TABLE NO. 97. : Middle East Industrial Solvents Market Revenue, By End-Use Industry, 2018 – 2023 (USD Million) 151
TABLE NO. 98. : Middle East Industrial Solvents Market Revenue, By End-Use Industry, 2024 – 2032 (USD Million) 151
TABLE NO. 99. : Middle East Industrial Solvents Market Revenue, By Source, 2018 – 2023 (USD Million) 152
TABLE NO. 100. : Middle East Industrial Solvents Market Revenue, By Source, 2024 – 2032 (USD Million) 152
TABLE NO. 101. : Africa Industrial Solvents Market Revenue, By Country, 2018 – 2023 (USD Million) 155
TABLE NO. 102. : Africa Industrial Solvents Market Revenue, By Country, 2024 – 2032 (USD Million) 155
TABLE NO. 103. : Africa Industrial Solvents Market Revenue, By Type, 2018 – 2023 (USD Million) 156
TABLE NO. 104. : Africa Industrial Solvents Market Revenue, By Type, 2024 – 2032 (USD Million) 156
TABLE NO. 105. : Africa Industrial Solvents Market Revenue, By Application, 2018 – 2023 (USD Million) 157
TABLE NO. 106. : Africa Industrial Solvents Market Revenue, By Application, 2024 – 2032 (USD Million) 157
TABLE NO. 107. : Africa Industrial Solvents Market Revenue, By End-Use Industry, 2018 – 2023 (USD Million) 158
TABLE NO. 108. : Africa Industrial Solvents Market Revenue, By End-Use Industry, 2024 – 2032 (USD Million) 158
TABLE NO. 109. : Africa Industrial Solvents Market Revenue, By Source, 2018 – 2023 (USD Million) 159
TABLE NO. 110. : Africa Industrial Solvents Market Revenue, By Source, 2024 – 2032 (USD Million) 159