Market Overview:
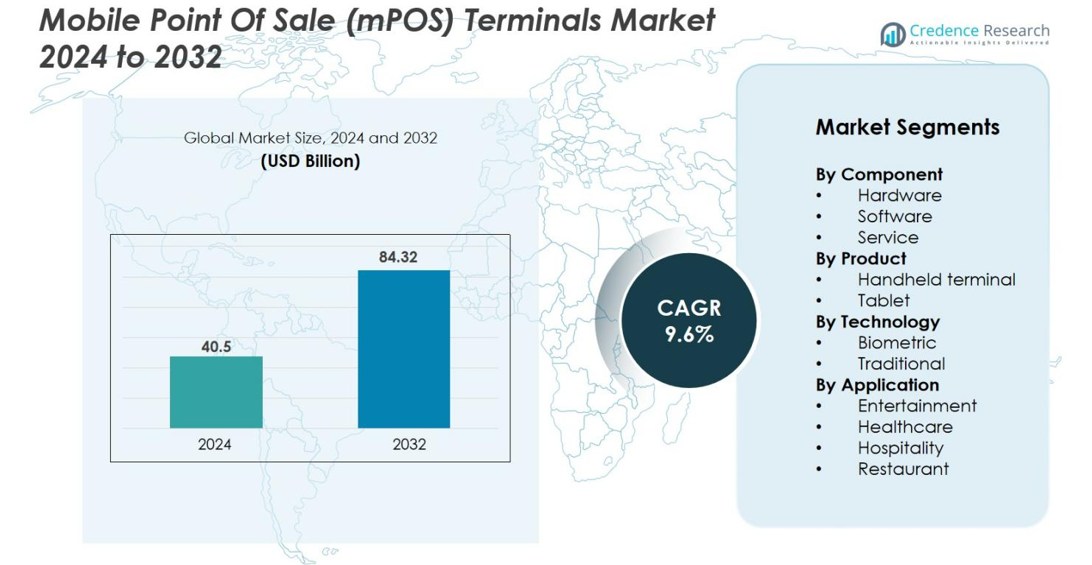
The Mobile Point of Sale (mPOS) Terminals Market size was valued at USD 40.5 billion in 2024 and is anticipated to reach USD 84.32 billion by 2032, growing at a CAGR of 9.6% during the forecast period.
| REPORT ATTRIBUTE |
DETAILS |
| Historical Period |
2020-2023 |
| Base Year |
2024 |
| Forecast Period |
2025-2032 |
| Mobile Point of Sale (mPOS) Terminals MarketSize 2024 |
USD 40.5 billion |
| Mobile Point of Sale (mPOS) Terminals Market, CAGR |
9.6% |
| Mobile Point of Sale (mPOS) Terminals Market Size 2032 |
USD 84.32 billion |
The Mobile Point of Sale (mPOS) Terminals Market is led by key players such as Square, Inc., Ingenico Group, VeriFone Systems, Inc., PAX Technology, NEC Corporation, NCR Corporation, Diebold Nixdorf, Epicor Software Corporation, Panasonic Corporation, and MICROS Systems, Inc.. These companies have established themselves through innovation in both hardware and software, with a strong focus on enhancing mobility, contactless payments, and customer analytics. In 2024, the Asia-Pacific region holds the largest market share at 30.6%, driven by high smartphone penetration and a growing number of micro-merchants adopting mobile payment solutions. Europe follows with a 24.3% share, and North America holds 13.4%, fueled by robust retail infrastructure and widespread adoption of NFC-enabled payments. The increasing integration of cloud solutions and biometric authentication is expected to further accelerate mPOS growth globally.
Market Insights
- The Mobile Point Of Sale (mPOS) Terminals Market size reached USD 40.5 billion in 2024 and is projected to grow at a CAGR of 9.6% to USD 84.32 billion by 2032.
- The hardware component segment held 63% of the market share in 2024, driven by widespread portable payment device deployment.
- Asia‑Pacific accounted for 30.6% of global market share in 2024, while Europe held 24.3% and North America 13.4%, underscoring regional dominance of digital‑payments growth.
- Cloud‑based and software‑driven mPOS solutions are gaining traction as merchants look for scalable, subscription‑based models and real‑time integrations.
- Data security concerns, fraud risk and complex ecosystem interoperability are acting as restraints that may slow down market adoption in certain regions.
Access crucial information at unmatched prices!
Request your sample report today & start making informed decisions powered by Credence Research Inc.!
Download Sample
Market Segmentation Analysis
By Component
In the component segmentation of the mPOS terminals market, the hardware sub‑segment is dominant, capturing 63% of the market share in 2024. This leadership stems from the widespread deployment of portable payment devices that enable retailers and service businesses to reduce checkout time and support mobile, contactless transactions. Key drivers include the rising acceptance of EMV chip and NFC‑enabled payments, and the proliferation of compact terminals by providers such as VeriFone Inc. and Ingenico Group. The software and service segments are gaining momentum, though hardware retains the bulk of revenue due to the immediate need for physical terminals.
- For instance, VeriFone offers a broad range of compact and rugged hardware including countertop, mobile, and portable terminals with EMV chip, NFC, and Bluetooth capabilities, widely deployed in retail and hospitality sectors.
By Product
Under the product segmentation, handheld terminals hold the lead with 45% share of the market by 2032 due to their compact form factor and suitability for mobile, curb‑side, and SMB environments. The appeal of handheld devices lies in their portability and ability to integrate card readers, mobile wallets, and business apps in one unit. In contrast, tablets are gaining traction in large‑scale retail and hospitality settings for their richer interfaces and application‑integration capabilities. The dominance of handhelds is grounded in the mobility demand from merchants seeking flexible payment processing solutions.
- For instance, handheld devices integrate card readers, mobile wallet support, and business apps in a single unit, allowing merchants to process payments on the go efficiently.
By Technology
In the technology segmentation, the traditional technology sub‑segment (i.e., conventional card readers, magnetic stripe/NFC readers) remains the dominant share, accounting for 36.8% of the market in 2024. This reflects the current prevalence of conventional and contactless payment infrastructures in merchant environments. At the same time, the biometric sub‑segment (such as fingerprint, facial recognition, etc.) is emerging fast—driven by rising concerns over fraud, regulatory mandates for secure transactions, and the demand for a seamless customer experience. While biometric’s share is still smaller, it is growing at a higher CAGR, signaling a shift toward more secure authentication technologies in mPOS systems.
Key Growth Drivers
Rapid smartphone and mobile‑connectivity penetration
The expansion of affordable smartphones and enhanced mobile connectivity underpins growth in the mPOS terminals market. As both Android and iOS devices now support mobile payment applications natively, micro‑merchants and small businesses increasingly adopt mPOS solutions with minimal infrastructure investment. This shift enables broader outreach beyond traditional retail settings into pop‑up stores, food trucks, and remote service locations. The confluence of high smartphone ownership and faster mobile networks sets the stage for accelerated mPOS uptake and drives market expansion globally.
- For instance, Android devices natively support Google Pay, while iOS devices natively support Apple Pay, enabling micro-merchants and small businesses to adopt mPOS solutions with minimal setup costs.
Surge in digital payments and contactless transactions
The increasing consumer preference for contactless payments, digital wallets and cashless commerce is a strong growth driver for the mPOS terminals market. Businesses are responding by deploying mobile POS solutions that support NFC, QR‑code and biometric methods to meet evolving payment behaviour. This trend is reinforced by regulatory mandates and cash‑reduction strategies across regions. As consumers demand faster, seamless checkout experiences, merchants invest in mPOS hardware and software to enable omnichannel and mobile‑first payment flows, thereby expanding the market.
- For instance, India’s Unified Payments Interface (UPI) transactions surged 35% year-over-year in the first half of 2025, reaching 106.36 billion transactions, with a value of ₹143.34 trillion, driven by PIN-less and biometric innovations.
SME digitisation and business process automation
Small and medium‑sized enterprises (SMEs) are increasingly digitising their operations, which boosts demand for mPOS terminals. These systems not only handle transactions but integrate with inventory, CRM and analytics platforms, enabling streamlined operations and data‑driven insights. The need to reduce manual intervention, cut operational costs and deliver improved customer experience drives SME adoption of mPOS solutions. With many SMEs treating POS as an operating expense rather than capital investment, uptake is widening and propelling market growth.
Key Trends & Opportunities
Cloud‑based and software‑driven mPOS evolution
The transition from stand‑alone hardware to cloud‑connected and software‑driven mPOS solutions presents a major opportunity. Cloud deployments, which accounted for approximately 29.7% of the market in 2024, enable subscription models, real‑time updates, and integration with broader business systems. Merchants benefit from scalability, lower upfront costs and remote management while vendors gain recurring revenue streams. This trend opens avenues for vertical‑specific solutions, multi‑site roll‑outs and service‑oriented ecosystems, making the mPOS market ripe for innovation.
- For instance, Lightspeed Retail offers a cloud-based POS system that provides advanced inventory management and customizable reporting, enabling retailers to manage complex inventories at scale with remote oversight.
Emerging markets and underserved merchant segments
High growth potential exists in emerging regions such as Asia‑Pacific, where the market share reached about 30.6% in 2024 and continues to grow at double‑digit CAGRs. Many micro‑merchants in these regions still lack access to formal POS infrastructure, creating an opportunity for low‑cost mPOS devices and mobile‑first payment solutions. Vendors can capture new addressable markets by offering affordable terminals, enabling digital payments for street vendors, small kiosks and service providers and tapping into financial inclusion initiatives and government‑led digital‑payment programs.
- For instance, in China, tech giants Alibaba and Tencent have led QR code-based mPOS implementations, making mobile payments dominant in informal sectors.
Key Challenges
Data security, fraud and regulatory compliance
As mPOS terminals process sensitive payment and personal data, security concerns pose a major market challenge. Weak encryption, device vulnerabilities and network risks create exposure for merchants and service providers. Additionally, evolving regulatory mandates (e.g., PSD2 SCA in Europe) impose compliance burdens on both hardware and software vendors. Addressing these security and regulatory issues without eroding ease‑of‑use remains critical for market players to build trust and drive adoption.
Fragmentation and interoperability of payment ecosystems
The mPOS market faces complexity from varied hardware standards, connectivity protocols and regional regulatory frameworks. Devices must support magnetic stripe, EMV chip, NFC, QR‑code, and increasingly biometric authentication—while integrating with servers, cloud services and local banking systems. This fragmentation slows deployment and raises costs for vendors and merchants. Without standardised interoperability and streamlined certification processes, some potential users hesitate to adopt mPOS solutions, limiting market scale‑up in certain areas.
Regional Analysis
North America
The North America region accounted for a 13.4% share of the global mobile Point of Sale (mPOS) terminals market in 2024. The region’s mature retail landscape and rapid adoption of contactless payment methods drive demand for mobile and portable POS devices. Merchants increasingly integrate mPOS terminals with inventory management and CRM systems to support omnichannel operations. Large‑scale chain stores, quick‑service restaurants, and mobile services are major adopters. Regulatory compliance (such as PCI DSS and EMV) and high penetration of smartphones and NFC‑enabled cards further bolster market growth.
Europe
Europe holds a 24.3% share of the global mPOS terminals market in 2024. The region’s advanced payment infrastructure and strong merchant networks support substantial growth. The widespread deployment of cloud-connected and NFC-enabled mPOS devices is notable, especially in retail and hospitality sectors. The implementation of open-loop transit payments and POS-fiscal integration mandates across several countries accelerates terminal refresh cycles. While growth in key European countries like the UK, Germany, and France leads the way, a focus on cross-border certification and multi-currency support strengthens the region’s market presence.
Asia-Pacific
Asia-Pacific commanded a 30.6% share of the global mPOS terminals market in 2024. Rapid smartphone penetration, government-led digital payment initiatives, and high adoption among micro-merchants drive the region’s dominance. In emerging markets like India and Southeast Asia, incentives targeting small and medium enterprises spur large-scale deployment of mPOS devices. The region also leads in contactless and QR-based payment usage. Expansion in e-commerce, mobile wallets, and rural acceptance terminals contribute to the region’s sustained growth across retail, transportation, and service sectors.
Middle East & Africa (MEA)
The Middle East & Africa (MEA) region holds a 7.2% share of the global mPOS terminals market in 2024. Increasing financial inclusion programs, rising tourism, and the proliferation of mobile connectivity are key drivers in the region. Local acquirers and fintech companies are boosting adoption of low-cost handheld and smartphone-based mPOS solutions in retail and roadside services. Although the region’s current market share remains smaller compared to others, MEA is seeing rapid growth driven by the transition from cash to digital payments.
Market Segmentations
By Component
- Hardware
- Software
- Service
By Product
By Technology
By Application
- Entertainment
- Healthcare
- Hospitality
- Restaurant
By Geography
- North America
- Europe
- Germany
- France
- U.K.
- Italy
- Spain
- Rest of Europe
- Asia Pacific
- China
- Japan
- India
- South Korea
- South-east Asia
- Rest of Asia Pacific
- Latin America
- Brazil
- Argentina
- Rest of Latin America
- Middle East & Africa
- GCC Countries
- South Africa
- Rest of the Middle East and Africa
Competitive Landscape
The global mPOS terminals market features a competitive environment led by key players such as Diebold Nixdorf, Epicor Software Corporation, Ingenico Group, PAX Technology, Square, Inc. and VeriFone Systems, Inc.. These companies differentiate through hardware innovation, software‑platform enhancements and integrated service offerings, responding to evolving merchant needs for mobility, contactless payments and analytics. They maintain extensive global distribution networks and engage in strategic partnerships (for example device manufacturers aligning with acquirers) to expand market reach across regions. The competitive dynamics drive continuous product refresh cycles, especially in emerging markets where device affordability and cloud‑connectivity matter. Meanwhile, margins are pressured by commoditisation of terminal hardware, prompting vendors to shift up‑the‑stack into value‑added services such as subscription based software, analytics and managed services. As the ecosystem evolves, vendors with scalable platforms, strong security credentials and broad merchant‑acquirer linkages are best positioned to secure volume and capture recurring revenue streams.
Shape Your Report to Specific Countries or Regions & Enjoy 30% Off!
Key Player Analysis
- Square, Inc.
- PAX Technology
- Ingenico Group
- NEC Corporation
- NCR Corporation
- VeriFone Systems, Inc.
- Micros Systems, Inc.
- Panasonic Corporation
- Epicor Software Corporation
- Diebold Nixdor
Recent Developments
- In September 2025, Worldline partnered with Mypinpad to enable SoftPOS (software-based POS) acceptance on Android devices across South Asia.
- In June 2024, Posiflex Technology Inc. launched the Opera MT-6200 Series mobile POS tablets.
- In September 2024, Newland Payment Technology Ltd. expanded its European footprint by acquiring the terminal business of its partner NewNote in France and Spain.
Report Coverage
The research report offers an in-depth analysis based on Component, Product, Technology, Application and Geography. It details leading market players, providing an overview of their business, product offerings, investments, revenue streams, and key applications. Additionally, the report includes insights into the competitive environment, SWOT analysis, current market trends, as well as the primary drivers and constraints. Furthermore, it discusses various factors that have driven market expansion in recent years. The report also explores market dynamics, regulatory scenarios, and technological advancements that are shaping the industry. It assesses the impact of external factors and global economic changes on market growth. Lastly, it provides strategic recommendations for new entrants and established companies to navigate the complexities of the market.
Future Outlook
- The market will expand as small and micro‑merchants in emerging economies increasingly adopt mobile POS terminals for low‑cost payments.
- Cloud‑based and SaaS‑driven mPOS platforms will gain ground, enabling merchants to deploy terminals with minimal upfront hardware investment and rapid scalability.
- Integration of biometric authentication (such as fingerprint and facial recognition) will become more common, enhancing security and reducing fraud in mobile payment transactions.
- The continued shift from cash to contactless and mobile wallet payments will accelerate demand for mPOS terminals that support NFC, QR code and tap‑to‑pay methods.
- Hardware manufacturers will increasingly bundle value‑added services (analytics, loyalty programmes, inventory tracking) with mPOS devices to capture recurring revenue and differentiate offerings.
- Tablet‑based and smartphone‑based mPOS solutions will penetrate new environments such as home‑services, field‑sales and mobile merchants, broadening the use‑case beyond traditional retail.
- In regions with lower banking infrastructure, mPOS adoption will be driven by financial‑inclusion initiatives and government‑led digital‑payment programmes targeting unbanked populations.
- Vendors will face mounting pressure to ensure interoperability, seamless integration with acquirer/processor networks and multi‑currency support as cross‑border commerce expands.
- Amid hardware commoditisation, providers will compete on software ecosystems and subscription models; thus margins will shift from hardware sales to software and services.
- Regulatory and cybersecurity requirements will intensify, prompting mPOS vendors to invest in advanced encryption, tokenisation and certification processes to maintain compliance and merchant trust.


