Market Overview
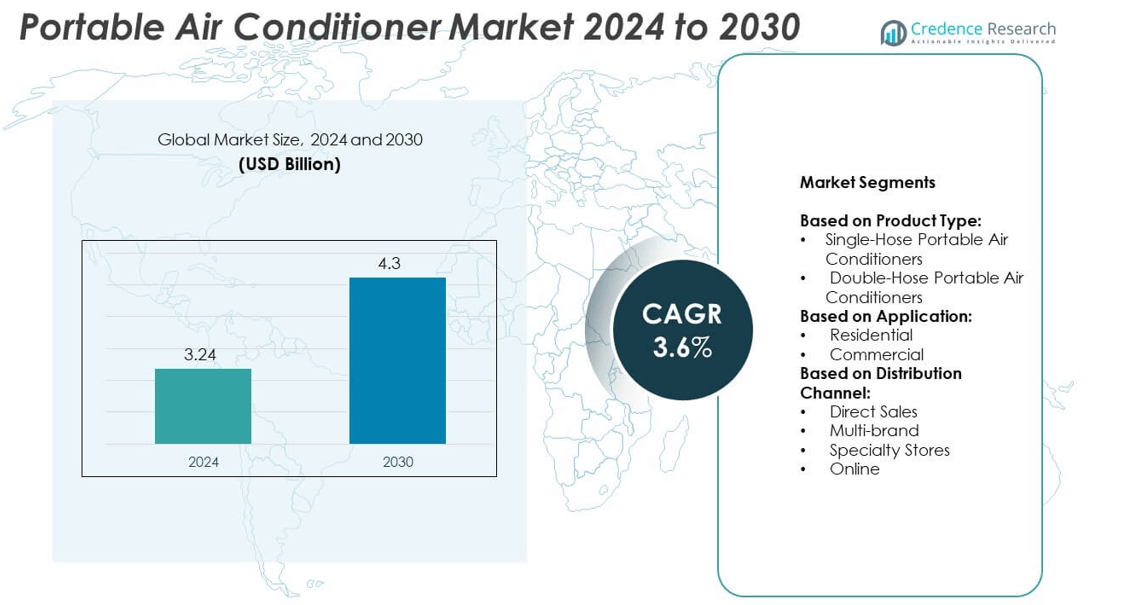
The portable air conditioner market size was valued at USD 3.24 billion in 2024 and is expected to reach USD 4.3 billion by 2032, growing at a CAGR of 3.6% during the forecast period.
| REPORT ATTRIBUTE |
DETAILS |
| Historical Period |
2020-2023 |
| Base Year |
2024 |
| Forecast Period |
2025-2032 |
| Portable Air Conditioner Market Size 2024 |
USD 3.24 billion |
| Portable Air Conditioner Market, CAGR |
3.6% |
| Portable Air Conditioner Market Size 2032 |
USD 4.3 billion |
The portable air conditioner market grows with rising urban housing demand, heatwaves, and preference for flexible cooling solutions. Consumers favor portable units for easy installation, mobility, and cost efficiency. Smart features such as Wi-Fi control and energy-saving modes attract tech-savvy buyers. Manufacturers focus on eco-friendly refrigerants and compact designs to meet regulations and consumer needs. Expanding e-commerce platforms boost seasonal sales. Rising adoption in residential and small commercial spaces supports steady market growth during the forecast period.
North America leads due to high residential demand and frequent heatwaves boosting portable unit adoption. Europe follows with strong uptake driven by home renovation projects and stricter energy-efficiency standards. Asia Pacific shows rapid growth supported by urbanization, rising incomes, and increasing product availability in China and India. Latin America and Middle East & Africa witness steady expansion with improving retail networks. Key players include Panasonic Corporation, Daikin Industries, Ltd., Carrier Global Corporation, and Midea Group Co., Ltd., focusing on technology and distribution reach.
Market Insights
- The portable air conditioner market was valued at USD 3.24 billion in 2024 and is projected to reach USD 4.3 billion by 2032, growing at a CAGR of 3.6%.
- Rising urbanization, rental housing demand, and seasonal heatwaves are driving strong adoption of portable cooling solutions.
- Smart-enabled models with Wi-Fi control, mobile app integration, and energy-saving modes are gaining popularity among tech-savvy buyers.
- The market is highly competitive with players focusing on product innovation, compact designs, and distribution through e-commerce platforms.
- High energy consumption and competition from window units and mini-split systems restrain faster adoption in some regions.
- North America holds the largest share at 35%, followed by Europe at 28% and Asia Pacific at 25%, with strong growth potential in developing economies.
- Manufacturers are prioritizing eco-friendly refrigerants, inverter technology, and hybrid models that combine cooling, heating, and air purification functions to meet consumer preferences.
Access crucial information at unmatched prices!
Request your sample report today & start making informed decisions powered by Credence Research Inc.!
Download Sample
Market Drivers
Growing Demand for Affordable and Flexible Cooling Solutions
The portable air conditioner market grows with rising need for cost-effective cooling in urban spaces. Consumers prefer these units for quick installation without structural changes. It serves renters and small businesses seeking temporary or seasonal cooling. Demand rises in developing economies where central air conditioning remains expensive. Rising temperatures and longer summers drive repeat purchases and upgrades. The product’s ability to move across rooms boosts its popularity among small households.
- For instance, Midea’s Duo Smart Inverter (MAP12S1TBL) portable AC delivers 10,000 SACC BTU cooling capacity.
Rising Adoption Across Residential and Commercial Spaces
The portable air conditioner market benefits from expansion in residential and commercial construction. Builders and property owners integrate portable units to supplement fixed cooling systems. It supports spaces with limited ductwork, including retail stores, clinics, and offices. Growing awareness about energy savings leads to higher preference for zonal cooling. Manufacturers design units to match modern interiors, improving acceptance among homeowners. The commercial sector sees rising use in temporary setups and events.
Technological Advancements and Product Innovation Driving Demand
The portable air conditioner market expands with focus on product innovation. Manufacturers introduce models with smart controls, remote monitoring, and Wi-Fi connectivity. It allows users to control temperature through mobile applications, increasing convenience. Advances in compressor technology improve cooling efficiency and lower noise levels. Compact and energy-efficient models attract eco-conscious buyers. Product differentiation helps brands gain competitive advantage in a crowded market.
- For instance, the Midea Duo MAP14HS1TBL supports large rooms up to 550 sq ft, plus it integrates heat, dehumidification, ventilation and cooling—all in one unit.
Government Initiatives and Rising Awareness of Energy Efficiency
The portable air conditioner market benefits from government programs promoting energy-efficient appliances. Authorities mandate energy rating labels, influencing consumer choices. It encourages manufacturers to adopt eco-friendly refrigerants with lower global warming potential. Rising awareness about sustainable cooling solutions supports the shift toward efficient products. Incentives and rebates drive replacement of older, power-hungry models. Public campaigns highlight the benefits of portable cooling for energy savings and comfort.
Market Trends
Shift Toward Smart and Connected Portable Air Conditioners
The portable air conditioner market sees rapid adoption of smart-enabled models. Consumers seek devices with Wi-Fi and voice control for better convenience. It supports integration with home automation platforms like Alexa and Google Home. Remote operation through mobile apps appeals to tech-savvy buyers. Manufacturers invest in IoT features to enhance personalization and energy tracking. Smart functionality improves customer satisfaction and strengthens brand loyalty.
- For instance, De’Longhi’s Pinguino portable air conditioners comply with the U.S. Department of Energy (DOE) test standard, which uses the more realistic Seasonally Adjusted Cooling Capacity (SACC) ratings. As a result, the official SACC BTU rating for a Pinguino model is lower than its older ASHRAE rating. For example, the PACEL376HGRFK Pinguino model has a 7,200 SACC BTU rating, while a different model, the PACEX390LVYN, has an 8,600 SACC BTU rating.
Focus on Compact, Lightweight, and Space-Saving Designs
The portable air conditioner market trends toward smaller, sleek designs for modern homes. Urban apartments and co-living spaces favor units that fit tight areas. It encourages manufacturers to reduce product footprint without reducing capacity. Foldable panels and wheels improve mobility and storage. Compact models also find demand in RVs and small offices. Stylish finishes and minimalistic designs attract younger consumers seeking aesthetics and performance.
- For instance, The Whynter ARC-1230WN offers 14,000 BTU (ASHRAE) cooling and 12,000 BTU (SACC) cooling capacity. It is designed to cool rooms up to 600 sq ft, with a dehumidification capacity of 87 pints per day. The maximum power consumption is 1293 W, according to manufacturer specifications.
Rising Preference for Energy-Efficient and Eco-Friendly Models
The portable air conditioner market advances with eco-conscious buying behavior. Consumers prioritize appliances with higher energy efficiency ratings. It drives adoption of low-GWP refrigerants to meet environmental regulations. Energy-saving modes and programmable timers help reduce power consumption. Manufacturers focus on inverter technology for optimal cooling performance. Growing awareness of climate impact strengthens demand for green-certified products.
Expansion of E-Commerce and Direct-to-Consumer Sales Channels
The portable air conditioner market benefits from online retail growth. E-commerce platforms offer wide model selection and competitive pricing. It enables buyers to compare features and read verified reviews before purchase. Direct-to-consumer sales improve brand-customer relationships and aftersales service. Online promotions during summer seasons boost unit sales significantly. Digital marketing campaigns create higher visibility and brand recognition among younger audiences.
Market Challenges Analysis
High Energy Consumption and Operational Costs Restraining Adoption
The portable air conditioner market faces challenges due to higher power consumption compared to split systems. Many units operate with lower energy efficiency, raising electricity bills for users. It creates hesitation among cost-sensitive households and small businesses. Growing energy price volatility further discourages frequent use. Regulatory pressure to meet stricter energy standards increases production costs for manufacturers. Consumers often delay purchases until efficient models become more affordable.
Intense Competition and Product Substitution Risk
The portable air conditioner market struggles with competition from window units and mini-split systems. Buyers sometimes prefer fixed systems offering better cooling coverage. It limits adoption in large spaces where portable models underperform. Price competition among brands compresses profit margins, challenging smaller players. Seasonal demand fluctuations affect inventory management and cash flow. Rising raw material costs also impact pricing strategies and profitability.
Market Opportunities
Growing Demand in Emerging Economies and Untapped Rural Markets
The portable air conditioner market finds growth potential in developing regions with rising disposable incomes. Expanding urbanization creates demand for affordable cooling solutions in apartments and small homes. It serves first-time buyers seeking flexible options over permanent installations. Rural markets also open opportunities where electricity access improves steadily. Government initiatives to strengthen power infrastructure support product penetration. Brands offering entry-level models at competitive prices can capture this new customer base.
Product Innovation and Expansion into New Applications
The portable air conditioner market gains opportunities through technological upgrades and niche applications. Manufacturers focus on hybrid units combining cooling, heating, and air purification functions. It attracts health-conscious buyers looking for multi-functional appliances. Growth in RVs, modular offices, and temporary housing projects supports portable solutions. Smart connectivity and energy-efficient features appeal to premium buyers. Expansion into commercial segments like pop-up stores and outdoor events further boosts demand.
Market Segmentation Analysis:
By Product Type
The portable air conditioner market is segmented into single-hose and double-hose units. Single-hose models dominate due to their simple design and lower price point. It attracts budget-conscious buyers and renters who prefer quick installation. These models are ideal for smaller rooms and moderate climates. Double-hose units hold growing demand among users seeking higher cooling efficiency. They offer faster cooling performance and improved air pressure balance, making them suitable for larger spaces and hotter regions. Manufacturers promote dual-hose models as premium options with better energy performance.
- For instance, The EcoFlow WAVE 2 has 5,100 BTU cooling and 6,100 BTU heating capacity. It operates at 44 dB in Sleep Mode. For portable use, an optional, separately purchased add-on battery is required. With this battery, the unit can achieve up to 8 hours of runtime in Eco Mode under optimal conditions, but the actual duration will vary depending on factors such as ambient temperature, room insulation, and the specific power source used.
By Application
The portable air conditioner market serves residential and commercial users. The residential segment leads due to rising demand in apartments, rental homes, and urban housing. It provides a practical solution where permanent installation is not possible. Seasonal heatwaves and growing home renovation projects support strong household adoption. The commercial segment sees steady growth from small offices, clinics, and temporary workspaces. Portable units help maintain comfortable conditions without investing in central systems. Events and hospitality sectors also use them for spot cooling and guest comfort.
- For instance, the Frigidaire FHPC082AC1, an 8,000 BTU (ASHRAE) portable air conditioner, delivers 5,500 SACC BTU. According to manufacturer specifications, its power consumption is 830 watts, and it has a Combined Energy Efficiency Ratio (CEER) of 6.3. This demonstrates a standard design that balances cooling power with energy use, though its power draw will fluctuate depending on operational factors, rather than remaining constant throughout the SACC test cycle.
By Distribution Channel
The portable air conditioner market is distributed through direct sales, multi-brand outlets, specialty stores, and online platforms. Direct sales benefit bulk buyers such as businesses and property developers. It allows manufacturers to maintain control over pricing and service quality. Multi-brand stores attract walk-in customers comparing several models before purchase. Specialty stores provide expert guidance and after-sales support, appealing to premium buyers. Online channels grow rapidly due to convenience, wide product selection, and promotional offers. E-commerce platforms play a key role during peak summer demand, driving significant sales volumes.
Segments:
Based on Product Type:
- Single-Hose Portable Air Conditioners
- Double-Hose Portable Air Conditioners
Based on Application:
Based on Distribution Channel:
- Direct Sales
- Multi-brand
- Specialty Stores
- Online
Based on the Geography:
- North America
- Europe
- UK
- France
- Germany
- Italy
- Spain
- Russia
- Belgium
- Netherlands
- Austria
- Sweden
- Poland
- Denmark
- Switzerland
- Rest of Europe
- Asia Pacific
- China
- Japan
- South Korea
- India
- Australia
- Thailand
- Indonesia
- Vietnam
- Malaysia
- Philippines
- Taiwan
- Rest of Asia Pacific
- Latin America
- Brazil
- Argentina
- Peru
- Chile
- Colombia
- Rest of Latin America
- Middle East
- UAE
- KSA
- Israel
- Turkey
- Iran
- Rest of Middle East
- Africa
- Egypt
- Nigeria
- Algeria
- Morocco
- Rest of Africa
Regional Analysis
North America
North America holds the largest share of the portable air conditioner market at 35%. Strong demand comes from the United States, where rising summer temperatures and heatwaves increase adoption. It is widely used in apartments, dormitories, and rental homes where permanent installation is restricted. Consumers in Canada also favor portable units for supplemental cooling during seasonal heat. Energy efficiency standards from agencies such as ENERGY STAR push manufacturers to introduce high-performance models. Growth in e-commerce platforms accelerates sales during peak summer months. Rising awareness about indoor air quality further drives interest in units with air purification and dehumidification functions.
Europe
Europe accounts for 28% of the portable air conditioner market, supported by rising heatwaves in countries such as Germany, France, and the U.K. The growing trend of home renovation projects strengthens demand for portable cooling units. It is commonly used in old buildings where ducted systems are costly to install. Increasing environmental regulations encourage adoption of energy-efficient models with eco-friendly refrigerants. Southern Europe experiences higher penetration due to longer summer seasons, especially in Italy and Spain. Online retail channels play a crucial role in reaching younger consumers. Demand from small commercial spaces such as cafes and retail shops continues to rise steadily.
Asia Pacific
Asia Pacific represents 25% of the portable air conditioner market, showing strong growth potential. Rapid urbanization and population density in countries like China, India, and Japan create a large customer base. It is widely chosen in rented apartments and urban homes with space constraints. Rising disposable income supports purchases of advanced models with inverter technology and smart controls. Government programs promoting energy-efficient appliances help drive replacement of outdated cooling solutions. The hospitality sector, including budget hotels and hostels, adopts portable units to maintain guest comfort. Increasing online retail adoption in India and Southeast Asia boosts availability and affordability for price-sensitive buyers.
Latin America
Latin America captures 7% of the portable air conditioner market, with demand led by Brazil and Mexico. Hot and humid climates encourage use in residential and light commercial spaces. It remains a popular choice for renters and temporary setups due to lower upfront costs. Retailers expand product offerings through both offline and online channels to cater to diverse consumers. Seasonal promotions help boost sales during peak summer periods. Awareness campaigns about energy efficiency support interest in modern, eco-friendly models. Growing middle-class population drives consistent demand for affordable cooling solutions.
Middle East & Africa
Middle East & Africa account for 5% of the portable air conditioner market, with growth centered in GCC countries. Rising temperatures and desert climates make portable cooling a necessity for many households. It is widely used in villas, apartments, and offices to supplement central cooling systems. Demand increases during peak summer months when additional cooling is required. Expansion of e-commerce platforms improves accessibility in remote areas. Manufacturers introduce durable units designed to withstand harsh climatic conditions. Growing construction activity and hospitality projects provide future opportunities for product penetration.
Shape Your Report to Specific Countries or Regions & Enjoy 30% Off!
Key Player Analysis
- Panasonic Corporation
- Trane Technologies plc
- Daikin Industries, Ltd.
- Samsung Electronics Co., Ltd.
- Johnson Controls-Hitachi Air Conditioning Limited
- Carrier Global Corporation
- Toshiba Corporation
- Gree Electric Appliances Inc.
- Midea Group Co., Ltd.
- Mitsubishi Electric Corporation
Competitive Analysis
The portable air conditioner market features strong competition among Panasonic Corporation, Trane Technologies plc, Daikin Industries, Ltd., Samsung Electronics Co., Ltd., Johnson Controls-Hitachi Air Conditioning Limited, Carrier Global Corporation, Toshiba Corporation, Gree Electric Appliances Inc., Midea Group Co., Ltd., and Mitsubishi Electric Corporation. These companies focus on expanding product portfolios with advanced features such as inverter technology, Wi-Fi connectivity, and eco-friendly refrigerants to meet evolving customer expectations. They invest heavily in research and development to improve cooling efficiency, reduce noise levels, and create compact designs suited for modern living spaces. Strategic partnerships with retailers and e-commerce platforms strengthen distribution reach and brand visibility. Many players implement competitive pricing strategies to attract budget-conscious buyers while offering premium models for high-end users. Strong after-sales service networks and energy efficiency certifications help build customer trust and loyalty. Continuous innovation and emphasis on sustainability remain central to staying competitive in this growing market.
Recent Developments
- In 2025, Samsung Electronics Co., Ltd. launched a new line of system air conditioners in Southeast Asia and Oceania, equipped with built-in Wi-Fi and modern SAC models to expand its retail presence.
- In 2024, Panasonic launched its 2024 line-up of 60 new air conditioner models, mostly inverter ACs.
- In 2023, Daikin Industries, Ltd. received the Good Design Award 2023 for its floor standing air conditioner for Australia/New Zealand and its “Hybrid Ceramheat” infrared heater in Japan.
Report Coverage
The research report offers an in-depth analysis based on Product Type, Application, Distribution Channel and Geography. It details leading market players, providing an overview of their business, product offerings, investments, revenue streams, and key applications. Additionally, the report includes insights into the competitive environment, SWOT analysis, current market trends, as well as the primary drivers and constraints. Furthermore, it discusses various factors that have driven market expansion in recent years. The report also explores market dynamics, regulatory scenarios, and technological advancements that are shaping the industry. It assesses the impact of external factors and global economic changes on market growth. Lastly, it provides strategic recommendations for new entrants and established companies to navigate the complexities of the market.
Future Outlook
- The portable air conditioner market will see steady growth with rising urban housing demand.
- Smart connectivity features will become standard in most models to attract tech-savvy buyers.
- Energy-efficient designs will dominate due to strict government regulations and consumer awareness.
- Manufacturers will expand product lines with hybrid units offering cooling, heating, and air purification.
- Online retail channels will drive a higher share of sales, supported by seasonal promotions.
- Compact and lightweight models will gain preference in apartments, RVs, and small offices.
- Adoption will rise in developing economies with improving electricity access and disposable incomes.
- Premium models with low noise levels and inverter technology will appeal to high-end customers.
- Competition will intensify, leading to price optimization and faster product innovation cycles.
- Sustainability initiatives will push for eco-friendly refrigerants and recyclable components in new launches.


