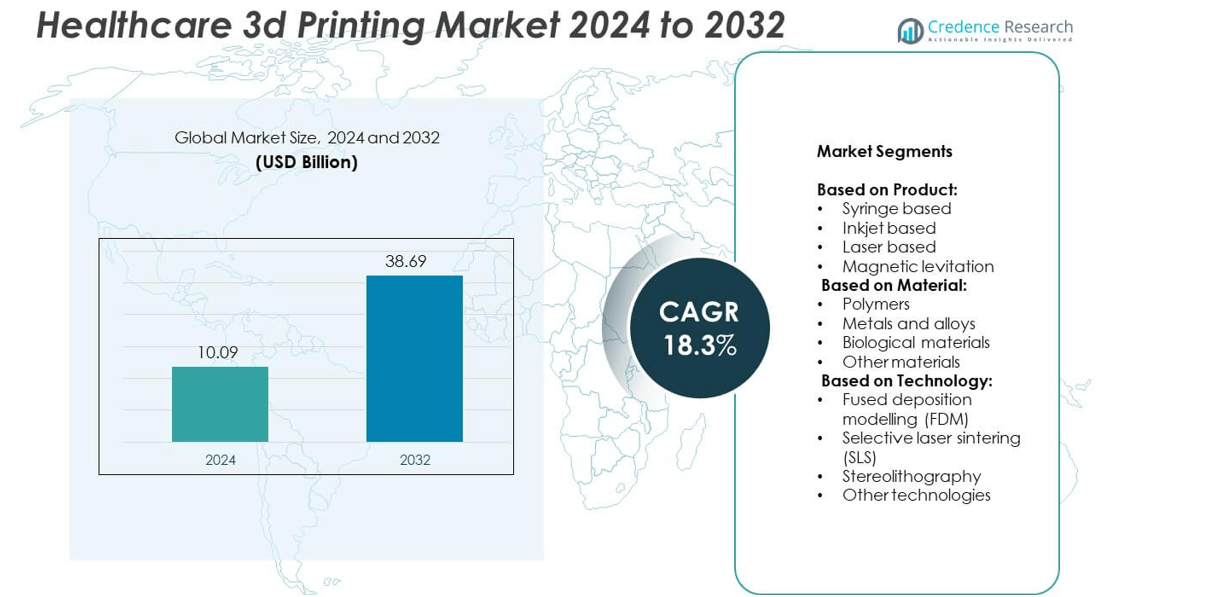
Home » Medical Devices » 3D Printing in Healthcare Market

3D Printing in Healthcare Market By Technology (Stereolithography, Fused Deposition Modeling, Selective Laser Sintering, Digital Light Processing, PolyJet/MultiJet Printing, Bioprinting); By Material (Plastics, Metals, Ceramics, Biomaterials); By Application (Medical Models and Anatomical Structures, Dental Products, Orthopedic Implants, Prosthetics and Orthotics, Patient-Specific Surgical Guides, Tissue Engineering and Bioprinting); By End-User (Hospitals and Clinics, Dental Laboratories, Research Institutions, Pharmaceutical Companies, Biotechnology Companies); By Process (Powder Bed Fusion, VAT Photopolymerization, Material Extrusion, Binder Jetting, Directed Energy Deposition); By Type (3D Printers, Materials, Services); By Regulatory Approval Status (FDA-Approved Products, CE Marked Products) – Growth, Share, Opportunities & Competitive Analysis, 2024 – 2032

Price: $4999

Published: | Report ID: 1005 | Report Format : PDF

Market Insights

  • The global demand for 3D printing in healthcare was valued at USD 1.2 Million in 2023 and is expected to reach USD 6.43 Million in 2032, growing at a CAGR of 20.5% between 2024 and 2032.
  • The stereolithography (SLA) segment is the market leader by technology, accounting for more than 20% of total value in 2023, while digital light processing (DLP) is projected to climb significantly over the forecast timeframe.
  • The orthopedic implants application category dominates the global need for 3D printing in healthcare, accounting for more than 22% in 2023, and is predicted to expand at a higher CAGR.
  • The biomaterials segment is expected to grow the fastest in the forecast period, while the ceramics material category dominated the market in 2023, accounting for 30% of total revenue.
  • The hospitals and clinics segment dominated the market with 28% of the total revenue share by end-user. In contrast, the dental laboratories will grow fastest over the estimated time.
  • With an impressive share of more than 25% by 2023 and estimates for considerable CAGR growth, the material extrusion process category will likely continue to lead the market demands.
  • North America is at the forefront of the expansion of 3D printing in the healthcare sector, accounting for more than one-third of the global market in 2023. Europe and the Asia Pacific combined account for just under 55%. In 2023, Europe had a market share of more than 20%.
  • One of the key market advantages of 3D printing in healthcare is its ability to customize medical devices, implants, and prosthetics according to individual patient anatomy, leading to better fit, functionality, and patient satisfaction.
  • 3D printing also offers cost-effective solutions for producing complex and customized medical devices and implants, reducing material wastage, manufacturing lead times, and overall healthcare costs compared to traditional manufacturing methods.

Executive Summary

Market Definition

3D printing, often known as additive manufacturing, is a technology used in the healthcare industry for developing dimensional solid objects. Additive manufacturing techniques are used to create 3D-printed objects. An additive procedure involves laying down consecutive layers of materials until the product is created. Each of these levels resembles a finely cut cross-section of the object. It is utilized to manufacture customized medical supplies and products in the healthcare sector. Besides, 3D printing technology addresses the growing demand for personalized medical care through the production of custom-tailored healthcare equipment based on specific requirements. In addition, it has numerous benefits over traditional reconstructive surgeries, including lower operative risks during complex procedures, less susceptibility to infections, and shorter periods of anesthesia exposure. This not only improves patient safety but also speeds up recovery.

Market Overview

3D printing in the healthcare market has witnessed consistent growth over recent years and is set to grow at a CAGR of 20.5% between 2024 and 2032. The global market was valued at USD 1.2 million in 2023 and is expected to reach USD 6.43 million in 2032.

In medical services, three-dimensional (3D) printing has emerged as a disruptive technology with many potential applications. This cutting-edge technology is transforming the field by enabling the production of surgical cutting instruments, drill guides, and implants. It can additionally generate patient-specific replicas of bones, organs, and blood arteries, which makes precise surgical planning and training possible.

Moreover, 3D printing is useful in the fields of regenerative healthcare and tissue engineering, as it is capable of producing living human cells and structures. This finding provides the way for personalized medical treatments, ranging from custom prosthetics to patient-specific medicine formulations and equipment modifications.

3D printing also saves time and money by streamlining the healthcare process and assuring more effective delivery of medical services. As a result, this technology is gaining significant global popularity in healthcare services, further providing unparalleled market opportunities for innovation and personalized treatments. Additionally, improved regulatory backing for medical 3D printing, as well as increased awareness among healthcare professionals, continues to propel the industry forward.

3D printing in healthcare market


Design Element 2

Access crucial information at unmatched prices!

Request your free sample report today & start making informed decisions powered by Credence Research!

Download Free Sample
CTA Design Element 3


Segmentation by Technology

  • Stereolithography (SLA) emerges as the dominant technology segment within 3D printing in the healthcare market, commanding a 20% share of the global market due to its high precision and resolution capabilities. SLA technology is widely used in producing dental models, surgical guides, and patient-specific implants.
  • Digital light processing (DLP) technology is forecasted to witness robust CAGR growth, owing to its ability to produce intricate and detailed 3D-printed medical devices and implants. DLP offers advantages such as faster print speeds, enhanced surface quality, and the ability to use a wide range of materials, making it suitable for various healthcare applications.

Segmentation by Material

  • Ceramic materials lead the market demand for 3D printing in healthcare with a revenue share of over 30% in 2023, owing to their biocompatibility, strength, and suitability for dental and orthopedic applications. Advanced ceramics such as zirconia and alumina are commonly used to fabricate dental crowns, bridges, and implants due to their wide aesthetic properties and durability.
  • Plastics, metals, and biomaterials segments cater to diverse requirements in the healthcare sector, offering flexibility, durability, and biodegradability for various medical device applications. Biocompatible polymers like PLA (polylactic acid) and ABS (acrylonitrile butadiene styrene) are commonly used for prototyping and producing surgical instruments, while titanium alloys and stainless steel are primarily preferred for manufacturing orthopedic implants and prosthetics.

Segmentation by End-User

  • Dental laboratories will continue to increase at an explosive rate, attributed to the rising use of 3D printing technology to manufacture dental prostheses, restorations, and bridges. The capacity to generate extremely accurate and customized dental restorations in a shorter time has resulted in the widespread acceptance of 3D printing in the dental profession.
  • Hospitals and clinics remain the largest end-user category, accounting for over 28% of market value in 2023, owing to increased demand for customized implantable devices, surgical guides, and anatomical models developed using 3D printing technology. Hospitals extensively use 3D printing for preoperative planning, patient-specific implant design, and medical education, which results in better surgical outcomes and patient care.

Segmentation by Application

  • Prosthetics and orthotics emerge as a key application segment with substantial growth potential, mainly attributed to the growing prevalence of musculoskeletal disorders and the need for personalized prosthetic solutions. 3D printing technology enables the production of lightweight, durable prosthetic limbs and orthotic devices customized to individual patient anatomy, enhancing mobility and quality of life.
  • The orthopedic implants category currently leads with a market share of over 22% in 2023, owing to improvements in 3D printing technology that allow for the manufacture of complicated, patient-specific implants for orthopedic procedures.

Segmentation by Process

  • With over 25% of the revenue share in 2023, the material extrusion method will continue to dominate the market due to its many advantages, including cost-effectiveness, scalability, and compatibility with a wide range of materials in the production of prototypes and medical devices. Fused deposition modeling (FDM) is a popular material extrusion process that is frequently employed in healthcare for generating anatomical models, invasive guides, and patient-specific prosthetics.
  • Powder bed fusion and VAT photopolymerization processes address the remaining market scope by providing higher accuracy and resolution for the production of complicated and customized medical components.

Segmentation by Regulatory Approval Status

  • Products with FDA approval hold significant market presence and credibility, ensuring compliance with regulatory standards and safety requirements in the US market. FDA approval indicates that the products have undergone rigorous testing and evaluation to meet quality and safety standards.
  • CE-marked products comply with European Union rules, which facilitates market access and commercialization throughout European markets. CE-marked items demonstrate conformity to safety, health, and environmental protection regulations, which increases market acceptance and customer confidence.

Segmentation by Region

  • North America is responsible for the continued growth of 3D printing in the healthcare sector, accounting for more than one-third of total market revenue in 2023. The region is home to leading 3D printing business enterprises, research organizations, and healthcare facilities, which largely promote innovation and implementation of additive manufacturing technology in a wide range of medical specialties.
  • In 2023, Asia Pacific and Europe combined control just less than 55% of the share, with Europe holding a larger share of over 20%. Countries such as China, Japan, India, Germany, and the U.K. are at the forefront of 3D printing innovation in healthcare, leveraging government initiatives, academic collaborations, and industry partnerships to advance medical 3D printing applications and address ongoing healthcare challenges.
  • The rest of the world, including Latin America, the Middle East, and Africa, presents untapped opportunities for market expansion, owing to rising healthcare awareness, infrastructure developments, and government initiatives to improve healthcare access and affordability. Emerging economies in these regions are investing in healthcare infrastructure upgrades and technology adoption to meet the growing healthcare needs of their populations, creating favorable conditions for the adoption of 3D printing in healthcare applications.

The growing potential for organ and tissue printing, the rising integration with imaging technologies, the increasing partnerships between 3D printing companies and healthcare facilities, and the ease of accessibility of desktop 3D printers are some of the key factors promoting the growth of the global market.

North America is expected to have strong growth in the healthcare 3D printing market due to the rising adoption of customized additive manufacturing and 3D printer consumption resulting from increased medical applications. Increased 3D printing activities supported by the government are additionally contributing to market expansion in North America. For example, in May 2022, President Biden attended five U.S. manufacturers to mark the start of the Additive Manufacturing (AM) Forward. AM Forward is a voluntary agreement among businesses to assist their smaller U.S.-based suppliers in expanding the implementation of additive manufacturing.

Europe has the second largest global market share for 3D printing healthcare, attributed to a higher level of R&D activities in 3D printing technologies at the academic and industrial levels for healthcare applications, as well as the presence of prominent firms in the region. The majority of European companies are partnering with other companies to speed up the R&D projects and product development processes. For example, Mobelife, the daughter company of Materialise NV, partnered with JRI Orthopaedics to support the growth of Mobelife’s aMace Acetabular Revision System business in the U.K. and Ireland in 2019. In addition, 3D Systems Corp. opened a new Advanced Additive Manufacturing Centre in Pinerolo, Italy.

Key Highlights of the Report

The 3D printing in healthcare market is segmented by technology, material, application, end-user, process, type, regulatory approval status, and region. Stereolithography (SLA) develops as a prominent technology segment, offering high precision and resolution capabilities, particularly suitable for producing intricate anatomical models and dental implants. Ceramic materials lead the market demand, owing to their biocompatibility and strength, making them ideal for dental prosthetics and orthopedic applications. Prosthetics and orthotics represent a key application segment, with a growing demand for personalized solutions to address musculoskeletal disorders. Hospitals and clinics emerge as primary end-users, leveraging 3D printing technology for customized medical implants and surgical guides. Material extrusion process dominates the market landscape, offering cost-effective and scalable solutions for producing medical devices and prototypes.

The primary factors driving market expansion are technological breakthroughs in 3D printing, customization, and personalization, increased R&D investments, a huge patient pool, and an increase in biomedical applications. Moreover, significant R&D investments, rapid customer development, an increase in the spectrum of therapeutic uses, and intensive scientific research for 3D printer innovation at the academic and commercial levels have all supported market growth. However, the high cost of 3D printing, increased reimbursement complications, increased copyright and patent concerns, and a shortage of experienced labor all impede the proliferation of 3D printing in the healthcare industry. On the other hand, the increase in pharmaceutical applications, as well as the availability of bioprinting tissues and organs, further presents opportunities for market expansion throughout the projection period.

North America was the largest market revenue contributor in 2023, owing to the broad use of 3D printing technologies and numerous collaborations between scientific and commercial organizations. Moreover, the region is expected to maintain its global dominance in 3D printing in the healthcare market in the forecast period due to emerging technological developments in 3D printing, increased funding for improvement in 3D printers for healthcare, and a rise in patient pool. On the other side, the Asia-Pacific region is predicted to experience the fastest developments over the estimated time frame. This is due to investment received by several start-up firms to create powerful 3D printers, growing demand for modern medical facilities, and elevated healthcare expenditures.

What Are the Main Drivers Of 3D Printing in the Healthcare Market?

The rapid advancement of personalized medicine, the growing efficiency of R&D processes in the pharmaceutical industry, and the growing use of 3D printing to create customized organs and tissues from soft biomaterials like biomimetic synthetic polymers and living cells are some of the primary trends propelling market revenue growth. Using additive manufacturing as a pre-operative planning tool, creating prostheses, and integrating 3D printing into the pharmaceutical production process are a few other aspects anticipated to fuel market share throughout the projected year.

What Are the Major Challenges Faced By 3D Printing in the Healthcare Market?

The high cost of cutting-edge technology and 3D printing methodologies has emerged as a major impediment to market growth. The introduction of advanced technologies dramatically increases the overall cost of treatment. The reimbursement policies given by insurance companies are always changing in terms of rules and restrictions, making it difficult for consumers to choose modern treatment alternatives and techniques. The high expense of treatment options necessitates a backup in the form of reimbursement facilities to make them affordable to patients. The growing tendency of copyright and patent protection has also significantly hampered industry expansion.

What Are the Growth Opportunities for 3D Printing in the Healthcare Market?

The 3D printing healthcare industry is experiencing strong demand due to its growing use in surgical equipment, implants, and bioengineering. Aside from that, the increasing demand for patient-specific surgical guidance and the rising prevalence of chronic disorders have boosted the market. Moreover, the growing older population, as well as rapid drug discovery and testing, are moving the industry forward. Furthermore, improved surgical planning and training are benefiting the market. The increased orthopedic and prosthetics applications areas and the growing production of biocompatible materials are also fueling the market size.

Market Drivers

Several factors contribute to the expanding use of 3D printing in the healthcare industry. The following are the primary drivers propelling the global market growth for 3D printing in healthcare:

Increasing Use in Biomedical Applications

3D printing technology offers a variety of potential uses in the healthcare field. In addition to generating prosthetics, dental restorations, and hearing instruments, this technique is utilized to manufacture organs that can be transplanted into the body. Several companies have concentrated on printing and commercializing organs, including livers and thyroid glands, for pre-clinical drug testing. Additionally, 3D printing technology is applied in stem cell biology and biomedical engineering, expanding the spectrum of its biomedical applications.

Furthermore, substantial research is underway to improve therapeutic efficacy through the use of 3D printing technology. Novel 3D printing applications in healthcare have emerged as a result of substantial research and development activity at both the industrial and academic levels. For example, in August 2022, Precise Bio, a regenerative medicine firm, and Carl Zeiss Meditec (ZEISS), a medical technology corporation, formed a partnership to develop and commercialize 3D bioprinted ocular tissue for use in cornea implants. The generated implants would then be employed in corneal transplants and vision correction surgeries. This is expected to support the growth of the 3D printing healthcare market throughout the forecast period.

Market Restraints

3D printing in the healthcare market faces key challenges that may limit its growth. These consist of the following:

High Costs Connected with 3D Printing

As 3D printing is still an evolving market, the costs associated with 3D printers are relatively expensive. These printers necessitate significant capital investments for initial installation and maintenance. Besides, the cost of these equipment varies with their size and technology. Stereolithography, electron beam, laser beam, photopolymerization, and droplet deposition are all extremely expensive technologies. In addition, the software needed to operate 3D printers is also costly. Plus, the software must be updated on a regular basis to ensure its efficiency and effectiveness. Additionally, as 3D printing for healthcare applications requires pre-printing processing, the materials utilized should be biocompatible and have adequate mechanical strength.

Opportunities

The global market for 3D printing in healthcare has enormous development opportunities. These consist of the following:

Extending Pharmaceutical Applications

The rising drug-related uses of 3D printing are leading to immense expansion in the medical sector. This transformational factor is revolutionizing drug research and delivery by allowing for exact pharmacological customization. Medication can be personalized to particular patient needs using 3D printing, leading to more effective therapies and better patient outcomes. In addition, 3D printing allows for the design of complicated medication delivery systems, resulting in controlled release and better therapeutic efficacy. The technology’s capacity to rapidly prototype new medication formulations speeds up drug research, saving time and money. Furthermore, 3D printing makes it easier and less expensive to manufacture pediatric pharmaceuticals and specialized therapies for rare conditions.

For example, on March 22, 2023, Hovione and Laxxon Medical formed a strategic alliance to enhance the use of 3D screen printing technology in the pharmaceutical industry. The collaboration brings together Laxxon’s expertise in 3D screen printing, which is based on their SPID-Technology, and Hovione’s product and process research, engineering, and manufacturing expertise in pharmaceutical industries. As regulatory agencies react to these developments, the healthcare industry is experiencing a fundamental transformation in pharmaceutical manufacturing and patient care, resulting in significant market growth and a future of more personalized and efficient medical treatments.

Shape Your Report to Specific Countries or Regions & Enjoy 30% Off!

Competitive Landscape

Key Players

The global market for 3D printing in healthcare is highly competitive and widely distributed. The following are a few of the leading market players and their market shares:

  • Organovo Holdings Inc.
  • Stratasys Ltd
  • The ExOne Company
  • General Electric (GE Additive)
  • 3D Systems Corporation
  • Oxford Performance Materials Inc.
  • Formlabs Inc.
  • SLM Solutions Group AG
  • Materialise NV
  • Protolabs Inc.
  • Others

These top firms contribute to the market’s development with their innovative strategies and persistent dedication to medical technology advancement. They are at the forefront of R&D, investing substantially in modern technologies that expand the possibilities of 3D printing in healthcare. These advancements broaden the market scope of applications, ranging from patient-centric implants to drug-delivery devices. They additionally operate closely with regulatory agencies to ensure compliance with growing healthcare standards, thereby easing the use of 3D-printed surgical instruments and supplements.

In July 2023, Lithoz, an Austrian ceramic 3D printing startup, and Himed, a New York-based biomaterials specialist, announced a long-term collaboration to promote innovation in the 3D printing of medical-grade bioceramics. The collaboration will focus on developing medical implants made from biocompatible calcium phosphates (CaP) to meet the increasing requirements for 3D printable bioceramic feedstocks.

In June 2022, Amnovis, a Belgian contract manufacturer, and BAAT Medical, a medical device service provider, partnered to deliver an innovative and quick turnaround procedure for 3D-printed medical equipment. Amnovis and BAAT Medical have previous expertise in 3D printing medical devices for various certified end-use applications.

In April 2022, Desktop Health, a healthcare company that develops 3D-printing solutions for personalized medicines, introduced the Einstein high-precision range of 3D printers and the Flexcera Smile Ultra+ resin for printing interim and permanent restorations in the United States. This combination allows dentists to fabricate precise 3D-printed restorations.

In February 2022, DeGen Medical Inc., a spinal implant manufacturer focusing on augmented reality and patient-specific treatments, released Impulse AM, 3D-printed porous titanium implants for posterior interbody fusion.

In October 2021, 3D Systems completed the acquisition of Volumetric Inc., a Houston-based bioprinting company. Volumetric Inc. specializes in 3D bioprinting of replacement tissues and organs, and this acquisition will enable 3D Systems to establish a world-class research capability in Houston, Texas.

Summary of Key Findings

  • The 3D printing in the healthcare market is experiencing rapid growth, owing to the advancements in 3D printing technologies, increasing demands for personalized healthcare solutions, and growing applications across the medical and dental sectors.
  • The market is segmented by technology, material, application, end-user, process, type, regulatory approval status, and region.
  • The dental industry is a significant adopter of 3D printing technology, utilizing it to fabricate dental prosthetics, crowns, bridges, orthodontic appliances, and surgical guides with higher precision and accuracy.
  • However, the widespread market adoption of 3D printing in healthcare faces challenges such as regulatory complexities, reimbursement concerns, higher costs, technical limitations, and the continuous need to standardize and validate 3D-printed medical products.
  • According to a study published in the Journal of the American Academy of Orthopaedic Surgeons, 3D printing will have an enormous impact on how musculoskeletal problems are treated. The growing focus on 3D printing for bone and cartilage replacement in patients with fractures or lesions will give lucrative market growth opportunities for industry players.

Future Outlook

  • The adoption of 3D printing is expected to expand into new areas of healthcare, including pharmaceuticals, regenerative medicine, and point-of-care manufacturing, offering market opportunities for the development of customized drug delivery systems, tissue-engineered constructs, and on-demand medical devices.
  • Continued R&D initiatives in 3D printing technology, bioink formulations, and tissue engineering approaches are anticipated to drive innovation and unlock new applications in regenerative medicine, organ transplantation, and drug discovery.

How CXOs Can Benefit from the Credence Research 3D Printing in Healthcare Market Report

The Credence Research 3D Printing in Healthcare Market Report provides CXOs with a comprehensive overview of the market, including:

  • Market Size and Growth Forecast: The report offers detailed estimates of the global 3D printing market size in the healthcare market, segmented by technology, material, application, end-user, process, type, regulatory approval status, and region. It also includes forecasts for the market through 2032 based on key trends and drivers.
  • Market Segmentation: The report segments 3D printing in the healthcare market by technology, material, application, end-user, process, type, regulatory approval status, and region. This segmentation provides CXOs with a granular understanding of the market and the growth opportunities within each segment.
  • Competitive Landscape: The report profiles the key players in 3D printing in the healthcare market and provides insights into their strategies, product offerings, and financial performance. CXOs can leverage this information to assess market competition, identify strategic partnerships, and stay informed about industry trends.
  • Key Trends and Drivers: The report identifies and analyzes key trends and drivers shaping 3D printing in the healthcare market, such as technological advancements, regulatory changes, and evolving healthcare needs. CXOs can use this information to make informed decisions about investments, product development, and market expansion strategies.

CXOs can use the insights from the Credence Research 3D Printing in Healthcare Market Report to:

  • Identify Growth Opportunities: The report helps CXOs identify emerging growth opportunities within 3D printing in the healthcare market, such as personalized medical devices, bio-printed tissues, and point-of-care manufacturing. For example, the report highlights the growing demand for patient-specific implants and surgical guides as a key opportunity for market expansion.
  • Make Informed Investment Decisions: CXOs can make informed investment decisions based on the insights provided in the report. For instance, the report offers insights into the most promising 3D printing technologies, materials, and applications in healthcare, helping CXOs prioritize investment opportunities and allocate resources effectively.
  • Develop Competitive Strategies: The report enables CXOs to develop competitive strategies for their organizations in the 3D printing in the healthcare market. For example, the report identifies emerging technologies and materials in 3D printing, allowing CXOs to stay ahead of competitors by investing in innovation and R&D initiatives.
  • Track Market Developments: CXOs can track market developments and stay ahead of the competition by leveraging the insights provided in the report. For example, the report highlights emerging regulatory trends, technological innovations, and market disruptions, allowing CXOs to adapt their strategies accordingly and capitalize on new opportunities.

Overall, the Credence Research 3D Printing in Healthcare Market Report is a valuable resource for CXOs looking to gain a deeper understanding of the market and identify growth opportunities.

Segmentation

  • By Technology
    • Stereolithography (SLA)
    • Fused Deposition Modeling (FDM)
    • Selective Laser Sintering (SLS)
    • Digital Light Processing (DLP)
    • PolyJet/MultiJet Printing
    • Bioprinting
  • By Material
    • Plastics
    • Metals
    • Ceramics
    • Biomaterials
  • By Application
    • Medical Models and Anatomical Structures
    • Dental Products (Crowns, Bridges, etc.)
    • Orthopedic Implants
    • Prosthetics and Orthotics
    • Patient-Specific Surgical Guides
    • Tissue Engineering and Bioprinting
  • By End-User
    • Hospitals and Clinics
    • Dental Laboratories
    • Research Institutions
    • Pharmaceutical Companies
    • Biotechnology Companies
  • By Process
    • Powder Bed Fusion
    • VAT Photopolymerization
    • Material Extrusion
    • Binder Jetting
    • Directed Energy Deposition
  • By Type
    • 3D Printers
    • Materials
    • Services
  • By Regulatory Approval Status
    • FDA-Approved Products
    • CE Marked Products
  • By Region
    • North America
      • S.
      • Canada
      • Mexico
    • Europe
      • Germany
      • France
      • K.
      • Italy
      • Spain
      • Rest of Europe
    • Asia Pacific
      • China
      • Japan
      • India
      • South Korea
      • South-east Asia
      • Rest of Asia Pacific
    • Latin America
      • Brazil
      • Argentina
      • Rest of Latin America
    • Middle East & Africa
      • GCC Countries
      • South Africa
      • Rest of the Middle East and Africa

Table of Content
1. Preface
1.1. Report Description
1.1.1. Purpose of the Report
1.1.2. Target Audience
1.1.3. USP and Key Offerings
1.2. Research Scope
1.3. Market Introduction

2. Executive Summary
2.1. Market Snapshot: Global 3D Printing in Healthcare Market
2.1.1. Global 3D Printing in Healthcare Market, By Technology
2.1.2. Global 3D Printing in Healthcare Market, By End-User
2.1.3. Global 3D Printing in Healthcare Market, By Material
2.1.4. Global 3D Printing in Healthcare Market, By Process
2.1.5. Global 3D Printing in Healthcare Market, By Type
2.1.6. Global 3D Printing in Healthcare Market, By Application
2.1.7. Global 3D Printing in Healthcare Market, By Regulatory Approval Status
2.1.8. Global 3D Printing in Healthcare Market, By Region
2.2. Insights from Primary Respondents

3. Market Dynamics & Factors Analysis
3.1. Introduction
3.1.1. Global 3D Printing in Healthcare Market Value, 2019-2032, (US$ Mn)
3.1.2. Y-o-Y Growth Trend Analysis
3.2. Market Dynamics
3.2.1. 3D Printing in Healthcare Market Drivers
3.2.2. 3D Printing in Healthcare Market Restraints
3.2.3. 3D Printing in Healthcare Market Opportunities
3.2.4. Major 3D Printing in Healthcare Industry Challenges
3.3. Growth and Development Patterns
3.4. Investment Feasibility Analysis
3.5. Market Opportunity Analysis
3.5.1. Technology
3.5.2. End-User
3.5.3. Material
3.5.4. Process
3.5.5. Type
3.5.6. Application
3.5.7. Regulatory Approval Status
3.5.8. Geography

4. Market Competitive Landscape Analysis
4.1. Company Market Share Analysis, 2023
4.1.1. Global 3D Printing in Healthcare Market: Company Market Share, Value 2023
4.1.2. Global 3D Printing in Healthcare Market: Top 6 Company Market Share, Value 2023
4.1.3. Global 3D Printing in Healthcare Market: Top 3 Company Market Share, Value 2023
4.2. Global 3D Printing in Healthcare Market: Company Revenue Share Analysis, 2023
4.3. Company Assessment Metrics, 2023
4.3.1. Stars
4.3.2. Emerging Leaders
4.3.3. Pervasive Players
4.3.4. Participants
4.4. Startups/SMEs Assessment Metrics, 2023
4.4.1. Progressive Companies
4.4.2. Responsive Companies
4.4.3. Dynamic Companies
4.4.4. Starting Blocks
4.5. Strategic Development
4.5.1. Acquisition and Mergers
4.5.2. New Product Launch
4.5.3. Regional Expansion
4.5.4. Partnerships
4.6. Key Player Product Matrix
4.7. Potential for New Players in the Global 3D Printing in Healthcare Market

5. Premium Insights
5.1. STAR (Situation, Task, Action, Results) Analysis
5.2. Porter’s Five Forces Analysis
5.2.1. Threat of New Entrants
5.2.2. Bargaining Power of Buyers/Consumers
5.2.3. Bargaining Power of Suppliers
5.2.4. Threat of Substitute Types
5.2.5. Intensity of Competitive Rivalry
5.3. PESTEL Analysis
5.3.1. Political Factors
5.3.2. Economic Factors
5.3.3. Social Factors
5.3.4. Technological Factors
5.3.5. Environmental Factors
5.3.6. Legal Factors
5.4. Key Market Trends
5.4.1. Demand Side Trends
5.4.2. Supply Side Trends
5.5. Value Chain Analysis
5.6. Technology Analysis
5.6.1. Research and development in the global market
5.6.2. Patent Analysis
5.6.3. Emerging technologies and their potential disruption to the market
5.7. Consumer Behaviour Analysis
5.7.1. Consumer Preferences and Expectations
5.7.2. Factors Influencing Consumer Buying Decisions
5.7.2.1. North America
5.7.2.2. Europe
5.7.2.3. Asia Pacific
5.7.2.4. Latin America
5.7.2.5. Middle East and Africa
5.7.3. Consumer Pain Points
5.8. Analysis and Recommendations
5.9. Adjacent Market Analysis

6. Market Positioning of Key Players, 2023
6.1. Company market share of key players, 2023
6.2. Competitive Benchmarking
6.3. Market Positioning of Key Vendors
6.4. Geographical Presence Analysis
6.5. Major Strategies Adopted by Key Players
6.5.1. Key Strategies Analysis
6.5.2. Mergers and Acquisitions
6.5.3. Partnerships
6.5.4. Product Launch
6.5.5. Geographical Expansion
6.5.6. Others

7. Impact Analysis of COVID 19 and Russia – Ukraine War on 3D Printing in Healthcare Market
7.1. Ukraine-Russia War Impact
7.1.1. Uncertainty and Economic Instability
7.1.2. Supply chain disruptions
7.1.3. Regional market shifts
7.1.4. Shift in government priorities
7.2. COVID-19 Impact Analysis
7.2.1. Supply Chain Disruptions
7.2.2. Demand Fluctuations
7.2.3. Shift in Product Mix
7.2.4. Reduced Industrial Activity
7.2.5. Regional Impact Analysis
7.2.5.1. North America
7.2.5.2. Europe
7.2.5.3. Asia Pacific
7.2.5.4. Latin America
7.2.5.5. Middle East and Africa

8. Global 3D Printing in Healthcare Market, By Technology
8.1. Global 3D Printing in Healthcare Market Overview, by Technology
8.1.1. Global 3D Printing in Healthcare Market Revenue Share, By Technology, 2023 Vs 2032 (in %)
8.2. Stereolithography (SLA)
8.2.1. Global 3D Printing in Healthcare Market, By Stereolithography (SLA), By Region, 2019-2032 (US$ Mn)
8.2.2. Market Dynamics for Stereolithography (SLA)
8.2.2.1. Drivers
8.2.2.2. Restraints
8.2.2.3. Opportunities
8.2.2.4. Trends
8.3. Fused Deposition Modeling (FDM)
8.3.1. Global 3D Printing in Healthcare Market, By Fused Deposition Modeling (FDM), By Region, 2019-2032 (US$ Mn)
8.3.2. Market Dynamics for Fused Deposition Modeling (FDM)
8.3.2.1. Drivers
8.3.2.2. Restraints
8.3.2.3. Opportunities
8.3.2.4. Trends
8.4. Selective Laser Sintering (SLS)
8.4.1. Global 3D Printing in Healthcare Market, By Selective Laser Sintering (SLS), By Region, 2019-2032 (US$ Mn)
8.4.2. Market Dynamics for Selective Laser Sintering (SLS)
8.4.2.1. Drivers
8.4.2.2. Restraints
8.4.2.3. Opportunities
8.4.2.4. Trends
8.5. Digital Light Processing (DLP)
8.5.1. Global 3D Printing in Healthcare Market, By Digital Light Processing (DLP), By Region, 2019-2032 (US$ Mn)
8.5.2. Market Dynamics for Digital Light Processing (DLP)
8.5.2.1. Drivers
8.5.2.2. Restraints
8.5.2.3. Opportunities
8.5.2.4. Trends
8.6. PolyJet/MultiJet Printing
8.6.1. Global 3D Printing in Healthcare Market, By PolyJet/MultiJet Printing, By Region, 2019-2032 (US$ Mn)
8.6.2. Market Dynamics for PolyJet/MultiJet Printing
8.6.2.1. Drivers
8.6.2.2. Restraints
8.6.2.3. Opportunities
8.6.2.4. Trends
8.7. Bioprinting
8.7.1. Global 3D Printing in Healthcare Market, By Bioprinting, By Region, 2019-2032 (US$ Mn)
8.7.2. Market Dynamics for Bioprinting
8.7.2.1. Drivers
8.7.2.2. Restraints
8.7.2.3. Opportunities
8.7.2.4. Trends

9. Global 3D Printing in Healthcare Market, By End-User
9.1. Global 3D Printing in Healthcare Market Overview, by End-User
9.1.1. Global 3D Printing in Healthcare Market Revenue Share, By End-User, 2023 Vs 2032 (in %)
9.2. Hospitals and Clinics
9.2.1. Global 3D Printing in Healthcare Market, By Hospitals and Clinics, By Region, 2019-2032 (US$ Mn)
9.2.2. Market Dynamics for Hospitals and Clinics
9.2.2.1. Drivers
9.2.2.2. Restraints
9.2.2.3. Opportunities
9.2.2.4. Trends
9.3. Dental Laboratories
9.3.1. Global 3D Printing in Healthcare Market, By Dental Laboratories, By Region, 2019-2032 (US$ Mn)
9.3.2. Market Dynamics for Dental Laboratories
9.3.2.1. Drivers
9.3.2.2. Restraints
9.3.2.3. Opportunities
9.3.2.4. Trends
9.4. Research Institutions
9.4.1. Global 3D Printing in Healthcare Market, By Research Institutions, By Region, 2019-2032 (US$ Mn)
9.4.2. Market Dynamics for Research Institutions
9.4.2.1. Drivers
9.4.2.2. Restraints
9.4.2.3. Opportunities
9.4.2.4. Trends
9.5. Others
9.5.1. Global 3D Printing in Healthcare Market, By Others, By Region, 2019-2032 (US$ Mn)
9.5.2. Market Dynamics for Others
9.5.2.1. Drivers
9.5.2.2. Restraints
9.5.2.3. Opportunities
9.5.2.4. Trends

10. Global 3D Printing in Healthcare Market, By Material
10.1. Global 3D Printing in Healthcare Market Overview, by Material
10.1.1. Global 3D Printing in Healthcare Market Revenue Share, By Material, 2023 Vs 2032 (in %)
10.2. Plastics
10.2.1. Global 3D Printing in Healthcare Market, By Plastics, By Region, 2019-2032 (US$ Mn)
10.2.2. Market Dynamics for Plastics
10.2.2.1. Drivers
10.2.2.2. Restraints
10.2.2.3. Opportunities
10.2.2.4. Trends
10.3. Metals
10.3.1. Global 3D Printing in Healthcare Market, By Metals, By Region, 2019-2032 (US$ Mn)
10.3.2. Market Dynamics for Metals
10.3.2.1. Drivers
10.3.2.2. Restraints
10.3.2.3. Opportunities
10.3.2.4. Trends
10.4. Ceramics
10.4.1. Global 3D Printing in Healthcare Market, By Ceramics, By Region, 2019-2032 (US$ Mn)
10.4.2. Market Dynamics for Ceramics
10.4.2.1. Drivers
10.4.2.2. Restraints
10.4.2.3. Opportunities
10.4.2.4. Trends
10.5. Biomaterials
10.5.1. Global 3D Printing in Healthcare Market, By Biomaterials, By Region, 2019-2032 (US$ Mn)
10.5.2. Market Dynamics for Biomaterials
10.5.2.1. Drivers
10.5.2.2. Restraints
10.5.2.3. Opportunities
10.5.2.4. Trends

11. Global 3D Printing in Healthcare Market, By Process
11.1. Global 3D Printing in Healthcare Market Overview, by Process
11.1.1. Global 3D Printing in Healthcare Market Revenue Share, By Process, 2023 Vs 2032 (in %)
11.2. Powder Bed Fusion
11.2.1. Global 3D Printing in Healthcare Market, By Powder Bed Fusion, By Region, 2019-2032 (US$ Mn)
11.2.2. Market Dynamics for Powder Bed Fusion
11.2.2.1. Drivers
11.2.2.2. Restraints
11.2.2.3. Opportunities
11.2.2.4. Trends
11.3. VAT Photopolymerization
11.3.1. Global 3D Printing in Healthcare Market, By VAT Photopolymerization, By Region, 2019-2032 (US$ Mn)
11.3.2. Market Dynamics for VAT Photopolymerization
11.3.2.1. Drivers
11.3.2.2. Restraints
11.3.2.3. Opportunities
11.3.2.4. Trends
11.4. Material Extrusion
11.4.1. Global 3D Printing in Healthcare Market, By Material Extrusion, By Region, 2019-2032 (US$ Mn)
11.4.2. Market Dynamics for Material Extrusion
11.4.2.1. Drivers
11.4.2.2. Restraints
11.4.2.3. Opportunities
11.4.2.4. Trends

12. Global 3D Printing in Healthcare Market, By Type
12.1. Global 3D Printing in Healthcare Market Overview, by Type
12.1.1. Global 3D Printing in Healthcare Market Revenue Share, By Type, 2023 Vs 2032 (in %)
12.2. 3D Printers
12.2.1. Global 3D Printing in Healthcare Market, By 3D Printers, By Region, 2019-2032 (US$ Mn)
12.2.2. Market Dynamics for 3D Printers
12.2.2.1. Drivers
12.2.2.2. Restraints
12.2.2.3. Opportunities
12.2.2.4. Trends
12.3. Materials
12.3.1. Global 3D Printing in Healthcare Market, By Materials, By Region, 2019-2032 (US$ Mn)
12.3.2. Market Dynamics for Materials
12.3.2.1. Drivers
12.3.2.2. Restraints
12.3.2.3. Opportunities
12.3.2.4. Trends
12.4. Services
12.4.1. Global 3D Printing in Healthcare Market, By Services, By Region, 2019-2032 (US$ Mn)
12.4.2. Market Dynamics for Services
12.4.2.1. Drivers
12.4.2.2. Restraints
12.4.2.3. Opportunities
12.4.2.4. Trends

13. Global 3D Printing in Healthcare Market, By Application
13.1. Global 3D Printing in Healthcare Market Overview, by Application
13.1.1. Global 3D Printing in Healthcare Market Revenue Share, By Application, 2023 Vs 2032 (in %)
13.2. Medical Models and Anatomical Structures
13.2.1. Global 3D Printing in Healthcare Market, By Medical Models and Anatomical Structures, By Region, 2019-2032 (US$ Mn)
13.2.2. Market Dynamics for Medical Models and Anatomical Structures
13.2.2.1. Drivers
13.2.2.2. Restraints
13.2.2.3. Opportunities
13.2.2.4. Trends
13.3. Dental Products (Crowns, Bridges, etc.)
13.3.1. Global 3D Printing in Healthcare Market, By Dental Products (Crowns, Bridges, etc.), By Region, 2019-2032 (US$ Mn)
13.3.2. Market Dynamics for Dental Products (Crowns, Bridges, etc.)
13.3.2.1. Drivers
13.3.2.2. Restraints
13.3.2.3. Opportunities
13.3.2.4. Trends
13.4. Orthopedic Implants
13.4.1. Global 3D Printing in Healthcare Market, By Orthopedic Implants, By Region, 2019-2032 (US$ Mn)
13.4.2. Market Dynamics for Orthopedic Implants
13.4.2.1. Drivers
13.4.2.2. Restraints
13.4.2.3. Opportunities
13.4.2.4. Trends
13.5. Prosthetics and Orthotics
13.5.1. Global 3D Printing in Healthcare Market, By Prosthetics and Orthotics, By Region, 2019-2032 (US$ Mn)
13.5.2. Market Dynamics for Prosthetics and Orthotics
13.5.2.1. Drivers
13.5.2.2. Restraints
13.5.2.3. Opportunities
13.5.2.4. Trends

14. Global 3D Printing in Healthcare Market, By Regulatory Approval Status
14.1. Global 3D Printing in Healthcare Market Overview, by Regulatory Approval Status
14.1.1. Global 3D Printing in Healthcare Market Revenue Share, By Regulatory Approval Status, 2023 Vs 2032 (in %)
14.2. FDA-Approved Products
14.2.1. Global 3D Printing in Healthcare Market, By FDA-Approved Products, By Region, 2019-2032 (US$ Mn)
14.2.2. Market Dynamics for FDA-Approved Products
14.2.2.1. Drivers
14.2.2.2. Restraints
14.2.2.3. Opportunities
14.2.2.4. Trends
14.3. CE Marked Products
14.3.1. Global 3D Printing in Healthcare Market, By CE Marked Products, By Region, 2019-2032 (US$ Mn)
14.3.2. Market Dynamics for CE Marked Products
14.3.2.1. Drivers
14.3.2.2. Restraints
14.3.2.3. Opportunities
14.3.2.4. Trends

15. Global 3D Printing in Healthcare Market, By Region
15.1. Global 3D Printing in Healthcare Market Overview, by Region
15.1.1. Global 3D Printing in Healthcare Market, By Region, 2023 vs 2032 (in%)
15.2. Technology
15.2.1. Global 3D Printing in Healthcare Market, By Technology, 2019-2032 (US$ Mn)
15.3. End-User
15.3.1. Global 3D Printing in Healthcare Market, By End-User, 2019-2032 (US$ Mn)
15.4. Material
15.4.1. Global 3D Printing in Healthcare Market, By Material, 2019-2032 (US$ Mn)
15.5. Process
15.5.1. Global 3D Printing in Healthcare Market, By Process, 2019-2032 (US$ Mn)
15.6. Type
15.6.1. Global 3D Printing in Healthcare Market, By Type, 2019-2032 (US$ Mn)
15.7. Application
15.7.1. Global 3D Printing in Healthcare Market, By Application, 2019-2032 (US$ Mn)
15.8. Regulatory Approval Status
15.8.1. Global 3D Printing in Healthcare Market, By Regulatory Approval Status, 2019-2032 (US$ Mn)

16. North America 3D Printing in Healthcare Market Analysis
16.1. Overview
16.1.1. Market Dynamics for North America
16.1.1.1. Drivers
16.1.1.2. Restraints
16.1.1.3. Opportunities
16.1.1.4. Trends
16.2. North America 3D Printing in Healthcare Market, by Technology, 2019-2032(US$ Mn)
16.2.1. Overview
16.2.2. SRC Analysis
16.3. North America 3D Printing in Healthcare Market, by End-User, 2019-2032(US$ Mn)
16.3.1. Overview
16.3.2. SRC Analysis
16.4. North America 3D Printing in Healthcare Market, by Material, 2019-2032(US$ Mn)
16.4.1. Overview
16.4.2. SRC Analysis
16.5. North America 3D Printing in Healthcare Market, by Process, 2019-2032(US$ Mn)
16.5.1. Overview
16.5.2. SRC Analysis
16.6. North America 3D Printing in Healthcare Market, by Type, 2019-2032(US$ Mn)
16.6.1. Overview
16.6.2. SRC Analysis
16.7. North America 3D Printing in Healthcare Market, by Application, 2019-2032(US$ Mn)
16.7.1. Overview
16.7.2. SRC Analysis
16.8. North America 3D Printing in Healthcare Market, by Regulatory Approval Status, 2019-2032(US$ Mn)
16.8.1. Overview
16.8.2. SRC Analysis
16.9. North America 3D Printing in Healthcare Market, by Country, 2019-2032 (US$ Mn)
16.9.1. North America 3D Printing in Healthcare Market, by Country, 2023 Vs 2032 (in%)
16.9.2. U.S.
16.9.3. Canada
16.9.4. Mexico

17. Europe 3D Printing in Healthcare Market Analysis
17.1. Overview
17.1.1. Market Dynamics for North America
17.1.1.1. Drivers
17.1.1.2. Restraints
17.1.1.3. Opportunities
17.1.1.4. Trends
17.2. Europe 3D Printing in Healthcare Market, by Technology, 2019-2032(US$ Mn)
17.2.1. Overview
17.2.2. SRC Analysis
17.3. Europe 3D Printing in Healthcare Market, by End-User, 2019-2032(US$ Mn)
17.3.1. Overview
17.3.2. SRC Analysis
17.4. Europe 3D Printing in Healthcare Market, by Material, 2019-2032(US$ Mn)
17.4.1. Overview
17.4.2. SRC Analysis
17.5. Europe 3D Printing in Healthcare Market, by Process, 2019-2032(US$ Mn)
17.5.1. Overview
17.5.2. SRC Analysis
17.6. Europe 3D Printing in Healthcare Market, by Type, 2019-2032(US$ Mn)
17.6.1. Overview
17.6.2. SRC Analysis
17.7. Europe 3D Printing in Healthcare Market, by Application, 2019-2032(US$ Mn)
17.7.1. Overview
17.7.2. SRC Analysis
17.8. Europe 3D Printing in Healthcare Market, by Regulatory Approval Status, 2019-2032(US$ Mn)
17.8.1. Overview
17.8.2. SRC Analysis
17.9. Europe 3D Printing in Healthcare Market, by Country, 2019-2032 (US$ Mn)
17.9.1. Europe 3D Printing in Healthcare Market, by Country, 2023 Vs 2032 (in%)
17.9.2. UK
17.9.3. France
17.9.4. Germany
17.9.5. Italy
17.9.6. Spain
17.9.7. Benelux
17.9.8. Russia
17.9.9. Rest of Europe

18. Asia Pacific 3D Printing in Healthcare Market Analysis
18.1. Overview
18.1.1. Market Dynamics for North America
18.1.1.1. Drivers
18.1.1.2. Restraints
18.1.1.3. Opportunities
18.1.1.4. Trends
18.2. Asia Pacific 3D Printing in Healthcare Market, by Technology, 2019-2032(US$ Mn)
18.2.1. Overview
18.2.2. SRC Analysis
18.3. Asia Pacific 3D Printing in Healthcare Market, by End-User, 2019-2032(US$ Mn)
18.3.1. Overview
18.3.2. SRC Analysis
18.4. Asia Pacific 3D Printing in Healthcare Market, by Material, 2019-2032(US$ Mn)
18.4.1. Overview
18.4.2. SRC Analysis
18.5. Asia Pacific 3D Printing in Healthcare Market, by Process, 2019-2032(US$ Mn)
18.5.1. Overview
18.5.2. SRC Analysis
18.6. Asia Pacific 3D Printing in Healthcare Market, by Type, 2019-2032(US$ Mn)
18.6.1. Overview
18.6.2. SRC Analysis
18.7. Asia Pacific 3D Printing in Healthcare Market, by Application, 2019-2032(US$ Mn)
18.7.1. Overview
18.7.2. SRC Analysis
18.8. Asia Pacific 3D Printing in Healthcare Market, by Regulatory Approval Status, 2019-2032(US$ Mn)
18.8.1. Overview
18.8.2. SRC Analysis
18.9. Asia Pacific 3D Printing in Healthcare Market, by Country, 2019-2032 (US$ Mn)
18.9.1. Asia Pacific 3D Printing in Healthcare Market, by Country, 2023 Vs 2032 (in%)
18.9.2. China
18.9.3. Japan
18.9.4. India
18.9.5. South Korea
18.9.6. South East Asia
18.9.7. Rest of Asia Pacific

19. Latin America 3D Printing in Healthcare Market Analysis
19.1. Overview
19.1.1. Market Dynamics for North America
19.1.1.1. Drivers
19.1.1.2. Restraints
19.1.1.3. Opportunities
19.1.1.4. Trends
19.2. Latin America 3D Printing in Healthcare Market, by Technology, 2019-2032(US$ Mn)
19.2.1. Overview
19.2.2. SRC Analysis
19.3. Latin America 3D Printing in Healthcare Market, by End-User, 2019-2032(US$ Mn)
19.3.1. Overview
19.3.2. SRC Analysis
19.4. Latin America 3D Printing in Healthcare Market, by Material, 2019-2032(US$ Mn)
19.4.1. Overview
19.4.2. SRC Analysis
19.5. Latin America 3D Printing in Healthcare Market, by Process, 2019-2032(US$ Mn)
19.5.1. Overview
19.5.2. SRC Analysis
19.6. Latin America 3D Printing in Healthcare Market, by Type, 2019-2032(US$ Mn)
19.6.1. Overview
19.6.2. SRC Analysis
19.7. Latin America 3D Printing in Healthcare Market, by Application, 2019-2032(US$ Mn)
19.7.1. Overview
19.7.2. SRC Analysis
19.8. Latin America 3D Printing in Healthcare Market, by Regulatory Approval Status, 2019-2032(US$ Mn)
19.8.1. Overview
19.8.2. SRC Analysis
19.9. Latin America 3D Printing in Healthcare Market, by Country, 2019-2032 (US$ Mn)
19.9.1. Latin America 3D Printing in Healthcare Market, by Country, 2023 Vs 2032 (in%)
19.9.2. Brazil
19.9.3. Argentina
19.9.4. Rest of Latin America

20. Middle East 3D Printing in Healthcare Market Analysis
20.1. Overview
20.1.1. Market Dynamics for North America
20.1.1.1. Drivers
20.1.1.2. Restraints
20.1.1.3. Opportunities
20.1.1.4. Trends
20.2. Middle East 3D Printing in Healthcare Market, by Technology, 2019-2032(US$ Mn)
20.2.1. Overview
20.2.2. SRC Analysis
20.3. Middle East 3D Printing in Healthcare Market, by End-User, 2019-2032(US$ Mn)
20.3.1. Overview
20.3.2. SRC Analysis
20.4. Middle East 3D Printing in Healthcare Market, by Material, 2019-2032(US$ Mn)
20.4.1. Overview
20.4.2. SRC Analysis
20.5. Middle East 3D Printing in Healthcare Market, by Process, 2019-2032(US$ Mn)
20.5.1. Overview
20.5.2. SRC Analysis
20.6. Middle East 3D Printing in Healthcare Market, by Type, 2019-2032(US$ Mn)
20.6.1. Overview
20.6.2. SRC Analysis
20.7. Middle East 3D Printing in Healthcare Market, by Application, 2019-2032(US$ Mn)
20.7.1. Overview
20.7.2. SRC Analysis
20.8. Middle East 3D Printing in Healthcare Market, by Regulatory Approval Status, 2019-2032(US$ Mn)
20.8.1. Overview
20.8.2. SRC Analysis
20.9. Middle East 3D Printing in Healthcare Market, by Country, 2019-2032 (US$ Mn)
20.9.1. Middle East 3D Printing in Healthcare Market, by Country, 2023 Vs 2032 (in%)
20.9.2. UAE
20.9.3. Saudi Arabia
20.9.4. Rest of Middle East

21. Africa 3D Printing in Healthcare Market Analysis
21.1. Overview
21.1.1. Market Dynamics for North America
21.1.1.1. Drivers
21.1.1.2. Restraints
21.1.1.3. Opportunities
21.1.1.4. Trends
21.2. Africa 3D Printing in Healthcare Market, by Technology, 2019-2032(US$ Mn)
21.2.1. Overview
21.2.2. SRC Analysis
21.3. Africa 3D Printing in Healthcare Market, by End-User, 2019-2032(US$ Mn)
21.3.1. Overview
21.3.2. SRC Analysis
21.4. Africa 3D Printing in Healthcare Market, by Material, 2019-2032(US$ Mn)
21.4.1. Overview
21.4.2. SRC Analysis
21.5. Africa 3D Printing in Healthcare Market, by Process, 2019-2032(US$ Mn)
21.5.1. Overview
21.5.2. SRC Analysis
21.6. Africa 3D Printing in Healthcare Market, by Type, 2019-2032(US$ Mn)
21.6.1. Overview
21.6.2. SRC Analysis
21.7. Africa 3D Printing in Healthcare Market, by Application, 2019-2032(US$ Mn)
21.7.1. Overview
21.7.2. SRC Analysis
21.8. Africa 3D Printing in Healthcare Market, by Regulatory Approval Status, 2019-2032(US$ Mn)
21.8.1. Overview
21.8.2. SRC Analysis
21.9. Africa 3D Printing in Healthcare Market, by Country, 2019-2032 (US$ Mn)
21.9.1. Middle East 3D Printing in Healthcare Market, by Country, 2023 Vs 2032 (in%)
21.9.2. South Africa
21.9.3. Egypt
21.9.4. Rest of Africa

22. Company Profiles
22.1. Organovo Holdings Inc.
22.1.1. Company Overview
22.1.2. Products/Services Portfolio
22.1.3. Geographical Presence
22.1.4. SWOT Analysis
22.1.5. Financial Summary
22.1.5.1. Market Revenue and Net Profit (2019-2023)
22.1.5.2. Business Segment Revenue Analysis
22.1.5.3. Geographical Revenue Analysis
22.2. Stratasys Ltd
22.3. The ExOne Company
22.4. General Electric (GE Additive)
22.5. 3D Systems Corporation
22.6. Oxford Performance Materials Inc.
22.7. Formlabs Inc.
22.8. SLM Solutions Group AG
22.9. Materialise NV
22.10. Protolabs Inc.
22.11. Others

23. Research Methodology
23.1. Research Methodology
23.2. Phase I – Secondary Research
23.3. Phase II – Data Modelling
23.3.1. Company Share Analysis Model
23.3.2. Revenue Based Modelling
23.4. Phase III – Primary Research
23.5. Research Limitations
23.5.1. Assumptions

List of Figures
FIG. 1 Global 3D Printing in Healthcare Market: Research Methodology
FIG. 2 Market Size Estimation – Top Down & Bottom up Approach
FIG. 3 Global 3D Printing in Healthcare Market Segmentation
FIG. 4 Global 3D Printing in Healthcare Market, by Technology, 2023 (US$ Mn)
FIG. 5 Global 3D Printing in Healthcare Market, by End-User, 2023 (US$ Mn)
FIG. 6 Global 3D Printing in Healthcare Market, by Material, 2023 (US$ Mn)
FIG. 7 Global 3D Printing in Healthcare Market, by Process, 2023 (US$ Mn)
FIG. 8 Global 3D Printing in Healthcare Market, by Type, 2023 (US$ Mn)
FIG. 9 Global 3D Printing in Healthcare Market, by Application, 2023 (US$ Mn)
FIG. 10 Global 3D Printing in Healthcare Market, by Regulatory Approval Status, 2023 (US$ Mn)
FIG. 11 Global 3D Printing in Healthcare Market, by Geography, 2023 (US$ Mn)
FIG. 12 Attractive Investment Proposition, by Technology, 2023
FIG. 13 Attractive Investment Proposition, by End-User, 2023
FIG. 14 Attractive Investment Proposition, by Material, 2023
FIG. 15 Attractive Investment Proposition, by Process, 2023
FIG. 16 Attractive Investment Proposition, by Type, 2023
FIG. 17 Attractive Investment Proposition, by Application, 2023
FIG. 18 Attractive Investment Proposition, by Regulatory Approval Status, 2023
FIG. 19 Attractive Investment Proposition, by Geography, 2023
FIG. 20 Global Market Share Analysis of Key 3D Printing in Healthcare Market Manufacturers, 2023
FIG. 21 Global Market Positioning of Key 3D Printing in Healthcare Market Manufacturers, 2023
FIG. 22 Global 3D Printing in Healthcare Market Value Contribution, By Technology, 2023 & 2032 (Value %)
FIG. 23 Global 3D Printing in Healthcare Market, by Stereolithography (SLA), Value, 2019-2032 (US$ Mn)
FIG. 24 Global 3D Printing in Healthcare Market, by Fused Deposition Modeling (FDM), Value, 2019-2032 (US$ Mn)
FIG. 25 Global 3D Printing in Healthcare Market, by Selective Laser Sintering (SLS), Value, 2019-2032 (US$ Mn)
FIG. 26 Global 3D Printing in Healthcare Market, by Digital Light Processing (DLP), Value, 2019-2032 (US$ Mn)
FIG. 27 Global 3D Printing in Healthcare Market, by PolyJet/MultiJet Printing, Value, 2019-2032 (US$ Mn)
FIG. 28 Global 3D Printing in Healthcare Market, by Bioprinting, Value, 2019-2032 (US$ Mn)
FIG. 29 Global 3D Printing in Healthcare Market Value Contribution, By End-User, 2023 & 2032 (Value %)
FIG. 30 Global 3D Printing in Healthcare Market, by Hospitals and Clinics, Value, 2019-2032 (US$ Mn)
FIG. 31 Global 3D Printing in Healthcare Market, by Dental Laboratories, Value, 2019-2032 (US$ Mn)
FIG. 32 Global 3D Printing in Healthcare Market, by Research Institutions, Value, 2019-2032 (US$ Mn)
FIG. 33 Global 3D Printing in Healthcare Market, by Others, Value, 2019-2032 (US$ Mn)
FIG. 34 Global 3D Printing in Healthcare Market Value Contribution, By Material, 2023 & 2032 (Value %)
FIG. 35 Global 3D Printing in Healthcare Market, by Plastics, Value, 2019-2032 (US$ Mn)
FIG. 36 Global 3D Printing in Healthcare Market, by Metals, Value, 2019-2032 (US$ Mn)
FIG. 37 Global 3D Printing in Healthcare Market, by Ceramics, Value, 2019-2032 (US$ Mn)
FIG. 38 Global 3D Printing in Healthcare Market, by Biomaterials, Value, 2019-2032 (US$ Mn)
FIG. 39 Global 3D Printing in Healthcare Market Value Contribution, By Process, 2023 & 2032 (Value %)
FIG. 40 Global 3D Printing in Healthcare Market, by Powder Bed Fusion, Value, 2019-2032 (US$ Mn)
FIG. 41 Global 3D Printing in Healthcare Market, by VAT Photopolymerization, Value, 2019-2032 (US$ Mn)
FIG. 42 Global 3D Printing in Healthcare Market, by Material Extrusion, Value, 2019-2032 (US$ Mn)
FIG. 43 Global 3D Printing in Healthcare Market Value Contribution, By Type, 2023 & 2032 (Value %)
FIG. 44 Global 3D Printing in Healthcare Market, by 3D Printers, Value, 2019-2032 (US$ Mn)
FIG. 45 Global 3D Printing in Healthcare Market, by Materials, Value, 2019-2032 (US$ Mn)
FIG. 46 Global 3D Printing in Healthcare Market, by Services, Value, 2019-2032 (US$ Mn)
FIG. 47 Global 3D Printing in Healthcare Market Value Contribution, By Application, 2023 & 2032 (Value %)
FIG. 48 Global 3D Printing in Healthcare Market, by Medical Models and Anatomical Structures, Value, 2019-2032 (US$ Mn)
FIG. 49 Global 3D Printing in Healthcare Market, by Dental Products (Crowns, Bridges, etc.), Value, 2019-2032 (US$ Mn)
FIG. 50 Global 3D Printing in Healthcare Market, by Orthopedic Implants, Value, 2019-2032 (US$ Mn)
FIG. 51 Global 3D Printing in Healthcare Market, by Prosthetics and Orthotics, Value, 2019-2032 (US$ Mn)
FIG. 52 Global 3D Printing in Healthcare Market Value Contribution, By Regulatory Approval Status, 2023 & 2032 (Value %)
FIG. 53 Global 3D Printing in Healthcare Market, by FDA-Approved Products, Value, 2019-2032 (US$ Mn)
FIG. 54 Global 3D Printing in Healthcare Market, by CE Marked Products, Value, 2019-2032 (US$ Mn)
FIG. 55 North America 3D Printing in Healthcare Market, 2019-2032 (US$ Mn)
FIG. 56 U.S. 3D Printing in Healthcare Market, 2019-2032 (US$ Mn)
FIG. 57 Canada 3D Printing in Healthcare Market, 2019-2032 (US$ Mn)
FIG. 58 Mexico 3D Printing in Healthcare Market, 2019-2032 (US$ Mn)
FIG. 59 Europe 3D Printing in Healthcare Market, 2019-2032 (US$ Mn)
FIG. 60 Germany 3D Printing in Healthcare Market, 2019-2032 (US$ Mn)
FIG. 61 France 3D Printing in Healthcare Market, 2019-2032 (US$ Mn)
FIG. 62 U.K. 3D Printing in Healthcare Market, 2019-2032 (US$ Mn)
FIG. 63 Italy 3D Printing in Healthcare Market, 2019-2032 (US$ Mn)
FIG. 64 Spain 3D Printing in Healthcare Market, 2019-2032 (US$ Mn)
FIG. 65 Benelux 3D Printing in Healthcare Market, 2019-2032 (US$ Mn)
FIG. 66 Russia 3D Printing in Healthcare Market, 2019-2032 (US$ Mn)
FIG. 67 Rest of Europe 3D Printing in Healthcare Market, 2019-2032 (US$ Mn)
FIG. 68 Asia Pacific 3D Printing in Healthcare Market, 2019-2032 (US$ Mn)
FIG. 69 China 3D Printing in Healthcare Market, 2019-2032 (US$ Mn)
FIG. 70 Japan 3D Printing in Healthcare Market, 2019-2032 (US$ Mn)
FIG. 71 India 3D Printing in Healthcare Market, 2019-2032 (US$ Mn)
FIG. 72 South Korea 3D Printing in Healthcare Market, 2019-2032 (US$ Mn)
FIG. 73 South-East Asia 3D Printing in Healthcare Market, 2019-2032 (US$ Mn)
FIG. 74 Rest of Asia Pacific 3D Printing in Healthcare Market, 2019-2032 (US$ Mn)
FIG. 75 Latin America 3D Printing in Healthcare Market, 2019-2032 (US$ Mn)
FIG. 76 Brazil 3D Printing in Healthcare Market, 2019-2032 (US$ Mn)
FIG. 77 Argentina 3D Printing in Healthcare Market, 2019-2032 (US$ Mn)
FIG. 78 Rest of Latin America 3D Printing in Healthcare Market, 2019-2032 (US$ Mn)
FIG. 79 Middle East 3D Printing in Healthcare Market, 2019-2032 (US$ Mn)
FIG. 80 UAE 3D Printing in Healthcare Market, 2019-2032 (US$ Mn)
FIG. 81 Saudi Arabia 3D Printing in Healthcare Market, 2019-2032 (US$ Mn)
FIG. 82 Rest of Middle East 3D Printing in Healthcare Market, 2019-2032 (US$ Mn)
FIG. 83 Africa 3D Printing in Healthcare Market, 2019-2032 (US$ Mn)
FIG. 84 South Africa 3D Printing in Healthcare Market, 2019-2032 (US$ Mn)
FIG. 85 Egypt 3D Printing in Healthcare Market, 2019-2032 (US$ Mn)
FIG. 86 Rest of Africa 3D Printing in Healthcare Market, 2019-2032 (US$ Mn)
List of Tables
TABLE 1 Market Snapshot: Global 3D Printing in Healthcare Market
TABLE 2 Global 3D Printing in Healthcare Market: Market Drivers Impact Analysis
TABLE 3 Global 3D Printing in Healthcare Market: Market Restraints Impact Analysis
TABLE 4 Global 3D Printing in Healthcare Market, by Competitive Benchmarking, 2023
TABLE 5 Global 3D Printing in Healthcare Market, by Geographical Presence Analysis, 2023
TABLE 6 Global 3D Printing in Healthcare Market, by Key Strategies Analysis, 2023
TABLE 7 Global 3D Printing in Healthcare Market, by Stereolithography (SLA), By Region, 2019-2023 (US$ Mn)
TABLE 8 Global 3D Printing in Healthcare Market, by Stereolithography (SLA), By Region, 2024-2032 (US$ Mn)
TABLE 9 Global 3D Printing in Healthcare Market, by Fused Deposition Modeling (FDM), By Region, 2019-2023 (US$ Mn)
TABLE 10 Global 3D Printing in Healthcare Market, by Fused Deposition Modeling (FDM), By Region, 2024-2032 (US$ Mn)
TABLE 11 Global 3D Printing in Healthcare Market, by Selective Laser Sintering (SLS), By Region, 2019-2023 (US$ Mn)
TABLE 12 Global 3D Printing in Healthcare Market, by Selective Laser Sintering (SLS), By Region, 2024-2032 (US$ Mn)
TABLE 13 Global 3D Printing in Healthcare Market, by Digital Light Processing (DLP), By Region, 2019-2023 (US$ Mn)
TABLE 14 Global 3D Printing in Healthcare Market, by Digital Light Processing (DLP), By Region, 2024-2032 (US$ Mn)
TABLE 15 Global 3D Printing in Healthcare Market, by PolyJet/MultiJet Printing, By Region, 2019-2023 (US$ Mn)
TABLE 16 Global 3D Printing in Healthcare Market, by PolyJet/MultiJet Printing, By Region, 2024-2032 (US$ Mn)
TABLE 17 Global 3D Printing in Healthcare Market, by Bioprinting, By Region, 2019-2023 (US$ Mn)
TABLE 18 Global 3D Printing in Healthcare Market, by Bioprinting, By Region, 2024-2032 (US$ Mn)
TABLE 19 Global 3D Printing in Healthcare Market, by Hospitals and Clinics, By Region, 2019-2023 (US$ Mn)
TABLE 20 Global 3D Printing in Healthcare Market, by Hospitals and Clinics, By Region, 2024-2032 (US$ Mn)
TABLE 21 Global 3D Printing in Healthcare Market, by Dental Laboratories, By Region, 2019-2023 (US$ Mn)
TABLE 22 Global 3D Printing in Healthcare Market, by Dental Laboratories, By Region, 2024-2032 (US$ Mn)
TABLE 23 Global 3D Printing in Healthcare Market, by Research Institutions, By Region, 2019-2023 (US$ Mn)
TABLE 24 Global 3D Printing in Healthcare Market, by Research Institutions, By Region, 2024-2032 (US$ Mn)
TABLE 25 Global 3D Printing in Healthcare Market, by Others, By Region, 2019-2023 (US$ Mn)
TABLE 26 Global 3D Printing in Healthcare Market, by Others, By Region, 2024-2032 (US$ Mn)
TABLE 27 Global 3D Printing in Healthcare Market, by Plastics, By Region, 2019-2023 (US$ Mn)
TABLE 28 Global 3D Printing in Healthcare Market, by Plastics, By Region, 2024-2032 (US$ Mn)
TABLE 29 Global 3D Printing in Healthcare Market, by Metals, By Region, 2019-2023 (US$ Mn)
TABLE 30 Global 3D Printing in Healthcare Market, by Metals, By Region, 2024-2032 (US$ Mn)
TABLE 31 Global 3D Printing in Healthcare Market, by Ceramics, By Region, 2019-2023 (US$ Mn)
TABLE 32 Global 3D Printing in Healthcare Market, by Ceramics, By Region, 2024-2032 (US$ Mn)
TABLE 33 Global 3D Printing in Healthcare Market, by Biomaterials, By Region, 2019-2023 (US$ Mn)
TABLE 34 Global 3D Printing in Healthcare Market, by Biomaterials, By Region, 2024-2032 (US$ Mn)
TABLE 35 Global 3D Printing in Healthcare Market, by Powder Bed Fusion, By Region, 2019-2023 (US$ Mn)
TABLE 36 Global 3D Printing in Healthcare Market, by Powder Bed Fusion, By Region, 2024-2032 (US$ Mn)
TABLE 37 Global 3D Printing in Healthcare Market, by VAT Photopolymerization, By Region, 2019-2023 (US$ Mn)
TABLE 38 Global 3D Printing in Healthcare Market, by VAT Photopolymerization, By Region, 2024-2032 (US$ Mn)
TABLE 39 Global 3D Printing in Healthcare Market, by Material Extrusion, By Region, 2019-2023 (US$ Mn)
TABLE 40 Global 3D Printing in Healthcare Market, by Material Extrusion, By Region, 2024-2032 (US$ Mn)
TABLE 41 Global 3D Printing in Healthcare Market, by 3D Printers, By Region, 2019-2023 (US$ Mn)
TABLE 42 Global 3D Printing in Healthcare Market, by 3D Printers, By Region, 2024-2032 (US$ Mn)
TABLE 43 Global 3D Printing in Healthcare Market, by Materials, By Region, 2019-2023 (US$ Mn)
TABLE 44 Global 3D Printing in Healthcare Market, by Materials, By Region, 2024-2032 (US$ Mn)
TABLE 45 Global 3D Printing in Healthcare Market, by Services, By Region, 2019-2023 (US$ Mn)
TABLE 46 Global 3D Printing in Healthcare Market, by Services, By Region, 2024-2032 (US$ Mn)
TABLE 47 Global 3D Printing in Healthcare Market, by Medical Models and Anatomical Structures, By Region, 2019-2023 (US$ Mn)
TABLE 48 Global 3D Printing in Healthcare Market, by Medical Models and Anatomical Structures, By Region, 2024-2032 (US$ Mn)
TABLE 49 Global 3D Printing in Healthcare Market, by Dental Products (Crowns, Bridges, etc.), By Region, 2019-2023 (US$ Mn)
TABLE 50 Global 3D Printing in Healthcare Market, by Dental Products (Crowns, Bridges, etc.), By Region, 2024-2032 (US$ Mn)
TABLE 51 Global 3D Printing in Healthcare Market, by Orthopedic Implants, By Region, 2019-2023 (US$ Mn)
TABLE 52 Global 3D Printing in Healthcare Market, by Orthopedic Implants, By Region, 2024-2032 (US$ Mn)
TABLE 53 Global 3D Printing in Healthcare Market, by Prosthetics and Orthotics, By Region, 2019-2023 (US$ Mn)
TABLE 54 Global 3D Printing in Healthcare Market, by Prosthetics and Orthotics, By Region, 2024-2032 (US$ Mn)
TABLE 55 Global 3D Printing in Healthcare Market, by FDA-Approved Products, By Region, 2019-2023 (US$ Mn)
TABLE 56 Global 3D Printing in Healthcare Market, by FDA-Approved Products, By Region, 2024-2032 (US$ Mn)
TABLE 57 Global 3D Printing in Healthcare Market, by CE Marked Products, By Region, 2019-2023 (US$ Mn)
TABLE 58 Global 3D Printing in Healthcare Market, by CE Marked Products, By Region, 2024-2032 (US$ Mn)
TABLE 59 Global 3D Printing in Healthcare Market, by Technology, 2019-2023 (US$ Mn)
TABLE 60 Global 3D Printing in Healthcare Market, by Technology, 2024-2032 (US$ Mn)
TABLE 61 Global 3D Printing in Healthcare Market, by End-User, 2019-2023 (US$ Mn)
TABLE 62 Global 3D Printing in Healthcare Market, by End-User, 2024-2032 (US$ Mn)
TABLE 63 Global 3D Printing in Healthcare Market, by Material, 2019-2023 (US$ Mn)
TABLE 64 Global 3D Printing in Healthcare Market, by Material, 2024-2032 (US$ Mn)
TABLE 65 Global 3D Printing in Healthcare Market, by Process, By Region, 2019-2023 (US$ Mn)
TABLE 66 Global 3D Printing in Healthcare Market, by Process, By Region, 2024-2032 (US$ Mn)
TABLE 67 Global 3D Printing in Healthcare Market, by Type, 2019-2023 (US$ Mn)
TABLE 68 Global 3D Printing in Healthcare Market, by Type, 2024-2032 (US$ Mn)
TABLE 69 Global 3D Printing in Healthcare Market, by Application, 2019-2023 (US$ Mn)
TABLE 70 Global 3D Printing in Healthcare Market, by Application, 2024-2032 (US$ Mn)
TABLE 71 Global 3D Printing in Healthcare Market, by Regulatory Approval Status, 2019-2023 (US$ Mn)
TABLE 72 Global 3D Printing in Healthcare Market, by Regulatory Approval Status, 2024-2032 (US$ Mn)
TABLE 73 Global 3D Printing in Healthcare Market, by Region, 2019-2023 (US$ Mn)
TABLE 74 Global 3D Printing in Healthcare Market, by Region, 2024-2032 (US$ Mn)
TABLE 75 North America 3D Printing in Healthcare Market, by Technology, 2019-2023 (US$ Mn)
TABLE 76 North America 3D Printing in Healthcare Market, by Technology, 2024-2032 (US$ Mn)
TABLE 77 North America 3D Printing in Healthcare Market, by End-User, 2019-2023 (US$ Mn)
TABLE 78 North America 3D Printing in Healthcare Market, by End-User, 2024-2032 (US$ Mn)
TABLE 79 North America 3D Printing in Healthcare Market, by Material, 2019-2023 (US$ Mn)
TABLE 80 North America 3D Printing in Healthcare Market, by Material, 2024-2032 (US$ Mn)
TABLE 81 North America 3D Printing in Healthcare Market, by Process, By Region, 2019-2023 (US$ Mn)
TABLE 82 North America 3D Printing in Healthcare Market, by Process, By Region, 2024-2032 (US$ Mn)
TABLE 83 North America 3D Printing in Healthcare Market, by Type, 2019-2023 (US$ Mn)
TABLE 84 North America 3D Printing in Healthcare Market, by Type, 2024-2032 (US$ Mn)
TABLE 85 North America 3D Printing in Healthcare Market, by Application, 2019-2023 (US$ Mn)
TABLE 86 North America 3D Printing in Healthcare Market, by Application, 2024-2032 (US$ Mn)
TABLE 87 North America 3D Printing in Healthcare Market, by Regulatory Approval Status, 2019-2023 (US$ Mn)
TABLE 88 North America 3D Printing in Healthcare Market, by Regulatory Approval Status, 2024-2032 (US$ Mn)
TABLE 89 North America 3D Printing in Healthcare Market, by Country, 2019-2023 (US$ Mn)
TABLE 90 North America 3D Printing in Healthcare Market, by Country, 2024-2032 (US$ Mn)
TABLE 91 United States 3D Printing in Healthcare Market, by Technology, 2019-2023 (US$ Mn)
TABLE 92 United States 3D Printing in Healthcare Market, by Technology, 2024-2032 (US$ Mn)
TABLE 93 United States 3D Printing in Healthcare Market, by End-User, 2019-2023 (US$ Mn)
TABLE 94 United States 3D Printing in Healthcare Market, by End-User, 2024-2032 (US$ Mn)
TABLE 95 United States 3D Printing in Healthcare Market, by Material, 2019-2023 (US$ Mn)
TABLE 96 United States 3D Printing in Healthcare Market, by Material, 2024-2032 (US$ Mn)
TABLE 97 United States 3D Printing in Healthcare Market, by Process, By Region, 2019-2023 (US$ Mn)
TABLE 98 United States 3D Printing in Healthcare Market, by Process, By Region, 2024-2032 (US$ Mn)
TABLE 99 United States 3D Printing in Healthcare Market, by Type, 2019-2023 (US$ Mn)
TABLE 100 United States 3D Printing in Healthcare Market, by Type, 2024-2032 (US$ Mn)
TABLE 101 United States 3D Printing in Healthcare Market, by Application, 2019-2023 (US$ Mn)
TABLE 102 United States 3D Printing in Healthcare Market, by Application, 2024-2032 (US$ Mn)
TABLE 103 United States 3D Printing in Healthcare Market, by Regulatory Approval Status, 2019-2023 (US$ Mn)
TABLE 104 United States 3D Printing in Healthcare Market, by Regulatory Approval Status, 2024-2032 (US$ Mn)
TABLE 105 Canada 3D Printing in Healthcare Market, by Technology, 2019-2023 (US$ Mn)
TABLE 106 Canada 3D Printing in Healthcare Market, by Technology, 2024-2032 (US$ Mn)
TABLE 107 Canada 3D Printing in Healthcare Market, by End-User, 2019-2023 (US$ Mn)
TABLE 108 Canada 3D Printing in Healthcare Market, by End-User, 2024-2032 (US$ Mn)
TABLE 109 Canada 3D Printing in Healthcare Market, by Material, 2019-2023 (US$ Mn)
TABLE 110 Canada 3D Printing in Healthcare Market, by Material, 2024-2032 (US$ Mn)
TABLE 111 Canada 3D Printing in Healthcare Market, by Process, By Region, 2019-2023 (US$ Mn)
TABLE 112 Canada 3D Printing in Healthcare Market, by Process, By Region, 2024-2032 (US$ Mn)
TABLE 113 Canada 3D Printing in Healthcare Market, by Type, 2019-2023 (US$ Mn)
TABLE 114 Canada 3D Printing in Healthcare Market, by Type, 2024-2032 (US$ Mn)
TABLE 115 Canada 3D Printing in Healthcare Market, by Application, 2019-2023 (US$ Mn)
TABLE 116 Canada 3D Printing in Healthcare Market, by Application, 2024-2032 (US$ Mn)
TABLE 117 Canada 3D Printing in Healthcare Market, by Regulatory Approval Status, 2019-2023 (US$ Mn)
TABLE 118 Canada 3D Printing in Healthcare Market, by Regulatory Approval Status, 2024-2032 (US$ Mn)
TABLE 119 Mexico 3D Printing in Healthcare Market, by Technology, 2019-2023 (US$ Mn)
TABLE 120 Mexico 3D Printing in Healthcare Market, by Technology, 2024-2032 (US$ Mn)
TABLE 121 Mexico 3D Printing in Healthcare Market, by End-User, 2019-2023 (US$ Mn)
TABLE 122 Mexico 3D Printing in Healthcare Market, by End-User, 2024-2032 (US$ Mn)
TABLE 123 Mexico 3D Printing in Healthcare Market, by Material, 2019-2023 (US$ Mn)
TABLE 124 Mexico 3D Printing in Healthcare Market, by Material, 2024-2032 (US$ Mn)
TABLE 125 Mexico 3D Printing in Healthcare Market, by Process, By Region, 2019-2023 (US$ Mn)
TABLE 126 Mexico 3D Printing in Healthcare Market, by Process, By Region, 2024-2032 (US$ Mn)
TABLE 127 Mexico 3D Printing in Healthcare Market, by Type, 2019-2023 (US$ Mn)
TABLE 128 Mexico 3D Printing in Healthcare Market, by Type, 2024-2032 (US$ Mn)
TABLE 129 Mexico 3D Printing in Healthcare Market, by Application, 2019-2023 (US$ Mn)
TABLE 130 Mexico 3D Printing in Healthcare Market, by Application, 2024-2032 (US$ Mn)
TABLE 131 Mexico 3D Printing in Healthcare Market, by Regulatory Approval Status, 2019-2023 (US$ Mn)
TABLE 132 Mexico 3D Printing in Healthcare Market, by Regulatory Approval Status, 2024-2032 (US$ Mn)
TABLE 133 Europe 3D Printing in Healthcare Market, by Technology, 2019-2023 (US$ Mn)
TABLE 134 Europe 3D Printing in Healthcare Market, by Technology, 2024-2032 (US$ Mn)
TABLE 135 Europe 3D Printing in Healthcare Market, by End-User, 2019-2023 (US$ Mn)
TABLE 136 Europe 3D Printing in Healthcare Market, by End-User, 2024-2032 (US$ Mn)
TABLE 137 Europe 3D Printing in Healthcare Market, by Material, 2019-2023 (US$ Mn)
TABLE 138 Europe 3D Printing in Healthcare Market, by Material, 2024-2032 (US$ Mn)
TABLE 139 Europe 3D Printing in Healthcare Market, by Process, By Region, 2019-2023 (US$ Mn)
TABLE 140 Europe 3D Printing in Healthcare Market, by Process, By Region, 2024-2032 (US$ Mn)
TABLE 141 Europe 3D Printing in Healthcare Market, by Type, 2019-2023 (US$ Mn)
TABLE 142 Europe 3D Printing in Healthcare Market, by Type, 2024-2032 (US$ Mn)
TABLE 143 Europe 3D Printing in Healthcare Market, by Application, 2019-2023 (US$ Mn)
TABLE 144 Europe 3D Printing in Healthcare Market, by Application, 2024-2032 (US$ Mn)
TABLE 145 Europe 3D Printing in Healthcare Market, by Regulatory Approval Status, 2019-2023 (US$ Mn)
TABLE 146 Europe 3D Printing in Healthcare Market, by Regulatory Approval Status, 2024-2032 (US$ Mn)
TABLE 147 Europe 3D Printing in Healthcare Market, by Country, 2019-2023 (US$ Mn)
TABLE 148 Europe 3D Printing in Healthcare Market, by Country, 2024-2032 (US$ Mn)
TABLE 149 Germany 3D Printing in Healthcare Market, by Technology, 2019-2023 (US$ Mn)
TABLE 150 Germany 3D Printing in Healthcare Market, by Technology, 2024-2032 (US$ Mn)
TABLE 151 Germany 3D Printing in Healthcare Market, by End-User, 2019-2023 (US$ Mn)
TABLE 152 Germany 3D Printing in Healthcare Market, by End-User, 2024-2032 (US$ Mn)
TABLE 153 Germany 3D Printing in Healthcare Market, by Material, 2019-2023 (US$ Mn)
TABLE 154 Germany 3D Printing in Healthcare Market, by Material, 2024-2032 (US$ Mn)
TABLE 155 Germany 3D Printing in Healthcare Market, by Process, By Region, 2019-2023 (US$ Mn)
TABLE 156 Germany 3D Printing in Healthcare Market, by Process, By Region, 2024-2032 (US$ Mn)
TABLE 157 Germany 3D Printing in Healthcare Market, by Type, 2019-2023 (US$ Mn)
TABLE 158 Germany 3D Printing in Healthcare Market, by Type, 2024-2032 (US$ Mn)
TABLE 159 Germany 3D Printing in Healthcare Market, by Application, 2019-2023 (US$ Mn)
TABLE 160 Germany 3D Printing in Healthcare Market, by Application, 2024-2032 (US$ Mn)
TABLE 161 Germany 3D Printing in Healthcare Market, by Regulatory Approval Status, 2019-2023 (US$ Mn)
TABLE 162 Germany 3D Printing in Healthcare Market, by Regulatory Approval Status, 2024-2032 (US$ Mn)
TABLE 163 France 3D Printing in Healthcare Market, by Technology, 2019-2023 (US$ Mn)
TABLE 164 France 3D Printing in Healthcare Market, by Technology, 2024-2032 (US$ Mn)
TABLE 165 France 3D Printing in Healthcare Market, by End-User, 2019-2023 (US$ Mn)
TABLE 166 France 3D Printing in Healthcare Market, by End-User, 2024-2032 (US$ Mn)
TABLE 167 France 3D Printing in Healthcare Market, by Material, 2019-2023 (US$ Mn)
TABLE 168 France 3D Printing in Healthcare Market, by Material, 2024-2032 (US$ Mn)
TABLE 169 France 3D Printing in Healthcare Market, by Process, By Region, 2019-2023 (US$ Mn)
TABLE 170 France 3D Printing in Healthcare Market, by Process, By Region, 2024-2032 (US$ Mn)
TABLE 171 France 3D Printing in Healthcare Market, by Type, 2019-2023 (US$ Mn)
TABLE 172 France 3D Printing in Healthcare Market, by Type, 2024-2032 (US$ Mn)
TABLE 173 France 3D Printing in Healthcare Market, by Application, 2019-2023 (US$ Mn)
TABLE 174 France 3D Printing in Healthcare Market, by Application, 2024-2032 (US$ Mn)
TABLE 175 France 3D Printing in Healthcare Market, by Regulatory Approval Status, 2019-2023 (US$ Mn)
TABLE 176 France 3D Printing in Healthcare Market, by Regulatory Approval Status, 2024-2032 (US$ Mn)
TABLE 177 United Kingdom 3D Printing in Healthcare Market, by Technology, 2019-2023 (US$ Mn)
TABLE 178 United Kingdom 3D Printing in Healthcare Market, by Technology, 2024-2032 (US$ Mn)
TABLE 179 United Kingdom 3D Printing in Healthcare Market, by End-User, 2019-2023 (US$ Mn)
TABLE 180 United Kingdom 3D Printing in Healthcare Market, by End-User, 2024-2032 (US$ Mn)
TABLE 181 United Kingdom 3D Printing in Healthcare Market, by Material, 2019-2023 (US$ Mn)
TABLE 182 United Kingdom 3D Printing in Healthcare Market, by Material, 2024-2032 (US$ Mn)
TABLE 183 United Kingdom 3D Printing in Healthcare Market, by Process, By Region, 2019-2023 (US$ Mn)
TABLE 184 United Kingdom 3D Printing in Healthcare Market, by Process, By Region, 2024-2032 (US$ Mn)
TABLE 185 United Kingdom 3D Printing in Healthcare Market, by Type, 2019-2023 (US$ Mn)
TABLE 186 United Kingdom 3D Printing in Healthcare Market, by Type, 2024-2032 (US$ Mn)
TABLE 187 United Kingdom 3D Printing in Healthcare Market, by Application, 2019-2023 (US$ Mn)
TABLE 188 United Kingdom 3D Printing in Healthcare Market, by Application, 2024-2032 (US$ Mn)
TABLE 189 United Kingdom 3D Printing in Healthcare Market, by Regulatory Approval Status, 2019-2023 (US$ Mn)
TABLE 190 United Kingdom 3D Printing in Healthcare Market, by Regulatory Approval Status, 2024-2032 (US$ Mn)
TABLE 191 Italy 3D Printing in Healthcare Market, by Technology, 2019-2023 (US$ Mn)
TABLE 192 Italy 3D Printing in Healthcare Market, by Technology, 2024-2032 (US$ Mn)
TABLE 193 Italy 3D Printing in Healthcare Market, by End-User, 2019-2023 (US$ Mn)
TABLE 194 Italy 3D Printing in Healthcare Market, by End-User, 2024-2032 (US$ Mn)
TABLE 195 Italy 3D Printing in Healthcare Market, by Material, 2019-2023 (US$ Mn)
TABLE 196 Italy 3D Printing in Healthcare Market, by Material, 2024-2032 (US$ Mn)
TABLE 197 Italy 3D Printing in Healthcare Market, by Process, By Region, 2019-2023 (US$ Mn)
TABLE 198 Italy 3D Printing in Healthcare Market, by Process, By Region, 2024-2032 (US$ Mn)
TABLE 199 Italy 3D Printing in Healthcare Market, by Type, 2019-2023 (US$ Mn)
TABLE 200 Italy 3D Printing in Healthcare Market, by Type, 2024-2032 (US$ Mn)
TABLE 201 Italy 3D Printing in Healthcare Market, by Application, 2019-2023 (US$ Mn)
TABLE 202 Italy 3D Printing in Healthcare Market, by Application, 2024-2032 (US$ Mn)
TABLE 203 Italy 3D Printing in Healthcare Market, by Regulatory Approval Status, 2019-2023 (US$ Mn)
TABLE 204 Italy 3D Printing in Healthcare Market, by Regulatory Approval Status, 2024-2032 (US$ Mn)
TABLE 205 Spain 3D Printing in Healthcare Market, by Technology, 2019-2023 (US$ Mn)
TABLE 206 Spain 3D Printing in Healthcare Market, by Technology, 2024-2032 (US$ Mn)
TABLE 207 Spain 3D Printing in Healthcare Market, by End-User, 2019-2023 (US$ Mn)
TABLE 208 Spain 3D Printing in Healthcare Market, by End-User, 2024-2032 (US$ Mn)
TABLE 209 Spain 3D Printing in Healthcare Market, by Material, 2019-2023 (US$ Mn)
TABLE 210 Spain 3D Printing in Healthcare Market, by Material, 2024-2032 (US$ Mn)
TABLE 211 Spain 3D Printing in Healthcare Market, by Process, By Region, 2019-2023 (US$ Mn)
TABLE 212 Spain 3D Printing in Healthcare Market, by Process, By Region, 2024-2032 (US$ Mn)
TABLE 213 Spain 3D Printing in Healthcare Market, by Type, 2019-2023 (US$ Mn)
TABLE 214 Spain 3D Printing in Healthcare Market, by Type, 2024-2032 (US$ Mn)
TABLE 215 Spain 3D Printing in Healthcare Market, by Application, 2019-2023 (US$ Mn)
TABLE 216 Spain 3D Printing in Healthcare Market, by Application, 2024-2032 (US$ Mn)
TABLE 217 Spain 3D Printing in Healthcare Market, by Regulatory Approval Status, 2019-2023 (US$ Mn)
TABLE 218 Spain 3D Printing in Healthcare Market, by Regulatory Approval Status, 2024-2032 (US$ Mn)
TABLE 219 Benelux 3D Printing in Healthcare Market, by Technology, 2019-2023 (US$ Mn)
TABLE 220 Benelux 3D Printing in Healthcare Market, by Technology, 2024-2032 (US$ Mn)
TABLE 221 Benelux 3D Printing in Healthcare Market, by End-User, 2019-2023 (US$ Mn)
TABLE 222 Benelux 3D Printing in Healthcare Market, by End-User, 2024-2032 (US$ Mn)
TABLE 223 Benelux 3D Printing in Healthcare Market, by Material, 2019-2023 (US$ Mn)
TABLE 224 Benelux 3D Printing in Healthcare Market, by Material, 2024-2032 (US$ Mn)
TABLE 225 Benelux 3D Printing in Healthcare Market, by Process, By Region, 2019-2023 (US$ Mn)
TABLE 226 Benelux 3D Printing in Healthcare Market, by Process, By Region, 2024-2032 (US$ Mn)
TABLE 227 Benelux 3D Printing in Healthcare Market, by Type, 2019-2023 (US$ Mn)
TABLE 228 Benelux 3D Printing in Healthcare Market, by Type, 2024-2032 (US$ Mn)
TABLE 229 Benelux 3D Printing in Healthcare Market, by Application, 2019-2023 (US$ Mn)
TABLE 230 Benelux 3D Printing in Healthcare Market, by Application, 2024-2032 (US$ Mn)
TABLE 231 Benelux 3D Printing in Healthcare Market, by Regulatory Approval Status, 2019-2023 (US$ Mn)
TABLE 232 Benelux 3D Printing in Healthcare Market, by Regulatory Approval Status, 2024-2032 (US$ Mn)
TABLE 233 Russia 3D Printing in Healthcare Market, by Technology, 2019-2023 (US$ Mn)
TABLE 234 Russia 3D Printing in Healthcare Market, by Technology, 2024-2032 (US$ Mn)
TABLE 235 Russia 3D Printing in Healthcare Market, by End-User, 2019-2023 (US$ Mn)
TABLE 236 Russia 3D Printing in Healthcare Market, by End-User, 2024-2032 (US$ Mn)
TABLE 237 Russia 3D Printing in Healthcare Market, by Material, 2019-2023 (US$ Mn)
TABLE 238 Russia 3D Printing in Healthcare Market, by Material, 2024-2032 (US$ Mn)
TABLE 239 Russia 3D Printing in Healthcare Market, by Process, By Region, 2019-2023 (US$ Mn)
TABLE 240 Russia 3D Printing in Healthcare Market, by Process, By Region, 2024-2032 (US$ Mn)
TABLE 241 Russia 3D Printing in Healthcare Market, by Type, 2019-2023 (US$ Mn)
TABLE 242 Russia 3D Printing in Healthcare Market, by Type, 2024-2032 (US$ Mn)
TABLE 243 Russia 3D Printing in Healthcare Market, by Application, 2019-2023 (US$ Mn)
TABLE 244 Russia 3D Printing in Healthcare Market, by Application, 2024-2032 (US$ Mn)
TABLE 245 Russia 3D Printing in Healthcare Market, by Regulatory Approval Status, 2019-2023 (US$ Mn)
TABLE 246 Russia 3D Printing in Healthcare Market, by Regulatory Approval Status, 2024-2032 (US$ Mn)
TABLE 247 Rest of Europe 3D Printing in Healthcare Market, by Technology, 2019-2023 (US$ Mn)
TABLE 248 Rest of Europe 3D Printing in Healthcare Market, by Technology, 2024-2032 (US$ Mn)
TABLE 249 Rest of Europe 3D Printing in Healthcare Market, by End-User, 2019-2023 (US$ Mn)
TABLE 250 Rest of Europe 3D Printing in Healthcare Market, by End-User, 2024-2032 (US$ Mn)
TABLE 251 Rest of Europe 3D Printing in Healthcare Market, by Material, 2019-2023 (US$ Mn)
TABLE 252 Rest of Europe 3D Printing in Healthcare Market, by Material, 2024-2032 (US$ Mn)
TABLE 253 Rest of Europe 3D Printing in Healthcare Market, by Process, By Region, 2019-2023 (US$ Mn)
TABLE 254 Rest of Europe 3D Printing in Healthcare Market, by Process, By Region, 2024-2032 (US$ Mn)
TABLE 255 Rest of Europe 3D Printing in Healthcare Market, by Type, 2019-2023 (US$ Mn)
TABLE 256 Rest of Europe 3D Printing in Healthcare Market, by Type, 2024-2032 (US$ Mn)
TABLE 257 Rest of Europe 3D Printing in Healthcare Market, by Application, 2019-2023 (US$ Mn)
TABLE 258 Rest of Europe 3D Printing in Healthcare Market, by Application, 2024-2032 (US$ Mn)
TABLE 259 Rest of Europe 3D Printing in Healthcare Market, by Regulatory Approval Status, 2019-2023 (US$ Mn)
TABLE 260 Rest of Europe 3D Printing in Healthcare Market, by Regulatory Approval Status, 2024-2032 (US$ Mn)
TABLE 261 Asia Pacific 3D Printing in Healthcare Market, by Technology, 2019-2023 (US$ Mn)
TABLE 262 Asia Pacific 3D Printing in Healthcare Market, by Technology, 2024-2032 (US$ Mn)
TABLE 263 Asia Pacific 3D Printing in Healthcare Market, by End-User, 2019-2023 (US$ Mn)
TABLE 264 Asia Pacific 3D Printing in Healthcare Market, by End-User, 2024-2032 (US$ Mn)
TABLE 265 Asia Pacific 3D Printing in Healthcare Market, by Material, 2019-2023 (US$ Mn)
TABLE 266 Asia Pacific 3D Printing in Healthcare Market, by Material, 2024-2032 (US$ Mn)
TABLE 267 Asia Pacific 3D Printing in Healthcare Market, by Process, By Region, 2019-2023 (US$ Mn)
TABLE 268 Asia Pacific 3D Printing in Healthcare Market, by Process, By Region, 2024-2032 (US$ Mn)
TABLE 269 Asia Pacific 3D Printing in Healthcare Market, by Type, 2019-2023 (US$ Mn)
TABLE 270 Asia Pacific 3D Printing in Healthcare Market, by Type, 2024-2032 (US$ Mn)
TABLE 271 Asia Pacific 3D Printing in Healthcare Market, by Application, 2019-2023 (US$ Mn)
TABLE 272 Asia Pacific 3D Printing in Healthcare Market, by Application, 2024-2032 (US$ Mn)
TABLE 273 Asia Pacific 3D Printing in Healthcare Market, by Regulatory Approval Status, 2019-2023 (US$ Mn)
TABLE 274 Asia Pacific 3D Printing in Healthcare Market, by Regulatory Approval Status, 2024-2032 (US$ Mn)
TABLE 275 China 3D Printing in Healthcare Market, by Technology, 2019-2023 (US$ Mn)
TABLE 276 China 3D Printing in Healthcare Market, by Technology, 2024-2032 (US$ Mn)
TABLE 277 China 3D Printing in Healthcare Market, by End-User, 2019-2023 (US$ Mn)
TABLE 278 China 3D Printing in Healthcare Market, by End-User, 2024-2032 (US$ Mn)
TABLE 279 China 3D Printing in Healthcare Market, by Material, 2019-2023 (US$ Mn)
TABLE 280 China 3D Printing in Healthcare Market, by Material, 2024-2032 (US$ Mn)
TABLE 281 China 3D Printing in Healthcare Market, by Process, By Region, 2019-2023 (US$ Mn)
TABLE 282 China 3D Printing in Healthcare Market, by Process, By Region, 2024-2032 (US$ Mn)
TABLE 283 China 3D Printing in Healthcare Market, by Type, 2019-2023 (US$ Mn)
TABLE 284 China 3D Printing in Healthcare Market, by Type, 2024-2032 (US$ Mn)
TABLE 285 China 3D Printing in Healthcare Market, by Application, 2019-2023 (US$ Mn)
TABLE 286 China 3D Printing in Healthcare Market, by Application, 2024-2032 (US$ Mn)
TABLE 287 China 3D Printing in Healthcare Market, by Regulatory Approval Status, 2019-2023 (US$ Mn)
TABLE 288 China 3D Printing in Healthcare Market, by Regulatory Approval Status, 2024-2032 (US$ Mn)
TABLE 289 Japan 3D Printing in Healthcare Market, by Technology, 2019-2023 (US$ Mn)
TABLE 290 Japan 3D Printing in Healthcare Market, by Technology, 2024-2032 (US$ Mn)
TABLE 291 Japan 3D Printing in Healthcare Market, by End-User, 2019-2023 (US$ Mn)
TABLE 292 Japan 3D Printing in Healthcare Market, by End-User, 2024-2032 (US$ Mn)
TABLE 293 Japan 3D Printing in Healthcare Market, by Material, 2019-2023 (US$ Mn)
TABLE 294 Japan 3D Printing in Healthcare Market, by Material, 2024-2032 (US$ Mn)
TABLE 295 Japan 3D Printing in Healthcare Market, by Process, By Region, 2019-2023 (US$ Mn)
TABLE 296 Japan 3D Printing in Healthcare Market, by Process, By Region, 2024-2032 (US$ Mn)
TABLE 297 Japan 3D Printing in Healthcare Market, by Type, 2019-2023 (US$ Mn)
TABLE 298 Japan 3D Printing in Healthcare Market, by Type, 2024-2032 (US$ Mn)
TABLE 299 Japan 3D Printing in Healthcare Market, by Application, 2019-2023 (US$ Mn)
TABLE 300 Japan 3D Printing in Healthcare Market, by Application, 2024-2032 (US$ Mn)
TABLE 301 Japan 3D Printing in Healthcare Market, by Regulatory Approval Status, 2019-2023 (US$ Mn)
TABLE 302 Japan 3D Printing in Healthcare Market, by Regulatory Approval Status, 2024-2032 (US$ Mn)
TABLE 303 India 3D Printing in Healthcare Market, by Technology, 2019-2023 (US$ Mn)
TABLE 304 India 3D Printing in Healthcare Market, by Technology, 2024-2032 (US$ Mn)
TABLE 305 India 3D Printing in Healthcare Market, by End-User, 2019-2023 (US$ Mn)
TABLE 306 India 3D Printing in Healthcare Market, by End-User, 2024-2032 (US$ Mn)
TABLE 307 India 3D Printing in Healthcare Market, by Material, 2019-2023 (US$ Mn)
TABLE 308 India 3D Printing in Healthcare Market, by Material, 2024-2032 (US$ Mn)
TABLE 309 India 3D Printing in Healthcare Market, by Process, By Region, 2019-2023 (US$ Mn)
TABLE 310 India 3D Printing in Healthcare Market, by Process, By Region, 2024-2032 (US$ Mn)
TABLE 311 India 3D Printing in Healthcare Market, by Type, 2019-2023 (US$ Mn)
TABLE 312 India 3D Printing in Healthcare Market, by Type, 2024-2032 (US$ Mn)
TABLE 313 India 3D Printing in Healthcare Market, by Application, 2019-2023 (US$ Mn)
TABLE 314 India 3D Printing in Healthcare Market, by Application, 2024-2032 (US$ Mn)
TABLE 315 India 3D Printing in Healthcare Market, by Regulatory Approval Status, 2019-2023 (US$ Mn)
TABLE 316 India 3D Printing in Healthcare Market, by Regulatory Approval Status, 2024-2032 (US$ Mn)
TABLE 317 South Korea 3D Printing in Healthcare Market, by Technology, 2019-2023 (US$ Mn)
TABLE 318 South Korea 3D Printing in Healthcare Market, by Technology, 2024-2032 (US$ Mn)
TABLE 319 South Korea 3D Printing in Healthcare Market, by End-User, 2019-2023 (US$ Mn)
TABLE 320 South Korea 3D Printing in Healthcare Market, by End-User, 2024-2032 (US$ Mn)
TABLE 321 South Korea 3D Printing in Healthcare Market, by Material, 2019-2023 (US$ Mn)
TABLE 322 South Korea 3D Printing in Healthcare Market, by Material, 2024-2032 (US$ Mn)
TABLE 323 South Korea 3D Printing in Healthcare Market, by Process, By Region, 2019-2023 (US$ Mn)
TABLE 324 South Korea 3D Printing in Healthcare Market, by Process, By Region, 2024-2032 (US$ Mn)
TABLE 325 South Korea 3D Printing in Healthcare Market, by Type, 2019-2023 (US$ Mn)
TABLE 326 South Korea 3D Printing in Healthcare Market, by Type, 2024-2032 (US$ Mn)
TABLE 327 South Korea 3D Printing in Healthcare Market, by Application, 2019-2023 (US$ Mn)
TABLE 328 South Korea 3D Printing in Healthcare Market, by Application, 2024-2032 (US$ Mn)
TABLE 329 South Korea 3D Printing in Healthcare Market, by Regulatory Approval Status, 2019-2023 (US$ Mn)
TABLE 330 South Korea 3D Printing in Healthcare Market, by Regulatory Approval Status, 2024-2032 (US$ Mn)
TABLE 331 South-East Asia 3D Printing in Healthcare Market, by Technology, 2019-2023 (US$ Mn)
TABLE 332 South-East Asia 3D Printing in Healthcare Market, by Technology, 2024-2032 (US$ Mn)
TABLE 333 South-East Asia 3D Printing in Healthcare Market, by End-User, 2019-2023 (US$ Mn)
TABLE 334 South-East Asia 3D Printing in Healthcare Market, by End-User, 2024-2032 (US$ Mn)
TABLE 335 South-East Asia 3D Printing in Healthcare Market, by Material, 2019-2023 (US$ Mn)
TABLE 336 South-East Asia 3D Printing in Healthcare Market, by Material, 2024-2032 (US$ Mn)
TABLE 337 South-East Asia 3D Printing in Healthcare Market, by Process, By Region, 2019-2023 (US$ Mn)
TABLE 338 South-East Asia 3D Printing in Healthcare Market, by Process, By Region, 2024-2032 (US$ Mn)
TABLE 339 South-East Asia 3D Printing in Healthcare Market, by Type, 2019-2023 (US$ Mn)
TABLE 340 South-East Asia 3D Printing in Healthcare Market, by Type, 2024-2032 (US$ Mn)
TABLE 341 South-East Asia 3D Printing in Healthcare Market, by Application, 2019-2023 (US$ Mn)
TABLE 342 South-East Asia 3D Printing in Healthcare Market, by Application, 2024-2032 (US$ Mn)
TABLE 343 South-East Asia 3D Printing in Healthcare Market, by Regulatory Approval Status, 2019-2023 (US$ Mn)
TABLE 344 South-East Asia 3D Printing in Healthcare Market, by Regulatory Approval Status, 2024-2032 (US$ Mn)
TABLE 345 Rest of Asia Pacific 3D Printing in Healthcare Market, by Technology, 2019-2023 (US$ Mn)
TABLE 346 Rest of Asia Pacific 3D Printing in Healthcare Market, by Technology, 2024-2032 (US$ Mn)
TABLE 347 Rest of Asia Pacific 3D Printing in Healthcare Market, by End-User, 2019-2023 (US$ Mn)
TABLE 348 Rest of Asia Pacific 3D Printing in Healthcare Market, by End-User, 2024-2032 (US$ Mn)
TABLE 349 Rest of Asia Pacific 3D Printing in Healthcare Market, by Material, 2019-2023 (US$ Mn)
TABLE 350 Rest of Asia Pacific 3D Printing in Healthcare Market, by Material, 2024-2032 (US$ Mn)
TABLE 351 Rest of Asia Pacific 3D Printing in Healthcare Market, by Process, By Region, 2019-2023 (US$ Mn)
TABLE 352 Rest of Asia Pacific 3D Printing in Healthcare Market, by Process, By Region, 2024-2032 (US$ Mn)
TABLE 353 Rest of Asia Pacific 3D Printing in Healthcare Market, by Type, 2019-2023 (US$ Mn)
TABLE 354 Rest of Asia Pacific 3D Printing in Healthcare Market, by Type, 2024-2032 (US$ Mn)
TABLE 355 Rest of Asia Pacific 3D Printing in Healthcare Market, by Application, 2019-2023 (US$ Mn)
TABLE 356 Rest of Asia Pacific 3D Printing in Healthcare Market, by Application, 2024-2032 (US$ Mn)
TABLE 357 Rest of Asia Pacific 3D Printing in Healthcare Market, by Regulatory Approval Status, 2019-2023 (US$ Mn)
TABLE 358 Rest of Asia Pacific 3D Printing in Healthcare Market, by Regulatory Approval Status, 2024-2032 (US$ Mn)
TABLE 359 Latin America 3D Printing in Healthcare Market, by Technology, 2019-2023 (US$ Mn)
TABLE 360 Latin America 3D Printing in Healthcare Market, by Technology, 2024-2032 (US$ Mn)
TABLE 361 Latin America 3D Printing in Healthcare Market, by End-User, 2019-2023 (US$ Mn)
TABLE 362 Latin America 3D Printing in Healthcare Market, by End-User, 2024-2032 (US$ Mn)
TABLE 363 Latin America 3D Printing in Healthcare Market, by Material, 2019-2023 (US$ Mn)
TABLE 364 Latin America 3D Printing in Healthcare Market, by Material, 2024-2032 (US$ Mn)
TABLE 365 Latin America 3D Printing in Healthcare Market, by Process, By Region, 2019-2023 (US$ Mn)
TABLE 366 Latin America 3D Printing in Healthcare Market, by Process, By Region, 2024-2032 (US$ Mn)
TABLE 367 Latin America 3D Printing in Healthcare Market, by Type, 2019-2023 (US$ Mn)
TABLE 368 Latin America 3D Printing in Healthcare Market, by Type, 2024-2032 (US$ Mn)
TABLE 369 Latin America 3D Printing in Healthcare Market, by Application, 2019-2023 (US$ Mn)
TABLE 370 Latin America 3D Printing in Healthcare Market, by Application, 2024-2032 (US$ Mn)
TABLE 371 Latin America 3D Printing in Healthcare Market, by Regulatory Approval Status, 2019-2023 (US$ Mn)
TABLE 372 Latin America 3D Printing in Healthcare Market, by Regulatory Approval Status, 2024-2032 (US$ Mn)
TABLE 373 Brazil 3D Printing in Healthcare Market, by Technology, 2019-2023 (US$ Mn)
TABLE 374 Brazil 3D Printing in Healthcare Market, by Technology, 2024-2032 (US$ Mn)
TABLE 375 Brazil 3D Printing in Healthcare Market, by End-User, 2019-2023 (US$ Mn)
TABLE 376 Brazil 3D Printing in Healthcare Market, by End-User, 2024-2032 (US$ Mn)
TABLE 377 Brazil 3D Printing in Healthcare Market, by Material, 2019-2023 (US$ Mn)
TABLE 378 Brazil 3D Printing in Healthcare Market, by Material, 2024-2032 (US$ Mn)
TABLE 379 Brazil 3D Printing in Healthcare Market, by Process, By Region, 2019-2023 (US$ Mn)
TABLE 380 Brazil 3D Printing in Healthcare Market, by Process, By Region, 2024-2032 (US$ Mn)
TABLE 381 Brazil 3D Printing in Healthcare Market, by Type, 2019-2023 (US$ Mn)
TABLE 382 Brazil 3D Printing in Healthcare Market, by Type, 2024-2032 (US$ Mn)
TABLE 383 Brazil 3D Printing in Healthcare Market, by Application, 2019-2023 (US$ Mn)
TABLE 384 Brazil 3D Printing in Healthcare Market, by Application, 2024-2032 (US$ Mn)
TABLE 385 Brazil 3D Printing in Healthcare Market, by Regulatory Approval Status, 2019-2023 (US$ Mn)
TABLE 386 Brazil 3D Printing in Healthcare Market, by Regulatory Approval Status, 2024-2032 (US$ Mn)
TABLE 387 Argentina 3D Printing in Healthcare Market, by Technology, 2019-2023 (US$ Mn)
TABLE 388 Argentina 3D Printing in Healthcare Market, by Technology, 2024-2032 (US$ Mn)
TABLE 389 Argentina 3D Printing in Healthcare Market, by End-User, 2019-2023 (US$ Mn)
TABLE 390 Argentina 3D Printing in Healthcare Market, by End-User, 2024-2032 (US$ Mn)
TABLE 391 Argentina 3D Printing in Healthcare Market, by Material, 2019-2023 (US$ Mn)
TABLE 392 Argentina 3D Printing in Healthcare Market, by Material, 2024-2032 (US$ Mn)
TABLE 393 Argentina 3D Printing in Healthcare Market, by Process, By Region, 2019-2023 (US$ Mn)
TABLE 394 Argentina 3D Printing in Healthcare Market, by Process, By Region, 2024-2032 (US$ Mn)
TABLE 395 Argentina 3D Printing in Healthcare Market, by Type, 2019-2023 (US$ Mn)
TABLE 396 Argentina 3D Printing in Healthcare Market, by Type, 2024-2032 (US$ Mn)
TABLE 397 Argentina 3D Printing in Healthcare Market, by Application, 2019-2023 (US$ Mn)
TABLE 398 Argentina 3D Printing in Healthcare Market, by Application, 2024-2032 (US$ Mn)
TABLE 399 Argentina 3D Printing in Healthcare Market, by Regulatory Approval Status, 2019-2023 (US$ Mn)
TABLE 400 Argentina 3D Printing in Healthcare Market, by Regulatory Approval Status, 2024-2032 (US$ Mn)
TABLE 401 Rest of Latin America 3D Printing in Healthcare Market, by Technology, 2019-2023 (US$ Mn)
TABLE 402 Rest of Latin America 3D Printing in Healthcare Market, by Technology, 2024-2032 (US$ Mn)
TABLE 403 Rest of Latin America 3D Printing in Healthcare Market, by End-User, 2019-2023 (US$ Mn)
TABLE 404 Rest of Latin America 3D Printing in Healthcare Market, by End-User, 2024-2032 (US$ Mn)
TABLE 405 Rest of Latin America 3D Printing in Healthcare Market, by Material, 2019-2023 (US$ Mn)
TABLE 406 Rest of Latin America 3D Printing in Healthcare Market, by Material, 2024-2032 (US$ Mn)
TABLE 407 Rest of Latin America 3D Printing in Healthcare Market, by Process, By Region, 2019-2023 (US$ Mn)
TABLE 408 Rest of Latin America 3D Printing in Healthcare Market, by Process, By Region, 2024-2032 (US$ Mn)
TABLE 409 Rest of Latin America 3D Printing in Healthcare Market, by Type, 2019-2023 (US$ Mn)
TABLE 410 Rest of Latin America 3D Printing in Healthcare Market, by Type, 2024-2032 (US$ Mn)
TABLE 411 Rest of Latin America 3D Printing in Healthcare Market, by Application, 2019-2023 (US$ Mn)
TABLE 412 Rest of Latin America 3D Printing in Healthcare Market, by Application, 2024-2032 (US$ Mn)
TABLE 413 Rest of Latin America 3D Printing in Healthcare Market, by Regulatory Approval Status, 2019-2023 (US$ Mn)
TABLE 414 Rest of Latin America 3D Printing in Healthcare Market, by Regulatory Approval Status, 2024-2032 (US$ Mn)
TABLE 415 Middle East 3D Printing in Healthcare Market, by Technology, 2019-2023 (US$ Mn)
TABLE 416 Middle East 3D Printing in Healthcare Market, by Technology, 2024-2032 (US$ Mn)
TABLE 417 Middle East 3D Printing in Healthcare Market, by End-User, 2019-2023 (US$ Mn)
TABLE 418 Middle East 3D Printing in Healthcare Market, by End-User, 2024-2032 (US$ Mn)
TABLE 419 Middle East 3D Printing in Healthcare Market, by Material, 2019-2023 (US$ Mn)
TABLE 420 Middle East 3D Printing in Healthcare Market, by Material, 2024-2032 (US$ Mn)
TABLE 421 Middle East 3D Printing in Healthcare Market, by Process, By Region, 2019-2023 (US$ Mn)
TABLE 422 Middle East 3D Printing in Healthcare Market, by Process, By Region, 2024-2032 (US$ Mn)
TABLE 423 Middle East 3D Printing in Healthcare Market, by Type, 2019-2023 (US$ Mn)
TABLE 424 Middle East 3D Printing in Healthcare Market, by Type, 2024-2032 (US$ Mn)
TABLE 425 Middle East 3D Printing in Healthcare Market, by Application, 2019-2023 (US$ Mn)
TABLE 426 Middle East 3D Printing in Healthcare Market, by Application, 2024-2032 (US$ Mn)
TABLE 427 Middle East 3D Printing in Healthcare Market, by Regulatory Approval Status, 2019-2023 (US$ Mn)
TABLE 428 Middle East 3D Printing in Healthcare Market, by Regulatory Approval Status, 2024-2032 (US$ Mn)
TABLE 429 UAE 3D Printing in Healthcare Market, by Technology, 2019-2023 (US$ Mn)
TABLE 430 UAE 3D Printing in Healthcare Market, by Technology, 2024-2032 (US$ Mn)
TABLE 431 UAE 3D Printing in Healthcare Market, by End-User, 2019-2023 (US$ Mn)
TABLE 432 UAE 3D Printing in Healthcare Market, by End-User, 2024-2032 (US$ Mn)
TABLE 433 UAE 3D Printing in Healthcare Market, by Material, 2019-2023 (US$ Mn)
TABLE 434 UAE 3D Printing in Healthcare Market, by Material, 2024-2032 (US$ Mn)
TABLE 435 UAE 3D Printing in Healthcare Market, by Process, By Region, 2019-2023 (US$ Mn)
TABLE 436 UAE 3D Printing in Healthcare Market, by Process, By Region, 2024-2032 (US$ Mn)
TABLE 437 UAE 3D Printing in Healthcare Market, by Type, 2019-2023 (US$ Mn)
TABLE 438 UAE 3D Printing in Healthcare Market, by Type, 2024-2032 (US$ Mn)
TABLE 439 UAE 3D Printing in Healthcare Market, by Application, 2019-2023 (US$ Mn)
TABLE 440 UAE 3D Printing in Healthcare Market, by Application, 2024-2032 (US$ Mn)
TABLE 441 UAE 3D Printing in Healthcare Market, by Regulatory Approval Status, 2019-2023 (US$ Mn)
TABLE 442 UAE 3D Printing in Healthcare Market, by Regulatory Approval Status, 2024-2032 (US$ Mn)
TABLE 443 Saudi Arabia 3D Printing in Healthcare Market, by Technology, 2019-2023 (US$ Mn)
TABLE 444 Saudi Arabia 3D Printing in Healthcare Market, by Technology, 2024-2032 (US$ Mn)
TABLE 445 Saudi Arabia 3D Printing in Healthcare Market, by End-User, 2019-2023 (US$ Mn)
TABLE 446 Saudi Arabia 3D Printing in Healthcare Market, by End-User, 2024-2032 (US$ Mn)
TABLE 447 Saudi Arabia 3D Printing in Healthcare Market, by Material, 2019-2023 (US$ Mn)
TABLE 448 Saudi Arabia 3D Printing in Healthcare Market, by Material, 2024-2032 (US$ Mn)
TABLE 449 Saudi Arabia 3D Printing in Healthcare Market, by Process, By Region, 2019-2023 (US$ Mn)
TABLE 450 Saudi Arabia 3D Printing in Healthcare Market, by Process, By Region, 2024-2032 (US$ Mn)
TABLE 451 Saudi Arabia 3D Printing in Healthcare Market, by Type, 2019-2023 (US$ Mn)
TABLE 452 Saudi Arabia 3D Printing in Healthcare Market, by Type, 2024-2032 (US$ Mn)
TABLE 453 Saudi Arabia 3D Printing in Healthcare Market, by Application, 2019-2023 (US$ Mn)
TABLE 454 Saudi Arabia 3D Printing in Healthcare Market, by Application, 2024-2032 (US$ Mn)
TABLE 455 Saudi Arabia 3D Printing in Healthcare Market, by Regulatory Approval Status, 2019-2023 (US$ Mn)
TABLE 456 Saudi Arabia 3D Printing in Healthcare Market, by Regulatory Approval Status, 2024-2032 (US$ Mn)
TABLE 457 Rest of Middle East 3D Printing in Healthcare Market, by Technology, 2019-2023 (US$ Mn)
TABLE 458 Rest of Middle East 3D Printing in Healthcare Market, by Technology, 2024-2032 (US$ Mn)
TABLE 459 Rest of Middle East 3D Printing in Healthcare Market, by End-User, 2019-2023 (US$ Mn)
TABLE 460 Rest of Middle East 3D Printing in Healthcare Market, by End-User, 2024-2032 (US$ Mn)
TABLE 461 Rest of Middle East 3D Printing in Healthcare Market, by Material, 2019-2023 (US$ Mn)
TABLE 462 Rest of Middle East 3D Printing in Healthcare Market, by Material, 2024-2032 (US$ Mn)
TABLE 463 Rest of Middle East 3D Printing in Healthcare Market, by Process, By Region, 2019-2023 (US$ Mn)
TABLE 464 Rest of Middle East 3D Printing in Healthcare Market, by Process, By Region, 2024-2032 (US$ Mn)
TABLE 465 Rest of Middle East 3D Printing in Healthcare Market, by Type, 2019-2023 (US$ Mn)
TABLE 466 Rest of Middle East 3D Printing in Healthcare Market, by Type, 2024-2032 (US$ Mn)
TABLE 467 Rest of Middle East 3D Printing in Healthcare Market, by Application, 2019-2023 (US$ Mn)
TABLE 468 Rest of Middle East 3D Printing in Healthcare Market, by Application, 2024-2032 (US$ Mn)
TABLE 469 Rest of Middle East 3D Printing in Healthcare Market, by Regulatory Approval Status, 2019-2023 (US$ Mn)
TABLE 470 Rest of Middle East 3D Printing in Healthcare Market, by Regulatory Approval Status, 2024-2032 (US$ Mn)
TABLE 471 Africa 3D Printing in Healthcare Market, by Technology, 2019-2023 (US$ Mn)
TABLE 472 Africa 3D Printing in Healthcare Market, by Technology, 2024-2032 (US$ Mn)
TABLE 473 Africa 3D Printing in Healthcare Market, by End-User, 2019-2023 (US$ Mn)
TABLE 474 Africa 3D Printing in Healthcare Market, by End-User, 2024-2032 (US$ Mn)
TABLE 475 Africa 3D Printing in Healthcare Market, by Material, 2019-2023 (US$ Mn)
TABLE 476 Africa 3D Printing in Healthcare Market, by Material, 2024-2032 (US$ Mn)
TABLE 477 Africa 3D Printing in Healthcare Market, by Process, By Region, 2019-2023 (US$ Mn)
TABLE 478 Africa 3D Printing in Healthcare Market, by Process, By Region, 2024-2032 (US$ Mn)
TABLE 479 Africa 3D Printing in Healthcare Market, by Type, 2019-2023 (US$ Mn)
TABLE 480 Africa 3D Printing in Healthcare Market, by Type, 2024-2032 (US$ Mn)
TABLE 481 Africa 3D Printing in Healthcare Market, by Application, 2019-2023 (US$ Mn)
TABLE 482 Africa 3D Printing in Healthcare Market, by Application, 2024-2032 (US$ Mn)
TABLE 483 Africa 3D Printing in Healthcare Market, by Regulatory Approval Status, 2019-2023 (US$ Mn)
TABLE 484 Africa 3D Printing in Healthcare Market, by Regulatory Approval Status, 2024-2032 (US$ Mn)
TABLE 485 South Africa 3D Printing in Healthcare Market, by Technology, 2019-2023 (US$ Mn)
TABLE 486 South Africa 3D Printing in Healthcare Market, by Technology, 2024-2032 (US$ Mn)
TABLE 487 South Africa 3D Printing in Healthcare Market, by End-User, 2019-2023 (US$ Mn)
TABLE 488 South Africa 3D Printing in Healthcare Market, by End-User, 2024-2032 (US$ Mn)
TABLE 489 South Africa 3D Printing in Healthcare Market, by Material, 2019-2023 (US$ Mn)
TABLE 490 South Africa 3D Printing in Healthcare Market, by Material, 2024-2032 (US$ Mn)
TABLE 491 South Africa 3D Printing in Healthcare Market, by Process, By Region, 2019-2023 (US$ Mn)
TABLE 492 South Africa 3D Printing in Healthcare Market, by Process, By Region, 2024-2032 (US$ Mn)
TABLE 493 South Africa 3D Printing in Healthcare Market, by Type, 2019-2023 (US$ Mn)
TABLE 494 South Africa 3D Printing in Healthcare Market, by Type, 2024-2032 (US$ Mn)
TABLE 495 South Africa 3D Printing in Healthcare Market, by Application, 2019-2023 (US$ Mn)
TABLE 496 South Africa 3D Printing in Healthcare Market, by Application, 2024-2032 (US$ Mn)
TABLE 497 South Africa 3D Printing in Healthcare Market, by Regulatory Approval Status, 2019-2023 (US$ Mn)
TABLE 498 South Africa 3D Printing in Healthcare Market, by Regulatory Approval Status, 2024-2032 (US$ Mn)
TABLE 499 Egypt 3D Printing in Healthcare Market, by Technology, 2019-2023 (US$ Mn)
TABLE 500 Egypt 3D Printing in Healthcare Market, by Technology, 2024-2032 (US$ Mn)
TABLE 501 Egypt 3D Printing in Healthcare Market, by End-User, 2019-2023 (US$ Mn)
TABLE 502 Egypt 3D Printing in Healthcare Market, by End-User, 2024-2032 (US$ Mn)
TABLE 503 Egypt 3D Printing in Healthcare Market, by Material, 2019-2023 (US$ Mn)
TABLE 504 Egypt 3D Printing in Healthcare Market, by Material, 2024-2032 (US$ Mn)
TABLE 505 Egypt 3D Printing in Healthcare Market, by Process, By Region, 2019-2023 (US$ Mn)
TABLE 506 Egypt 3D Printing in Healthcare Market, by Process, By Region, 2024-2032 (US$ Mn)
TABLE 507 Egypt 3D Printing in Healthcare Market, by Type, 2019-2023 (US$ Mn)
TABLE 508 Egypt 3D Printing in Healthcare Market, by Type, 2024-2032 (US$ Mn)
TABLE 509 Egypt 3D Printing in Healthcare Market, by Application, 2019-2023 (US$ Mn)
TABLE 510 Egypt 3D Printing in Healthcare Market, by Application, 2024-2032 (US$ Mn)
TABLE 511 Egypt 3D Printing in Healthcare Market, by Regulatory Approval Status, 2019-2023 (US$ Mn)
TABLE 512 Egypt 3D Printing in Healthcare Market, by Regulatory Approval Status, 2024-2032 (US$ Mn)
TABLE 513 Rest of Africa 3D Printing in Healthcare Market, by Technology, 2019-2023 (US$ Mn)
TABLE 514 Rest of Africa 3D Printing in Healthcare Market, by Technology, 2024-2032 (US$ Mn)
TABLE 515 Rest of Africa 3D Printing in Healthcare Market, by End-User, 2019-2023 (US$ Mn)
TABLE 516 Rest of Africa 3D Printing in Healthcare Market, by End-User, 2024-2032 (US$ Mn)
TABLE 517 Rest of Africa 3D Printing in Healthcare Market, by Material, 2019-2023 (US$ Mn)
TABLE 518 Rest of Africa 3D Printing in Healthcare Market, by Material, 2024-2032 (US$ Mn)
TABLE 519 Rest of Africa 3D Printing in Healthcare Market, by Process, By Region, 2019-2023 (US$ Mn)
TABLE 520 Rest of Africa 3D Printing in Healthcare Market, by Process, By Region, 2024-2032 (US$ Mn)
TABLE 521 Rest of Africa 3D Printing in Healthcare Market, by Type, 2019-2023 (US$ Mn)
TABLE 522 Rest of Africa 3D Printing in Healthcare Market, by Type, 2024-2032 (US$ Mn)
TABLE 523 Rest of Africa 3D Printing in Healthcare Market, by Application, 2019-2023 (US$ Mn)
TABLE 524 Rest of Africa 3D Printing in Healthcare Market, by Application, 2024-2032 (US$ Mn)
TABLE 525 Rest of Africa 3D Printing in Healthcare Market, by Regulatory Approval Status, 2019-2023 (US$ Mn)
TABLE 526 Rest of Africa 3D Printing in Healthcare Market, by Regulatory Approval Status, 2024-2032 (US$ Mn)

Frequently Asked Questions

What is the current size of 3D printing in the healthcare market?

The 3D printing in healthcare market was valued at USD 1.2 Million in 2023.

What is the expected growth rate of 3D printing in the healthcare market between 2024 and 2032?

The 3D printing in the healthcare market is expected to grow at a CAGR of 20.5% between 2024 and 2032, reaching USD 6.43 Million in 2032.

Which category is leading the market share in terms of technology?

Stereolithography (SLA) is the leading segment by technology, holding over 20% share in value in 2023.

Which application category governs the market demand for 3D printing in healthcare?

The orthopedic implants segment governs the demand for 3D printing in healthcare globally, holding a market share of over 22% in 2023.

Which material segment is expected to post the largest CAGR?

The biomaterials category is likely to post the fastest CAGR.

Which region is fueling the growth of 3D printing in the healthcare industry?

As of 2023, North America accounted for more than one-third of the global market share for 3D printing in the healthcare sector.

Who are the major players in 3D printing in the healthcare market?

The top players include Organovo Holdings Inc., Stratasys Ltd, The ExOne Company, General Electric (GE Additive), 3D Systems Corporation, Oxford Performance Materials Inc., Formlabs Inc., SLM Solutions Group AG, Materialise NV, Protolabs Inc., and Others.

What are the major market drivers of 3D printing in the healthcare industry?

The major market drivers of 3D printing in the healthcare industry are the growing demand for personalized medical devices and implants, advancements in additive manufacturing technology enabling complex anatomical structures, and the need for cost-effective and efficient solutions for patient-specific treatment.

What are the major market restraints of 3D printing in the healthcare industry?

A limited number of materials can be utilized in 3D printing, and the introduction of new materials for 3D printing necessitates considerable R&D operations as well as a significant expenditure, all of which can limit market growth to some extent.

What are the major market opportunities of 3D printing in the healthcare industry?

The concept of using a person’s cells to 3D print new organs to reduce rejection rates similar to those found in organ transplants, as well as a focus on advancing 3D printing process consistency and in-situ quality control, particularly for unique applications, are anticipated to continue to open up lucrative market opportunities for key players and new entrants in the global market.

Orthopedic Oncology Treatment Market

Published:
Report ID: 8246

Audiology Devices Market

Published:
Report ID: 2640

Cardiac Rehabilitation Devices Market

Published:
Report ID: 35105

IV Tubing Sets and Accessories Market

Published:
Report ID: 35095

Infectious Disease Diagnostic Market

Published:
Report ID: 35089

Elastomeric Infusion Pumps Market

Published:
Report ID: 4996

Emergency Hospital Bed Market

Published:
Report ID: 35082

Elder Care Product Market

Published:
Report ID: 35079

Wound Care Market

Published:
Report ID: 6983

Companion Diagnostics Market

Published:
Report ID: 3964

Apheresis Equipment Market

Published:
Report ID: 1592

Antibacterial Drugs Market

Published:
Report ID: 1424

Purchase Options

$2999
Delivery Format: Excel.
$4999
Designed for the individual purchaser.
$6999
Users located at a single corporate site or regional office.
$7999
Allowed for unlimited sharing globally within one company.
Smallform of Sample request

Have a question?

User Profile

Don’t settle for less – trust Mitul to help you find the best solution.

Report delivery within 24 to 48 hours

– Other Info –

What people say?-

User Review

I am very impressed with the information in this report. The author clearly did their research when they came up with this product and it has already given me a lot of ideas.

Jana Schmidt
CEDAR CX Technologies

– Connect with us –

Phone

+91 6232 49 3207


support

24/7 Research Support


sales@credenceresearch.com

– Research Methodology –

Going beyond the basics: advanced techniques in research methodology

– Trusted By –

Pepshi, LG, Nestle
Motorola, Honeywell, Johnson and johnson
LG Chem, SIEMENS, Pfizer
Unilever, Samsonite, QIAGEN