
Agricultural Colorants Market Overview:
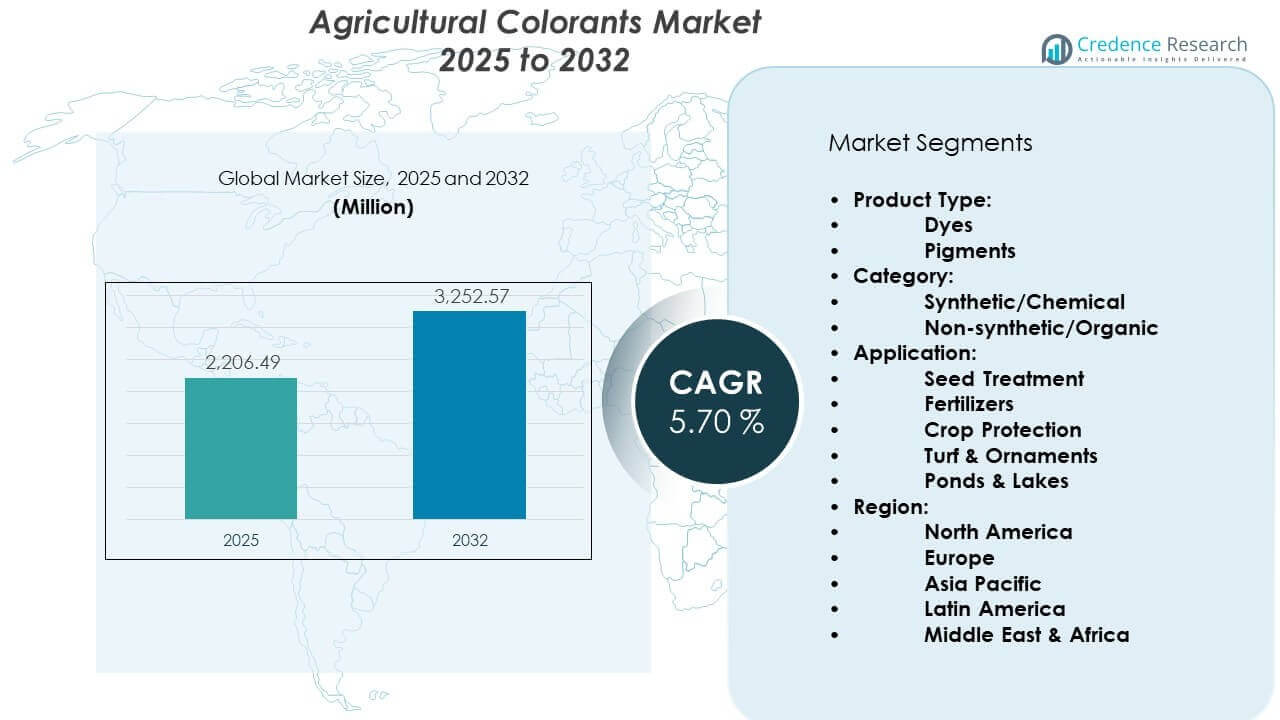
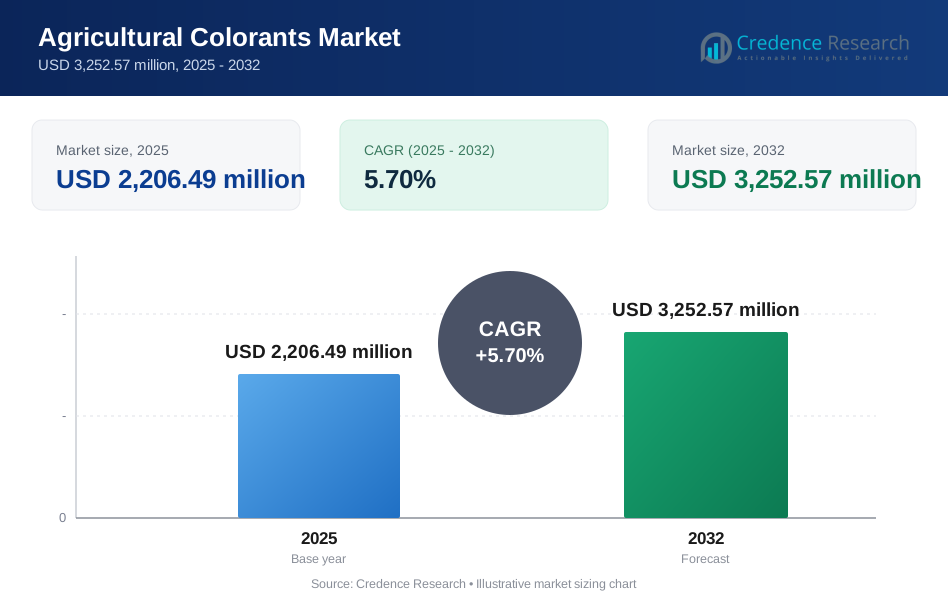
The Agricultural Colorants Market is projected to grow from USD 2,206.49 million in 2025 to an estimated USD 3,252.57 million by 2032, with a compound annual growth rate (CAGR) of 5.70% from 2025 to 2032.
| REPORT ATTRIBUTE | DETAILS |
|---|---|
| Historical Period | 2020-2024 |
| Base Year | 2025 |
| Forecast Period | 2026-2032 |
| Agricultural Colorants Market Size 2025 | USD 2,206.49 million |
| Agricultural Colorants Market, CAGR | 5.70% |
| Agricultural Colorants Market Size 2032 | USD 3,252.57 million |
Agricultural Colorants Market Insights:
- North America (34%), Europe (26%), and Asia Pacific (22%) lead the market due to advanced input practices, strong sustainability policies, and expanding agricultural infrastructure respectively.
- Asia Pacific is the fastest-growing region with 22% share, driven by rising seed treatment demand, government modernization programs, and growing export-oriented horticulture.
- Seed treatment accounted for the largest share at over 30%, supported by widespread application in hybrid and certified seeds across commercial farming.
- Synthetic/Chemical colorants held a dominant share of over 60%, due to their consistent performance and compatibility across diverse carrier formulations.
Agricultural Colorants Market Drivers:
Increasing Demand for Enhanced Product Visibility and Safety Across Agricultural Inputs
Colorants improve visibility of seeds, fertilizers, and pesticides, reducing the risk of over-application or uneven distribution. Farmers gain better control during application and can easily identify treated zones. Color-coded inputs help prevent cross-contamination and ensure safety in large-scale operations. The Agricultural Colorants Market benefits from strong uptake among commercial farms and agri-tech integrators. It supports efficient field management, especially in high-value crop zones. Product visibility also aids during audits and quality inspections. Many manufacturers focus on custom color blends to match product lines and customer preferences. This trend strengthens overall demand across developed and emerging economies.
- For instance, BASF SE developed the Color Coat™ line for seed treatment, which provides uniform coverage and intense color to ensure treated seeds are easily identifiable, enhancing visual verification and helping operators maintain consistent seed flow during planting.
Growing Preference for Eco-Friendly and Biodegradable Formulations in Modern Farming
Demand for sustainable farming inputs drives the shift toward non-toxic and biodegradable colorants. Governments and certification bodies are pushing for low-impact additives across seed coatings and pesticide carriers. The Agricultural Colorants Market responds to these regulatory changes with water-based and natural pigment options. It supports alignment with global sustainability goals and organic farming standards. Producers increasingly reformulate offerings to comply with environmental safety norms. Biodegradable colorants reduce soil and water contamination risks. Buyers view them as essential for long-term ecosystem protection. Eco-labeling further promotes their use among environmentally conscious growers.
- For instance, Clariant AG launched the VITA range of surfactants, which are formulated with 100% bio-based carbon from renewable feedstocks and can be paired with their organic pigment range conforming to EN 13432 standards to ensure environmental safety for compostable and soil-related applications.
Rapid Adoption of Seed Treatment Practices in Commercial and Protected Farming Systems
Colorants play a vital role in treated seeds by differentiating chemical treatments and boosting visual appeal. Their integration with seed coatings helps indicate treatment type and dosage level. The Agricultural Colorants Market expands steadily in response to growing seed certification and traceability norms. It aligns with evolving practices in hybrid seed development and genetic trait management. Color-coded seeds streamline planting operations and reduce application confusion. Many large farms invest in automated sowing systems, where color helps system calibration. Treated seed demand continues to rise in greenhouse and vertical farming. Colorant use supports safe and traceable operations in these high-efficiency environments.
Expansion of Turf and Ornamental Applications Across Public and Commercial Landscapes
Colorants are widely adopted in turf management to enhance aesthetic appeal and mask discoloration caused by drought or chemical stress. Sports fields, golf courses, and public lawns demand visually uniform and healthy-looking grass. The Agricultural Colorants Market sees growth from landscaping firms and municipal maintenance agencies. It supports surface restoration without full replanting or intensive watering. Non-staining, UV-stable colorants extend coverage over a wider area. Contractors prefer ready-to-spray liquid formats that save time during application. Turf dyes help manage seasonal appearance gaps while promoting long-term grass health. Use in decorative plant care also strengthens the market’s reach.
Agricultural Colorants Market Trends:
Integration of Colorants with Smart Agriculture and Precision Application Technologies
Smart farming tools increasingly adopt color-coded inputs for better tracking, detection, and calibration. Drones, sprayers, and autonomous vehicles use colorants for precise field coverage verification. The Agricultural Colorants Market adapts well to digital monitoring platforms and sensor-aided spraying. Color helps validate uniformity and efficiency of crop input applications. Manufacturers align with tech developers to offer compatible formulations. These integrations enhance value for large farms using advanced crop analytics. Field trial programs test colorant effectiveness in precision workflows. Market leaders invest in R&D to develop UV-detectable and near-infrared sensitive variants.
- For instance, Milliken & Company’s Liquitint Agro technology is engineered for compatibility with modern agricultural systems by allowing for easy automation and integration into existing process control systems. The technology utilizes stable polymeric colorants that provide better application indication, ensuring maximum coverage and a uniform, non-migrating coating for fertilizer surfaces.
Use of Agricultural Colorants in Aesthetic Crop Enhancement for Niche Markets
Visual quality matters in decorative crops, floriculture, and specialty fruits sold in export or premium channels. Colorants help maintain visual appeal by masking minor blemishes or discoloration. The Agricultural Colorants Market gains from rising demand in ornamental farming and bouquet production. Flower dyeing practices are also growing across commercial farms and retail florists. Specialty coatings add gloss or pigmentation to enhance consumer perception. These products meet niche retail and marketing goals for visual branding. Farm clusters in Latin America and Southeast Asia show strong uptake for floriculture applications. Aesthetic-focused formulations are becoming a key product differentiator.
- For instance, Sensient Industrial Colors provides high-performance colorants, such as the SensiCoat™ line for seed coatings and SensiPro™ for turf and spray indicators, which deliver superior color intensity and stability for various agricultural applications.
Growing Customization Demand Across Color Shades and Carrier Compatibility
Buyers now demand custom color shades to match product branding or crop types. Manufacturers respond by expanding color libraries and offering on-demand blending options. The Agricultural Colorants Market sees greater product diversification, especially in seed and fertilizer coatings. Custom colors help indicate different crop treatments or seed varieties. Compatibility with various carrier systems like water, oil, or polymer bases remains essential. Buyers want seamless mixing and stability across broad pH and temperature ranges. R&D teams focus on non-clogging, fade-resistant pigments. Color customization also supports traceability in bulk shipments.
Wider Application in Biological Products and Organic Farming Inputs
Biological crop protection products now incorporate colorants to improve visibility and reduce accidental misuse. Colorant use in biofertilizers and microbial treatments enhances label compliance and quality control. The Agricultural Colorants Market aligns with the rising share of organic-certified agricultural products. It supports grower confidence and proper input identification in blended formulations. Many organic farms use plant-derived or mineral-based colorants for safe labeling. Products maintain activity without affecting microbial viability. Compatibility with organic regulations opens new sales opportunities. This trend supports dual positioning in conventional and sustainable farming segments.
Agricultural Colorants Market Challenges Analysis:
Complex Regulatory Landscape Related to Ingredient Safety and Environmental Impact
Agricultural colorants face tight regulation due to concerns about toxicity, leaching, and residual presence. Many countries apply strict controls over synthetic pigments and additives in seed or soil inputs. The Agricultural Colorants Market must comply with varying national laws on permissible ingredients. Labeling standards, environmental risk scores, and biodegradability guidelines add complexity. Regulatory changes often require reformulation and retesting. Smaller manufacturers may struggle to maintain compliance across global markets. Continuous documentation and safety validation increase operational costs. Risk of bans on certain synthetic dyes remains a concern for some product lines.
Low Awareness and Adoption in Smallholder and Traditional Farming Communities
Colorant usage remains low among small farms that rely on traditional input handling. Many growers lack awareness about the benefits of color-coded agrochemicals or seeds. The Agricultural Colorants Market expands slower in regions with limited access to mechanized equipment. Farmers often prioritize cost savings over visual or safety features. Education gaps and limited extension services reduce demand visibility. Distributors may not promote colorant-based products actively in rural areas. Without clear incentives or demonstrations, adoption remains weak. Seasonal income instability further limits spending on value-added inputs.
Agricultural Colorants Market Opportunities:
Rising Adoption of Visual Differentiation Tools in Export-Oriented Agriculture
Exporters demand high-quality and clearly labeled farm inputs to meet international compliance norms. Colorants help support visual identification of treated produce, fertilizers, and crop protection agents. The Agricultural Colorants Market benefits from value chain participants who prioritize traceability and safety. It can tap into growing export clusters in Asia-Pacific, Latin America, and Africa. Custom shades and durable pigments offer added value to quality-sensitive shipments. Government schemes promoting traceable farming also expand opportunity scopes.
Innovation in Microencapsulation and Controlled Release Formats Using Colorants
Microencapsulation and slow-release formulations use colorants to indicate activity stage or dosage level. These visual indicators support smart release systems and help reduce misuse. The Agricultural Colorants Market aligns with trends in precision dosing and input efficiency. Encapsulated biologicals, nutrients, or active ingredients often pair with stable pigments. This opportunity expands as formulators seek multi-functional inputs for targeted delivery and monitoring.
Agricultural Colorants Market Segmentation Analysis:
By Product Type
Dyes and pigments form the core product types within the Agricultural Colorants Market. Dyes support uniform dispersion and clear visibility in liquid formulations such as sprays and coatings. Pigments provide stronger color stability and resistance to light exposure. It supports long-term field identification under harsh outdoor conditions. Pigments gain preference in turf and ornamental uses where durability matters. Dyes see wider use in short-cycle applications that require quick visual feedback. Product choice depends on formulation type and exposure duration.
- For instance, Sun Chemical’s "Sunfast®" pigments such as Phthalocyanine Green 7 are utilized in turf management for their exceptional lightfastness and chemical resistance, ensuring color stability and "rub-off" resistance even under intense UV exposure.
By Category
Synthetic or chemical colorants dominate due to cost efficiency and consistent performance. These products offer high color strength and compatibility with multiple carriers. The Agricultural Colorants Market also sees rising demand for non-synthetic or organic variants. It aligns with sustainability goals and organic farming standards. Organic colorants suit seed treatment and biological formulations. Regulatory pressure encourages gradual adoption of safer alternatives. Both categories coexist based on crop type and regional regulations.
- For instance, Chromatech Incorporated offers the Chromatint® range, which includes water-soluble liquid dyes and pigment dispersions such as Chromatint® Blue AZ 50% Liquid specifically designed to provide consistent color stability and ease of manufacturing for both granular and water-soluble fertilizers.
By Application
Seed treatment represents a major application, where colorants ensure clear identification and safe handling. Fertilizer applications rely on colorants to support even spread and reduce misuse. Crop protection products use colorants to improve spray accuracy and field traceability. Turf and ornament applications focus on visual enhancement and surface restoration. Ponds and lakes adopt colorants for algae control and aesthetic water management. Each application supports specific functional and safety needs across farming systems.
Segmentation:
By Product Type:
- Dyes
- Pigments
By Category:
- Synthetic/Chemical
- Non-synthetic/Organic
By Application:
- Seed Treatment
- Fertilizers
- Crop Protection
- Turf & Ornaments
- Ponds & Lakes
By Region:
- North America
- U.S.
- Canada
- Mexico
- Europe
- Germany
- France
- U.K.
- Italy
- Spain
- Rest of Europe
- Asia Pacific
- China
- Japan
- India
- South Korea
- South-east Asia
- Rest of Asia Pacific
- Latin America
- Brazil
- Argentina
- Rest of Latin America
- Middle East & Africa
- GCC Countries
- South Africa
- Rest of the Middle East and Africa
Regional Analysis:
North America Holds a Significant Share Due to Advanced Input Practices and Regulatory Support
North America leads the Agricultural Colorants Market with a market share of approximately 34%. The U.S. contributes the most, supported by large-scale seed treatment, fertilizer coating, and turf management operations. Strong regulatory frameworks encourage the use of safe and traceable agricultural inputs. It also benefits from a well-established commercial farming structure that integrates high-precision equipment. Widespread adoption of color-coded pesticides and biofertilizers drives volume demand. Canada adds to regional strength through turf and ornamental usage in residential and municipal spaces. Innovation from regional players and tech partnerships strengthens market leadership.
Europe Maintains Steady Growth Backed by Sustainability Initiatives and Eco-Friendly Inputs
Europe captures around 26% of the Agricultural Colorants Market, with countries like Germany, France, and the Netherlands taking the lead. The region emphasizes low-impact farming and places high importance on visual traceability. It supports demand for biodegradable and plant-based colorants, especially in organic-certified operations. Stringent EU directives encourage transparency in agricultural input application. Turf management across public infrastructure and sports venues creates a stable non-crop demand base. European producers continue to develop dye solutions aligned with eco-label standards. This alignment with sustainability ensures consistent market penetration.
Asia Pacific Emerges as the Fastest Growing Region with Expanding Crop Area and Input Usage
Asia Pacific holds a market share of around 22% and represents the fastest-growing region due to rapid agricultural expansion in China, India, and Southeast Asia. Rising seed treatment practices, supported by government-led modernization programs, boost demand. The Agricultural Colorants Market benefits from increasing awareness of visual identification among small and mid-sized farms. Growth in export-focused horticulture and aquaculture drives need for color-coded solutions. Regional investments in water-based and affordable colorants enhance accessibility. Urban landscaping trends and decorative crop care expand usage beyond conventional agriculture. Expanding agri-tech startups further accelerate regional uptake.
Key Player Analysis:
- BASF SE
- Clariant
- Sensient Technologies Corporation
- Sun Chemical
- Chromatech Incorporated
Competitive Analysis:
The Agricultural Colorants Market is moderately consolidated, with key players competing on innovation, formulation quality, and regional presence. Companies such as BASF SE, Clariant, Sensient Technologies Corporation, and Sun Chemical focus on offering eco-friendly, high-performance products. It experiences intense competition in seed treatment and turf applications, where color stability and ease of application are critical. Vendors invest in R&D to develop biodegradable and water-compatible colorants. Strategic collaborations with agri-input firms and tech-based integrators enhance their market position. Smaller regional players cater to niche needs with custom blends. Distribution networks and compliance with regulatory norms further define competitiveness. Innovation and sustainability remain top priorities.
Recent Developments:
- In March 2025, BASF SE introduced an enhanced range of biodegradable agricultural colorants designed for seed treatment and fertilizer coatings. The launch focused on improved color stability and compatibility with water-based formulations. BASF aligned the product line with stricter environmental and safety standards. This move strengthened its position in sustainable agricultural inputs.
- In November 2025, Sensient Technologies Corporation announced a strategic partnership with a global seed treatment provider to co-develop customized colorant solutions. The collaboration focused on color precision and formulation stability. Sensient leveraged its formulation expertise to address region-specific farming needs. This partnership enhanced its reach within the Agricultural Colorants Market.
Report Coverage:
The research report offers an in-depth analysis based on Product Type, Category, Application, and Region. It details leading market players, providing an overview of their business, product offerings, investments, revenue streams, and key applications. Additionally, the report includes insights into the competitive environment, SWOT analysis, current market trends, as well as the primary drivers and constraints. Furthermore, it discusses various factors that have driven market expansion in recent years. The report also explores market dynamics, regulatory scenarios, and technological advancements that are shaping the industry. It assesses the impact of external factors and global economic changes on market growth. Lastly, it provides strategic recommendations for new entrants and established companies to navigate the complexities of the market.
Future Outlook:
- Seed treatment colorants will gain traction across commercial farms due to increased demand for safe handling and visual distinction of treated seeds.
- Turf and ornamental applications will support long-term stability as municipalities and golf courses prioritize aesthetics with eco-safe formulations.
- Non-toxic, water-soluble, and biodegradable colorants will dominate product innovation, especially under tighter environmental regulations in Europe and North America.
- The rise of biological and organic crop inputs will create new demand for colorants that can blend safely with microbial and natural-based formulations.
- Asia Pacific will emerge as the highest-growth region driven by government-led modernization, input subsidies, and expanding horticulture exports.
- Precision agriculture platforms will increasingly use color-coded inputs for real-time tracking, automated spraying, and application verification.
- Custom shade formulations and branding integration will expand among input manufacturers seeking stronger differentiation and traceability.
- Integration with microencapsulation and controlled-release systems will promote use in advanced nutrient and pesticide technologies.
- Adoption will increase in aquaculture and pond management sectors, where colorants support algae control and enhance water visibility.
- Regulatory incentives and sustainable farming certifications will push both global players and local producers to adopt cleaner colorant technologies.
Request a Free Sample
Fill in your details and we'll send you a free sample report.
- Sample data tables & charts
- Research methodology
Need a Custom Version of This Report?
Tailor the scope, geography, or segments to your exact requirements.
- Custom geography or segment scope
- Direct access to our analyst team
Frequently Asked Questions
What is the current market size for Agricultural Colorants Market, and what is its projected size in 2032?
At what Compound Annual Growth Rate is the Agricultural Colorants Market projected to grow between 2025 and 2032?
Which Agricultural Colorants Market segment held the largest share in 2025?
What are the primary factors fueling the growth of the Agricultural Colorants Market?
Who are the leading companies in the Agricultural Colorants Market?
Which region commanded the largest share of the Agricultural Colorants Market in 2025?
Table of Content
Chapter 1. Report Introduction
- 1.1 Report Description & Purpose
- 1.1.1 Report Title & Market Definition
- 1.1.2 Unique Selling Propositions (USP) & Key Differentiators
- 1.1.3 Value Proposition for Stakeholders
- 1.2 Research Objectives
- 1.2.1 Market Sizing Objectives (Volume & Revenue)
- 1.2.2 Segmentation Objectives
- 1.2.3 Competitive Intelligence Objectives
- 1.2.4 Forecast & Scenario Objectives
- 1.3 Report Scope
- 1.3.1 Agricultural Colorants Scope – Types & Subtypes Covered
- 1.3.2 Geographic Scope – Regions & Countries Covered
- 1.3.3 Historical Period, Base Year & Forecast Period (2025; forecast to 2032)
- 1.3.4 Inclusions & Exclusions
- 1.4 HS Code & Classification Framework
- 1.5 Currency, Units & Pricing Basis
- 1.6 Target Stakeholders
- 1.7 Limitations & Assumptions
Chapter 2. Executive Summary
- 2.1 Global Agricultural Colorants Market Snapshot
- 2.1.1 Market Size – Historical (2025) & Forecast (2025-2032) (2025: USD 2,206.49 million → 2032: USD 3,252.57 million)
- 2.1.2 Volume & Revenue – Global Totals
- 2.1.3 Key Market Highlights – Top Five Facts
- 2.2 Agricultural Colorants Market Segmentation Snapshot
- 2.2.1 Market Split by Region – 2025 vs. 2032
- 2.3 Competitive Snapshot
- 2.3.1 Top 10 Players by Revenue Share – 2025
- 2.3.2 Top 10 Players by Volume Share – 2025
- 2.3.3 Recent Strategic Developments (18-Month Summary)
- 2.4 Key Investment Highlights & Strategic Conclusions
Chapter 3. Agricultural Colorants Market Dynamics & Industry Analysis
- 3.1 Market Overview & Context
- 3.1.1 Agricultural Colorants Market Position in the Broader Automotive Value Chain
- 3.1.2 OEM vs. Replacement Market Dynamics
- 3.1.3 Market Maturity & Development Stage by Region
- 3.2 Agricultural Colorants Market Drivers
- 3.3 Agricultural Colorants Market Restraints & Challenges
- 3.4 Agricultural Colorants Market Opportunities
- 3.5 Porter's Five Forces Analysis
- 3.5.1 Threat of New Entrants
- 3.5.2 Bargaining Power of Suppliers
- 3.5.3 Bargaining Power of Buyers
- 3.5.4 Threat of Substitutes
- 3.5.5 Competitive Rivalry – Intensity Assessment
- 3.6 Agricultural Colorants Value Chain Analysis
- 3.6.1 Upstream – Raw Material/Input Suppliers
- 3.6.1.1 Raw Material/Input 1
- 3.6.1.2 Raw Material/Input 2
- 3.6.1.3 Raw Material/Input 3
- 3.6.2 Midstream – Production/Manufacturing/Service Delivery
- 3.6.2.1 Production/Process Overview
- 3.6.2.2 Key Facility Locations & Capacity by Manufacturer
- 3.6.3 Downstream – Distribution & End Consumer
- 3.6.3.1 Primary Channel – B2B/OEM
- 3.6.3.2 Secondary Channels – Dealer, Retail, Online, Direct
- 3.6.4 Value Chain Profitability Analysis
- 3.6.1 Upstream – Raw Material/Input Suppliers
- 3.7 PESTEL Analysis
- 3.7.1 Political Factors
- 3.7.2 Economic Factors
- 3.7.3 Social Factors
- 3.7.4 Technological Factors
- 3.7.5 Environmental Factors
- 3.7.6 Legal Factors
- 3.8 Agricultural Colorants Supply Chain Analysis
- 3.8.1 Raw Material/Input Supply Risk Assessment
- 3.8.2 Manufacturing Concentration Risk (Geographic Exposure)
- 3.8.3 Trade Disruption Impact Analysis
- 3.9 Regulatory & Policy Landscape
Note: The regulatory and policy landscape section covers regulations based on their applicability to the market, Agricultural Colorants category, geography, and scope of the study. Only regulatory frameworks with a material impact on operations, compliance, trade, sustainability, or market access are analyzed in detail.
Chapter 4. Key Investment Pockets & Opportunity Analysis
- 4.1 Agricultural Colorants Market Attractiveness Analysis
- 4.1.1 By Region – Investment Attractiveness Matrix (Volume × CAGR)
- 4.2 Absolute Revenue Growth Opportunity
- 4.2.1 By Region – Absolute USD Growth Through 2032
- 4.3 Incremental Volume Opportunity
- 4.3.1 By Region – Incremental Volume Through 2032
- 4.3.2 Segment – Incremental Volume
- 4.4 Emerging Submarket Opportunity Deep Dive (Subject to Applicability)
- 4.5 Emerging Market Opportunity Scorecards
- 4.5.1 United States
- 4.5.2 Europe
- 4.5.3 Asia
- 4.5.4 Middle East & Africa
Note: Emerging Market Opportunity Scorecards will be included based on relevance and strategic importance. Regions listed are indicative and may vary depending on data availability and market dynamics.
Chapter 5. Agricultural Colorants Import-Export Analysis & Trade Flows
- 5.1 Global Trade Overview
- 5.1.1 Global Export Value by Country (2025)
- 5.1.2 Global Export Volume by Country (2025)
- 5.1.3 Global Import Value by Country (2025)
- 5.1.4 Global Import Volume by Country (2025)
- 5.1.5 Net Trade Balance by Country (2025)
- 5.2 Export Analysis – Segment
- 5.2.1 Type 1 (HS Code)
- 5.2.2 Type 2 (HS Code)
- 5.2.3 Type 3 (HS Code)
- 5.2.4 Type 4 (HS Code)
- 5.2.5 Type 5 (HS Code)
- 5.3 Import Analysis – Segment
- 5.3.1 Type 1 (HS Code)
- 5.3.2 Type 2 (HS Code)
- 5.3.3 Type 3 (HS Code)
- 5.3.4 Type 4 (HS Code)
- 5.3.5 Type 5 (HS Code)
- 5.4 Average Unit Trade Prices
- 5.4.1 Average Export Price – Segment & Country
- 5.4.2 Average Import Price – Segment & Source Country
- 5.4.3 Price Trends (2025)
- 5.5 Key Trade Route Analysis
- 5.5.1 Trade Route 1
- 5.5.2 Trade Route 2
- 5.5.3 Trade Route 3
- 5.5.4 Trade Route 4
- 5.5.5 Trade Route 5
- 5.6 Trade Policy Impact Assessment
- 5.6.1 US Anti-Dumping & Section 301 Tariffs
- 5.6.2 EU Customs Union Impact
- 5.6.3 Major Free Trade Agreements
- 5.6.4 USMCA Rules of Origin
Note: Trade policy analysis will be included only where relevant to the Agricultural Colorants market.
Chapter 6. Competitive Landscape & Company Benchmarking
- 6.1 Agricultural Colorants Market Concentration & Structure
- 6.1.1 Herfindahl-Hirschman Index (HHI) – vs. 2025
- 6.1.2 Tier 1, Tier 2 & Tier 3 Market Structure
- 6.1.3 Global, Regional & Local Player Dynamics
- 6.2 Agricultural Colorants Market Share Analysis – 2025
- 6.2.1 Global Revenue Share by Company
- 6.2.2 Global Volume Share by Company
- 6.2.3 Regional Revenue Share
- 6.2.4 Market Share Evolution ( vs. 2025)
- 6.2.5 OEM Segment Share by Company
- 6.2.6 Replacement Segment Share by Company
- 6.3 Production/Delivery Capacity & Facility Analysis
- 6.3.1 Global Installed Capacity
- 6.3.2 Capacity Utilization Rates
- 6.3.3 Production/Output Volume
- 6.3.4 Facility Locations & Capacity Map
- 6.3.5 Planned Capacity Additions
- 6.4 Agricultural Colorants Competitive Benchmarking Matrix
- 6.4.1 Revenue, Volume, CAGR & Profitability Comparison
- 6.4.2 Channel Revenue Mix
- 6.4.3 Geographic Revenue Exposure
- 6.4.4 R&D Intensity
- 6.4.5 Sustainability Maturity
- 6.5 Strategic Developments in Agricultural Colorants (Last 24 Months)
- 6.5.1 Mergers, Acquisitions & Divestments
- 6.5.2 New Agricultural Colorants Launches
- 6.5.3 Facility Expansions
- 6.5.4 Strategic Alliances, Joint Ventures & Partnerships
- 6.5.5 Distribution Expansion & Market Entry
- 6.5.6 Sustainability & ESG Initiatives
- 6.6 Competitive Strategy Mapping
- 6.6.1 Leader, Challenger, Follower & Niche Classification
- 6.6.2 Pricing Strategy Comparison
- 6.6.3 Channel Strategy Matrix
Note: Strategic developments are included based on their materiality and the availability of reliable information.
Chapter 7. Global Agricultural Colorants Market – By Distribution Channel
- 7.1 Segment Overview
- 7.1.1 Volume & Revenue Split by Channel (2025 & 2032)
- 7.1.2 Channel Mix Evolution (2025-2032)
Chapter 8. Regional Market Analysis – Global Overview
- 8.1 Global Regional Overview
- 8.1.1 Regional Volume Share
- 8.1.2 Regional Revenue Share
- 8.1.3 Regional Volume by Region
- 8.1.4 Regional Revenue by Region
- 8.1.5 Regional Forecast Through 2032
- 8.2 Cross-Regional Segment Analysis
- 8.2.1 By Distribution Channel
- 8.2.2 By Brand/Price Tier
Chapter 9. North America Agricultural Colorants Market
- 9.1 United States
- 9.2 Canada
- 9.3 Mexico
Chapter 10. Europe Agricultural Colorants Market
- 10.1 Germany
- 10.2 France
- 10.3 Italy
- 10.4 United Kingdom
- 10.5 Spain
- 10.6 Poland
- 10.7 Russia
- 10.8 Netherlands
- 10.9 Belgium
- 10.10 Sweden
- 10.11 Denmark
- 10.12 Norway
- 10.13 Rest of Europe
Chapter 11. Asia Pacific Agricultural Colorants Market
- 11.1 China
- 11.2 India
- 11.3 Japan
- 11.4 South Korea
- 11.5 Thailand
- 11.6 Indonesia
- 11.7 Vietnam
- 11.8 Malaysia
- 11.9 Australia
- 11.10 Rest of Asia Pacific
Chapter 12. Latin America Agricultural Colorants Market
- 12.1 Brazil
- 12.2 Argentina
- 12.3 Colombia
- 12.4 Chile
- 12.5 Rest of Latin America
Chapter 13. Middle East Agricultural Colorants Market
- 13.1 Saudi Arabia
- 13.2 United Arab Emirates
- 13.3 Turkey
- 13.4 Israel
- 13.5 Iran
- 13.6 Rest of the Middle East
Chapter 14. Africa Agricultural Colorants Market
- 14.1 South Africa
- 14.2 Egypt
- 14.3 Nigeria
- 14.4 Morocco
- 14.5 Rest of Africa
Chapter 15. Agricultural Colorants Company Profiles
- 15.1 [Company 01]
- 15.1.1 Company Overview
- 15.1.2 Key Management Personnel
- 15.1.3 Products & Services Portfolio
- 15.1.4 Financial Performance
- 15.1.5 Key Market Focus & Geographic Presence
- 15.1.6 Recent Developments & Strategic Initiatives
Note: The company profile list is preliminary and may change based on research findings, market developments, data availability, and client requirements.
Chapter 16. Appendices
- Appendix A – List of Abbreviations & Acronyms
- Appendix B – Industry Classification Code Reference – Full Series
- Appendix C – Production & Capacity Data Tables
- Appendix D – End-Use & Demand Base Tables
- Appendix E – Consumption & Replacement Rate Assumptions
- Appendix F – ASP Reference Tables
- Appendix G – Manufacturing & Facility Database
- Appendix H – Import-Export Data Tables
- Appendix I – Regulatory Summary Tables
- Appendix J – Primary Research Participant List (Anonymized)
- Appendix K – Primary Research Questionnaire Framework
- Appendix L – Data Sources & Bibliography
- Appendix M – Market Size Divergence & Source Comparison
Chapter 17. Research Methodology
- 17.1 Research Framework & Philosophy
- 17.2 Secondary Research – Sources, Hierarchy & Data Extraction
- 17.3 Data Modeling – Bottom-Up & Top-Down Market Sizing
- 17.4 Primary Research – Stakeholder Framework, LOI & Sample Sizes
- 17.5 Forecast Methodology – Regression, Scenario & Sensitivity Analysis
- 17.6 Quality Control – Four-Layer Validation Framework
- 17.7 Limitations & Standard Assumptions
- 17.8 Disclaimer
