
Chemical Seed Treatment Market Overview:
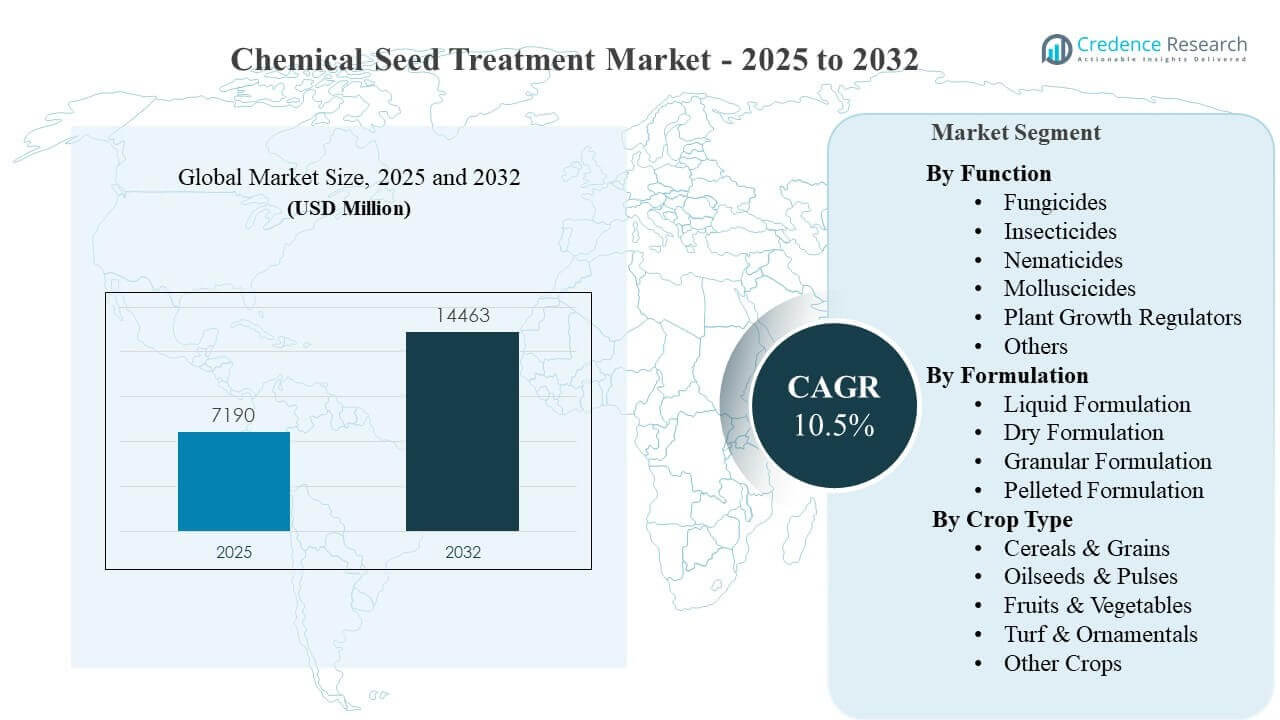
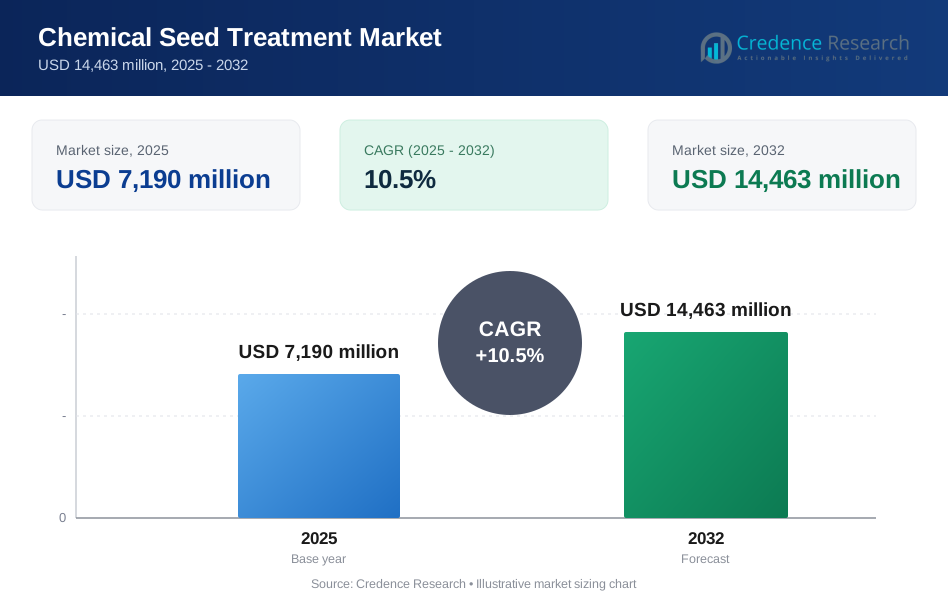
The global Chemical Seed Treatment Market size was estimated at USD 7,190 million in 2025 and is expected to reach USD 14,463 million by 2032, growing at a CAGR of 10.5% from 2025 to 2032. Growth is primarily supported by the rising economic value of hybrid and biotech seeds, which increases the need to protect germination and early vigor from pests and seed- or soil-borne diseases. Latin America remains a high-intensity consumption hub because large-acre soybean and corn systems typically embed seed-applied protection as a standard preventive practice.
| REPORT ATTRIBUTE | DETAILS |
|---|---|
| Historical Period | 2020-2024 |
| Base Year | 2025 |
| Forecast Period | 2026-2032 |
| Chemical Seed Treatment Market Size 2025 | USD 7,190 million |
| Chemical Seed Treatment Market, CAGR | 10.5% |
| Chemical Seed Treatment Market Size 2032 | USD 14,463 million |
Key Market Trends & Insights
- The market expands from USD 7,190 million (2025) to USD 14,463 million (2032), reflecting a 10.5% CAGR (2025–2032).
- Insecticides led the function mix at 69.8% share in 2025, reflecting strong demand for early-season protection against stand-loss pests.
- Cereals & Grains accounted for the largest crop-type share at 40.7% in 2025, supported by large planted area and standardized seed programs.
- Latin America led regional demand with 42.8% share in 2025, indicating the concentration of seed-treatment intensity in row-crop production belts.
- North America represented 20.3% share in 2025, supported by high penetration of commercial treated seed in corn and soybean systems.
Segment Analysis
Chemical seed treatment demand is closely linked to growers’ focus on stand establishment and yield-risk reduction during the first weeks after planting. Treated seed provides a preventive layer against insect feeding, fungal infection, and nematode pressure when crops are most vulnerable and replanting is costly. Adoption is also shaped by the shift toward professionally treated seed, where consistent dosing, coverage uniformity, and dust control are important for safety and performance. As seed systems modernize, integrated offerings that bundle active ingredients with coating polymers and handling enhancers become more common.
Supplier strategies increasingly emphasize differentiated formulations that improve adhesion, minimize dust-off, and enhance compatibility with high-speed treating lines. Portfolio development also reflects a broader protection stack, including nematode solutions and treatment packages designed for specific crop–pest complexes. Demand is strongest in commercial row crops where farm scale, planting speed, and compressed operating windows raise the value of a one-time, at-plant protection approach. These dynamics reinforce steady upgrades toward premium treatment packages across major seed brands and distributors.
By Function Insights
Insecticides accounted for the largest share of 69.8% in 2025. Early-season insect pressure can cause irreversible stand loss, so preventive protection is valued more than reactive control once damage occurs. Seed-applied insecticides also reduce dependence on in-season sprays, supporting labor efficiency and timelier field operations. Premium seed economics further strengthen the rationale to protect emergence and early vigor, especially in large-acre crops.
By Formulation Insights
Liquid formulations are widely preferred in commercial treating operations because they support uniform coverage and reliable adhesion across high-throughput equipment. Dry and granular approaches remain relevant where logistics, storage, or application constraints favor simpler handling, but performance consistency depends heavily on coating quality. Pelleted formulations are used where improved seed size uniformity, plantability, or multi-ingredient delivery is required, particularly in specialty seed systems. Across formulations, dust control and seed safety remain core decision factors for professional treaters and seed companies.
By Crop Type Insights
Cereals & Grains accounted for the largest share of 40.7% in 2025. Large planted area and commodity-scale production keep cereals and grains as the biggest consumption pool for seed-applied protection. Early planting into cooler soils and variable moisture conditions elevates disease and pest risk, supporting preventive treatments. Standardized seed distribution channels also accelerate adoption because treatment can be embedded into certified seed supply.
Chemical Seed Treatment Market Drivers
Rising value of commercial seed and need to protect establishment
Higher adoption of hybrids and biotech traits increases the economic cost of stand loss and poor early vigor. Chemical seed treatment reduces downside risk by protecting emergence against pests and seed- or soil-borne pathogens. Preventive protection is particularly valuable where replanting windows are narrow and crop timing is critical for yield. Seed treatment also fits modern mechanized farming because it delivers protection without additional in-season passes. These factors reinforce steady upgrades toward premium treatment packages.
- For instance, Golden Harvest reported that adding Syngenta’s Vayantis seed treatment to CruiserMaxx Vibrance increased soybean stands by 3,000 plants/acre at Slater, Iowa, and 6,000 plants/acre at Cedar Rapids, while averaging 10,000 plants/acre more than untreated entries across three Iowa sites.
Intensification of row-crop production and larger farm operating scale
As farm sizes grow and planting is completed faster, operational efficiency becomes a competitive necessity. Seed treatment supports this need by providing early protection in a single, standardized step at planting. Large-acre operations also prioritize consistent emergence and uniform stands to optimize fertilizer and irrigation responses later in the season. This encourages adoption of professionally treated seed from commercial channels. The outcome is stronger baseline demand in large-scale cereals, maize, and soybean systems.
Expansion of professional seed treating and integrated input offerings
Seed companies and distributors increasingly provide treated seed as a default offering, improving consistency and compliance with stewardship standards. Professional treating lines improve dose accuracy, coverage, and dust control compared with farm-applied methods. Bundled programs that combine multiple actives and coating technologies simplify decision-making for growers. This structure supports higher penetration in established markets and accelerates uptake in regions with improving seed distribution infrastructure. The value proposition strengthens where labor constraints and timing risk are high.
Evolving pest and disease pressure under variable climate conditions
Weather variability can increase early-season disease outbreaks and shifts in pest pressure, raising the value of preventive approaches. Seed and soil-borne pathogens can significantly reduce stand density when planting conditions are cool or wet. Insect feeding risk can rise when planting is delayed or when pest life cycles shift with temperature. Chemical seed treatment helps stabilize establishment across variable seasons and supports more predictable yield outcomes. These dynamics support consistent demand even when crop prices fluctuate.
- For instance, Bayer reported that soybeans treated with ILeVO seed treatment yielded 2 bu/acre more than untreated checks in an SDS management study, while Crop Protection Network documented a 35% reduction in SDS foliar disease index and a 4.4 bu/acre yield increase versus a commercial base seed treatment.
Chemical Seed Treatment Market Challenges
Regulatory scrutiny and tightening stewardship expectations constrain product availability and slow the pace of new registrations in some geographies. This increases compliance costs, requires stronger residue and environmental risk packages, and can limit certain active ingredients or use patterns. In parallel, resistance management needs can reduce long-term efficacy if chemistry rotation and integrated pest management are not adopted consistently. These pressures force suppliers to invest heavily in innovation and lifecycle management.
- For instance, Syngenta’s PLINAZOLIN technology introduced a novel IRAC Group 30 mode of action and was positioned for commercialization in more than 40 countries and over 40 crops, with further registrations planned over the following two to five years, underscoring the scale of regulatory work and lifecycle investment needed to bring new resistance-management tools to market.
Performance variability across soils, climates, and pest complexes also remains a practical challenge for broad, one-size-fits-all positioning. Growers may question incremental value when pest pressure is low, especially in cost-sensitive seasons. Treatment compatibility issues, dust-off concerns, and seed handling requirements can increase operational complexity for seed treaters. As a result, suppliers must support clearer agronomic guidance, stronger field validation, and improved formulation/coating technologies.
Chemical Seed Treatment Market Trends and Opportunities
Integrated seed treatment packages that combine multiple functions are gaining traction as growers seek simplified, at-plant risk management. This supports demand for multi-active programs that address insect and disease pressure simultaneously and improve consistency across variable seasons. Suppliers are also emphasizing formulation and coating upgrades that improve adhesion, reduce dust, and enhance flowability for high-speed treating lines. These improvements help expand professional treating volumes and strengthen premium positioning.
Biological and hybrid programs are increasingly positioned alongside conventional chemistries as part of broader seed-applied solutions. This creates opportunities for differentiated offerings focused on crop vigor, stress tolerance support, or targeted protection in specific pest complexes. Growth is also supported by the continued modernization of seed value chains in developing regions, where certified seed and commercial distribution expand treatment penetration. Together, these trends support both premiumization and wider adoption across crops and regions.
- For instance, Corteva said its naturally derived Lumidapt Valta LS biological nutrition seed treatment delivered a 2.0 bu./A yield advantage when added to the LumiGEN corn seed treatment recipe, based on an average of 72 U.S. field locations from 2022 to 2024.
Regional Insights
North America (20.3% share in 2025)
North America benefits from high penetration of commercial corn and soybean seed systems, where treated seed is commonly integrated into purchase decisions. Demand is strengthened by large farm scale and the value placed on uniform emergence and stand establishment. Professional treating infrastructure and strong dealer networks support consistent product availability and program adoption. Suppliers compete on formulation performance, compatibility with seed traits, and ease of use in high-throughput systems.
Europe (13.1% share in 2025)
Europe is supported by established seed production and structured distribution, particularly for cereals and oilseeds. Adoption is shaped by stewardship requirements and more stringent regulatory frameworks, which can influence product portfolios and use patterns. Demand remains anchored in protecting establishment under variable spring planting conditions and in maintaining uniform crop stands. Innovation emphasis often centers on safer handling, improved formulations, and compliance-aligned positioning.
Asia Pacific (19.1% share in 2025)
Asia Pacific demand is driven by the gradual shift toward certified seed, expanding commercialization, and intensification in key cropping systems. The region has diverse farm structures, so uptake varies by crop, farm scale, and country-level seed channel maturity. As seed systems modernize, professional treating volumes and premium programs typically expand. Suppliers focus on crop- and geography-specific programs to match local pest and disease pressure.
Latin America (42.8% share in 2025)
Latin America leads global demand due to the concentration of large-acre soybean and corn systems and strong adoption of preventive at-plant protection practices. Treated seed is often embedded into standard agronomic programs to protect establishment and reduce early-season risk. Mechanized operations and compressed planting windows reinforce the value of a single, upfront protection step. Competitive intensity is high, with strong emphasis on performance consistency and program breadth.
Middle East & Africa (4.7% share in 2025)
Middle East & Africa remains a smaller share market, but growth is supported by gradual expansion of commercial farming and formal seed channels in select countries. Adoption increases where mechanization improves and where growers shift toward higher quality seed inputs. Suppliers typically focus on channel development, training, and fit-for-purpose formulations that work across variable logistics conditions. Demand is strongest in pockets with more established commercial cropping.
Competitive Landscape
Competition is shaped by product performance, formulation and coating technologies, regulatory compliance capabilities, and the ability to supply integrated programs through strong seed and dealer channels. Large players leverage broad portfolios across insecticides, fungicides, and complementary solutions, often pairing actives with proprietary formulation systems to improve adhesion, coverage, and handling. Differentiation increasingly comes from program design tied to crop-specific risk profiles, support tools for treaters, and strong stewardship messaging. Partnerships with seed companies and distributors remain critical to scale treated-seed penetration.
Syngenta Group typically emphasizes breadth of crop protection portfolios and integration with commercial seed ecosystems to reinforce seed-applied solutions within broader crop programs. The company’s approach generally focuses on strengthening product platforms, sustaining performance through formulation upgrades, and supporting distribution channels that embed treatments into packaged offerings. This positioning supports premium program adoption in large-acre crops where early-season risk management is standardized. Ongoing portfolio development and regulatory progress remain central to maintaining competitiveness.
The industry research and growth report includes detailed analyses of the competitive landscape of the market and information about key companies, including:
- Syngenta Group
- Bayer CropScience AG
- BASF SE
- Corteva Agriscience
- FMC Corporation
- Nufarm Limited
- UPL Ltd.
- Sumitomo Chemical Co., Ltd.
- PI Industries Ltd.
Qualitative and quantitative analysis of companies has been conducted to help clients understand the wider business environment as well as the strengths and weaknesses of key industry players. Data is qualitatively analyzed to categorize companies as pure play, category-focused, industry-focused, and diversified; it is quantitatively analyzed to categorize companies as dominant, leading, strong, tentative, and weak.
Recent Developments
- In July 2025, Bayer launched Yoalo, a biostimulant seed treatment for corn based on Bacillus velezensis, aimed at improving early-stage crop performance and strengthening Bayer’s position in seed treatment innovation.
- In January 2025, UPL Corp announced the launch of ATROFORCE bionematicide seed treatment for cotton after receiving U.S. EPA registration, positioning the product for the 2025 season and targeting nematode-related yield loss.
- In March 2024, FMC Corporation entered a partnership with Novonesis in Canada to expand its biologicals crop protection platform, with FMC becoming the exclusive distributor of several Novonesis biosolution products for the 2025 growing season while also collaborating on new technology development.
Report Scope
| Report Attribute | Details |
| Market size value in 2025 | USD 7190 million |
| Revenue forecast in 2032 | USD 14463 million |
| Growth rate (CAGR) | 10.5% (2025–2032) |
| Base year | 2025 |
| Forecast period | 2026-2032 |
| Quantitative units | USD million |
| Segments covered | By Function Outlook: Fungicides, Insecticides, Nematicides, Molluscicides, Plant Growth Regulators, Others; By Formulation Outlook: Liquid Formulation, Dry Formulation, Granular Formulation, Pelleted Formulation; By Crop Type Outlook: Cereals & Grains, Oilseeds & Pulses, Fruits & Vegetables, Turf & Ornamentals, Other Crops |
| Regional scope | North America, Europe, Asia Pacific, Latin America, Middle East & Africa |
| Key companies profiled | Syngenta Group, Bayer CropScience AG, BASF SE, Corteva Agriscience, FMC Corporation, Nufarm Limited, UPL Ltd., Sumitomo Chemical Co., Ltd., PI Industries Ltd. |
| No.of Pages | 327 |
Segmentation
By Function
- Fungicides
- Insecticides
- Nematicides
- Molluscicides
- Plant Growth Regulators
- Others
By Formulation
- Liquid Formulation
- Dry Formulation
- Granular Formulation
- Pelleted Formulation
By Crop Type
- Cereals & Grains
- Oilseeds & Pulses
- Fruits & Vegetables
- Turf & Ornamentals
- Other Crops
By Region
- North America
- U.S.
- Canada
- Mexico
- Europe
- Germany
- France
- U.K.
- Italy
- Spain
- Rest of Europe
- Asia Pacific
- China
- Japan
- India
- South Korea
- South-east Asia
- Rest of Asia Pacific
- Latin America
- Brazil
- Argentina
- Rest of Latin America
- Middle East & Africa
- GCC Countries
- South Africa
- Rest of the Middle East and Africa
Request a Free Sample
Fill in your details and we'll send you a free sample report.
- Sample data tables & charts
- Research methodology
Need a Custom Version of This Report?
Tailor the scope, geography, or segments to your exact requirements.
- Custom geography or segment scope
- Direct access to our analyst team
Frequently Asked Questions
What is the current size and forecast size of the Chemical Seed Treatment Market?
What is the CAGR of the Chemical Seed Treatment Market?
What is the largest segment in the market?
What are the key factors driving market growth?
Which companies are leading in the Chemical Seed Treatment Market?
Which region leads the Chemical Seed Treatment Market?
Table of Content
Chapter 1. Report Introduction
- 1.1 Report Description & Purpose
- 1.1.1 Report Title & Market Definition
- 1.1.2 Unique Selling Propositions (USP) & Key Differentiators
- 1.1.3 Value Proposition for Stakeholders
- 1.2 Research Objectives
- 1.2.1 Market Sizing Objectives (Volume & Revenue)
- 1.2.2 Segmentation Objectives
- 1.2.3 Competitive Intelligence Objectives
- 1.2.4 Forecast & Scenario Objectives
- 1.3 Report Scope
- 1.3.1 Chemical Seed Treatment Scope – Types & Subtypes Covered
- 1.3.2 Geographic Scope – Regions & Countries Covered
- 1.3.3 Historical Period, Base Year & Forecast Period (2025; forecast to 2032)
- 1.3.4 Inclusions & Exclusions
- 1.4 HS Code & Classification Framework
- 1.5 Currency, Units & Pricing Basis
- 1.6 Target Stakeholders
- 1.7 Limitations & Assumptions
Chapter 2. Executive Summary
- 2.1 Global Chemical Seed Treatment Market Snapshot
- 2.1.1 Market Size – Historical (2025) & Forecast (2025-2032) (2025: USD 7,190 million → 2032: USD 14,463 million)
- 2.1.2 Volume & Revenue – Global Totals
- 2.1.3 Key Market Highlights – Top Five Facts
- 2.2 Chemical Seed Treatment Market Segmentation Snapshot
- 2.2.1 Market Split by Region – 2025 vs. 2032
- 2.3 Competitive Snapshot
- 2.3.1 Top 10 Players by Revenue Share – 2025
- 2.3.2 Top 10 Players by Volume Share – 2025
- 2.3.3 Recent Strategic Developments (18-Month Summary)
- 2.4 Key Investment Highlights & Strategic Conclusions
Chapter 3. Chemical Seed Treatment Market Dynamics & Industry Analysis
- 3.1 Market Overview & Context
- 3.1.1 Chemical Seed Treatment Market Position in the Broader Automotive Value Chain
- 3.1.2 OEM vs. Replacement Market Dynamics
- 3.1.3 Market Maturity & Development Stage by Region
- 3.2 Chemical Seed Treatment Market Drivers
- 3.3 Chemical Seed Treatment Market Restraints & Challenges
- 3.4 Chemical Seed Treatment Market Opportunities
- 3.5 Porter's Five Forces Analysis
- 3.5.1 Threat of New Entrants
- 3.5.2 Bargaining Power of Suppliers
- 3.5.3 Bargaining Power of Buyers
- 3.5.4 Threat of Substitutes
- 3.5.5 Competitive Rivalry – Intensity Assessment
- 3.6 Chemical Seed Treatment Value Chain Analysis
- 3.6.1 Upstream – Raw Material/Input Suppliers
- 3.6.1.1 Raw Material/Input 1
- 3.6.1.2 Raw Material/Input 2
- 3.6.1.3 Raw Material/Input 3
- 3.6.2 Midstream – Production/Manufacturing/Service Delivery
- 3.6.2.1 Production/Process Overview
- 3.6.2.2 Key Facility Locations & Capacity by Manufacturer
- 3.6.3 Downstream – Distribution & End Consumer
- 3.6.3.1 Primary Channel – B2B/OEM
- 3.6.3.2 Secondary Channels – Dealer, Retail, Online, Direct
- 3.6.4 Value Chain Profitability Analysis
- 3.6.1 Upstream – Raw Material/Input Suppliers
- 3.7 PESTEL Analysis
- 3.7.1 Political Factors
- 3.7.2 Economic Factors
- 3.7.3 Social Factors
- 3.7.4 Technological Factors
- 3.7.5 Environmental Factors
- 3.7.6 Legal Factors
- 3.8 Chemical Seed Treatment Supply Chain Analysis
- 3.8.1 Raw Material/Input Supply Risk Assessment
- 3.8.2 Manufacturing Concentration Risk (Geographic Exposure)
- 3.8.3 Trade Disruption Impact Analysis
- 3.9 Regulatory & Policy Landscape
Note: The regulatory and policy landscape section covers regulations based on their applicability to the market, Chemical Seed Treatment category, geography, and scope of the study. Only regulatory frameworks with a material impact on operations, compliance, trade, sustainability, or market access are analyzed in detail.
Chapter 4. Key Investment Pockets & Opportunity Analysis
- 4.1 Chemical Seed Treatment Market Attractiveness Analysis
- 4.1.1 By Region – Investment Attractiveness Matrix (Volume × CAGR)
- 4.2 Absolute Revenue Growth Opportunity
- 4.2.1 By Region – Absolute USD Growth Through 2032
- 4.3 Incremental Volume Opportunity
- 4.3.1 By Region – Incremental Volume Through 2032
- 4.3.2 Segment – Incremental Volume
- 4.4 Emerging Submarket Opportunity Deep Dive (Subject to Applicability)
- 4.5 Emerging Market Opportunity Scorecards
- 4.5.1 United States
- 4.5.2 Europe
- 4.5.3 Asia
- 4.5.4 Middle East & Africa
Note: Emerging Market Opportunity Scorecards will be included based on relevance and strategic importance. Regions listed are indicative and may vary depending on data availability and market dynamics.
Chapter 5. Chemical Seed Treatment Import-Export Analysis & Trade Flows
- 5.1 Global Trade Overview
- 5.1.1 Global Export Value by Country (2025)
- 5.1.2 Global Export Volume by Country (2025)
- 5.1.3 Global Import Value by Country (2025)
- 5.1.4 Global Import Volume by Country (2025)
- 5.1.5 Net Trade Balance by Country (2025)
- 5.2 Export Analysis – Segment
- 5.2.1 Type 1 (HS Code)
- 5.2.2 Type 2 (HS Code)
- 5.2.3 Type 3 (HS Code)
- 5.2.4 Type 4 (HS Code)
- 5.2.5 Type 5 (HS Code)
- 5.3 Import Analysis – Segment
- 5.3.1 Type 1 (HS Code)
- 5.3.2 Type 2 (HS Code)
- 5.3.3 Type 3 (HS Code)
- 5.3.4 Type 4 (HS Code)
- 5.3.5 Type 5 (HS Code)
- 5.4 Average Unit Trade Prices
- 5.4.1 Average Export Price – Segment & Country
- 5.4.2 Average Import Price – Segment & Source Country
- 5.4.3 Price Trends (2025)
- 5.5 Key Trade Route Analysis
- 5.5.1 Trade Route 1
- 5.5.2 Trade Route 2
- 5.5.3 Trade Route 3
- 5.5.4 Trade Route 4
- 5.5.5 Trade Route 5
- 5.6 Trade Policy Impact Assessment
- 5.6.1 US Anti-Dumping & Section 301 Tariffs
- 5.6.2 EU Customs Union Impact
- 5.6.3 Major Free Trade Agreements
- 5.6.4 USMCA Rules of Origin
Note: Trade policy analysis will be included only where relevant to the Chemical Seed Treatment market.
Chapter 6. Competitive Landscape & Company Benchmarking
- 6.1 Chemical Seed Treatment Market Concentration & Structure
- 6.1.1 Herfindahl-Hirschman Index (HHI) – vs. 2025
- 6.1.2 Tier 1, Tier 2 & Tier 3 Market Structure
- 6.1.3 Global, Regional & Local Player Dynamics
- 6.2 Chemical Seed Treatment Market Share Analysis – 2025
- 6.2.1 Global Revenue Share by Company
- 6.2.2 Global Volume Share by Company
- 6.2.3 Regional Revenue Share
- 6.2.4 Market Share Evolution ( vs. 2025)
- 6.2.5 OEM Segment Share by Company
- 6.2.6 Replacement Segment Share by Company
- 6.3 Production/Delivery Capacity & Facility Analysis
- 6.3.1 Global Installed Capacity
- 6.3.2 Capacity Utilization Rates
- 6.3.3 Production/Output Volume
- 6.3.4 Facility Locations & Capacity Map
- 6.3.5 Planned Capacity Additions
- 6.4 Chemical Seed Treatment Competitive Benchmarking Matrix
- 6.4.1 Revenue, Volume, CAGR & Profitability Comparison
- 6.4.2 Channel Revenue Mix
- 6.4.3 Geographic Revenue Exposure
- 6.4.4 R&D Intensity
- 6.4.5 Sustainability Maturity
- 6.5 Strategic Developments in Chemical Seed Treatment (Last 24 Months)
- 6.5.1 Mergers, Acquisitions & Divestments
- 6.5.2 New Chemical Seed Treatment Launches
- 6.5.3 Facility Expansions
- 6.5.4 Strategic Alliances, Joint Ventures & Partnerships
- 6.5.5 Distribution Expansion & Market Entry
- 6.5.6 Sustainability & ESG Initiatives
- 6.6 Competitive Strategy Mapping
- 6.6.1 Leader, Challenger, Follower & Niche Classification
- 6.6.2 Pricing Strategy Comparison
- 6.6.3 Channel Strategy Matrix
Note: Strategic developments are included based on their materiality and the availability of reliable information.
Chapter 7. Global Chemical Seed Treatment Market – By Distribution Channel
- 7.1 Segment Overview
- 7.1.1 Volume & Revenue Split by Channel (2025 & 2032)
- 7.1.2 Channel Mix Evolution (2025-2032)
Chapter 8. Regional Market Analysis – Global Overview
- 8.1 Global Regional Overview
- 8.1.1 Regional Volume Share
- 8.1.2 Regional Revenue Share
- 8.1.3 Regional Volume by Region
- 8.1.4 Regional Revenue by Region
- 8.1.5 Regional Forecast Through 2032
- 8.2 Cross-Regional Segment Analysis
- 8.2.1 By Distribution Channel
- 8.2.2 By Brand/Price Tier
Chapter 9. North America Chemical Seed Treatment Market
- 9.1 United States
- 9.2 Canada
- 9.3 Mexico
Chapter 10. Europe Chemical Seed Treatment Market
- 10.1 Germany
- 10.2 France
- 10.3 Italy
- 10.4 United Kingdom
- 10.5 Spain
- 10.6 Poland
- 10.7 Russia
- 10.8 Netherlands
- 10.9 Belgium
- 10.10 Sweden
- 10.11 Denmark
- 10.12 Norway
- 10.13 Rest of Europe
Chapter 11. Asia Pacific Chemical Seed Treatment Market
- 11.1 China
- 11.2 India
- 11.3 Japan
- 11.4 South Korea
- 11.5 Thailand
- 11.6 Indonesia
- 11.7 Vietnam
- 11.8 Malaysia
- 11.9 Australia
- 11.10 Rest of Asia Pacific
Chapter 12. Latin America Chemical Seed Treatment Market
- 12.1 Brazil
- 12.2 Argentina
- 12.3 Colombia
- 12.4 Chile
- 12.5 Rest of Latin America
Chapter 13. Middle East Chemical Seed Treatment Market
- 13.1 Saudi Arabia
- 13.2 United Arab Emirates
- 13.3 Turkey
- 13.4 Israel
- 13.5 Iran
- 13.6 Rest of the Middle East
Chapter 14. Africa Chemical Seed Treatment Market
- 14.1 South Africa
- 14.2 Egypt
- 14.3 Nigeria
- 14.4 Morocco
- 14.5 Rest of Africa
Chapter 15. Chemical Seed Treatment Company Profiles
- 15.1 [Company 01]
- 15.1.1 Company Overview
- 15.1.2 Key Management Personnel
- 15.1.3 Products & Services Portfolio
- 15.1.4 Financial Performance
- 15.1.5 Key Market Focus & Geographic Presence
- 15.1.6 Recent Developments & Strategic Initiatives
Note: The company profile list is preliminary and may change based on research findings, market developments, data availability, and client requirements.
Chapter 16. Appendices
- Appendix A – List of Abbreviations & Acronyms
- Appendix B – Industry Classification Code Reference – Full Series
- Appendix C – Production & Capacity Data Tables
- Appendix D – End-Use & Demand Base Tables
- Appendix E – Consumption & Replacement Rate Assumptions
- Appendix F – ASP Reference Tables
- Appendix G – Manufacturing & Facility Database
- Appendix H – Import-Export Data Tables
- Appendix I – Regulatory Summary Tables
- Appendix J – Primary Research Participant List (Anonymized)
- Appendix K – Primary Research Questionnaire Framework
- Appendix L – Data Sources & Bibliography
- Appendix M – Market Size Divergence & Source Comparison
Chapter 17. Research Methodology
- 17.1 Research Framework & Philosophy
- 17.2 Secondary Research – Sources, Hierarchy & Data Extraction
- 17.3 Data Modeling – Bottom-Up & Top-Down Market Sizing
- 17.4 Primary Research – Stakeholder Framework, LOI & Sample Sizes
- 17.5 Forecast Methodology – Regression, Scenario & Sensitivity Analysis
- 17.6 Quality Control – Four-Layer Validation Framework
- 17.7 Limitations & Standard Assumptions
- 17.8 Disclaimer
