
Carrots and Turnips Market Overview:
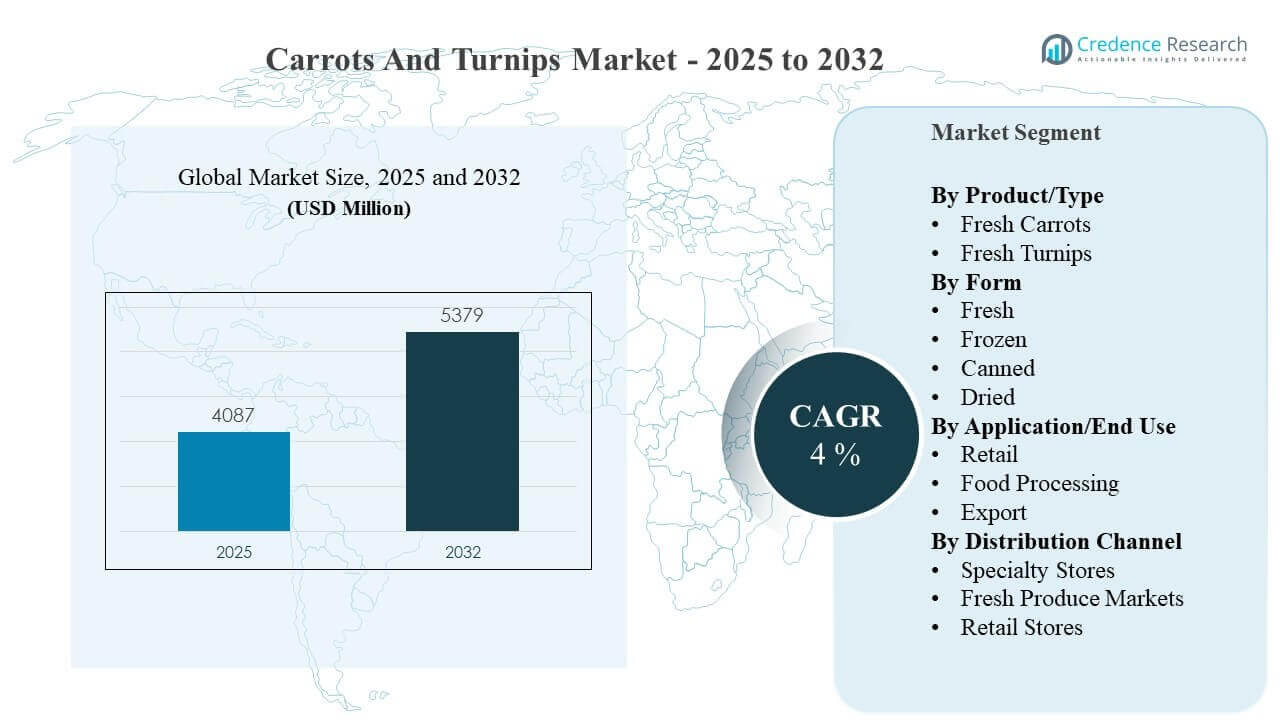
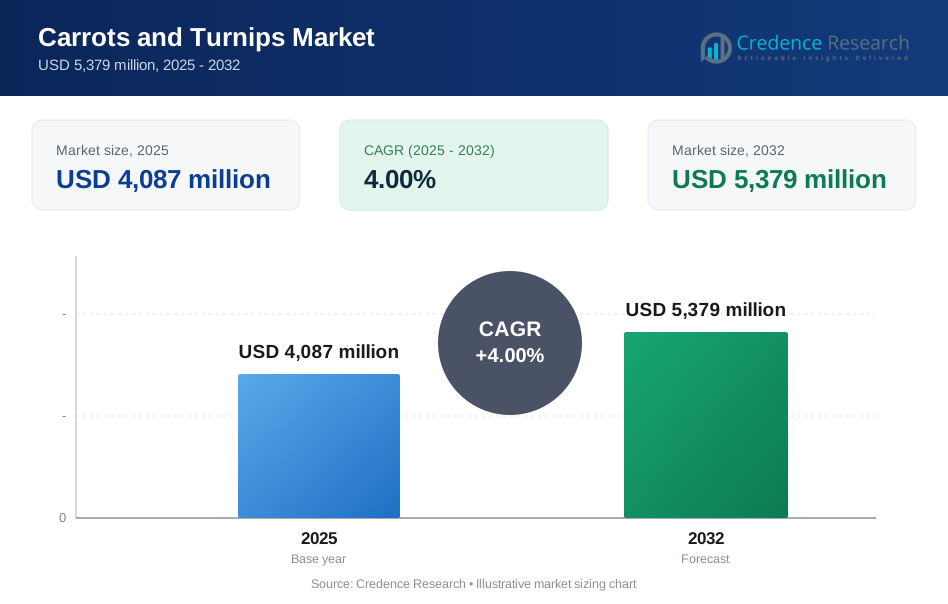
The global Carrots and Turnips Market size was estimated at USD 4,087 million in 2025 and is expected to reach USD 5,379 million by 2032, growing at a CAGR of 4% from 2025 to 2032. The strongest growth driver is sustained everyday consumption of staple root vegetables, supported by modern retail expansion and higher availability of cleaned, graded, and packaged produce that improves consistency and reduces waste across the supply chain. Regional momentum is supported by scale-driven production and consumption in Asia Pacific, alongside steady demand from North America and Europe through organized retail and food processing channels.
| REPORT ATTRIBUTE | DETAILS |
|---|---|
| Historical Period | 2020-2024 |
| Base Year | 2025 |
| Forecast Period | 2026-2032 |
| Carrots and Turnips Market Size 2025 | USD 4,087 million |
| Carrots and Turnips Market, CAGR | 4% |
| Carrots and Turnips Market Size 2032 | USD 5,379 million |
Key Market Trends & Insights
- The Carrots and Turnips Market is projected to expand at a CAGR of 4% during 2025–2032, reflecting steady, staple-led consumption growth.
- The Carrots and Turnips Market is forecast to increase from USD 4,087 million (2025) to USD 5,379 million (2032), indicating stable value expansion over the period.
- Fresh form led demand with an estimated 62.9% share in 2025, supported by everyday cooking usage and preference for taste and texture.
- Asia Pacific accounted for 41.6% share in 2025, driven by large production bases, high household penetration, and broad culinary adoption.
- North America (25.3%) and Europe (21.8%) together represented 47.1% share in 2025, supported by organized retail distribution and quality-led purchasing.
Segment Analysis
Carrots and turnips demand is shaped by a mix of staple household usage, seasonal purchasing patterns, and expanding availability through organized retail. Fresh consumption remains central due to taste, texture, and versatility in daily cooking, which supports steady baseline volumes and repeat purchasing. Food processing demand adds a second engine of growth, driven by soups, frozen meals, sauces, and ingredient supply needs where carrots are widely used. Export activity is influenced by grading standards, storage infrastructure, and logistics reliability that enable consistent cross-border movement.
Value creation increasingly concentrates in packaging, sorting, and shelf-life optimization, with suppliers focusing on quality consistency and shrink reduction from farm to store. Product positioning benefits from premium presentation formats such as washed-and-trimmed packs, smaller portion packs, and convenience-oriented assortments aligned with quick meal preparation. Distribution strategies also matter, as retail stores provide scale and predictable demand, fresh produce markets sustain local and price-sensitive purchasing, and specialty stores support differentiated offerings and premium positioning.
By Product/Type Insights
Fresh carrots typically lead consumption intensity due to broad culinary usage, higher household penetration, and stronger representation in packaged convenience formats. Fresh turnips maintain important demand in specific cuisines and seasonal baskets, with purchasing often linked to local availability and traditional recipes. Product-type performance is influenced by supply consistency, farm-level yields, and quality uniformity that support retail acceptance. Branding and pack-format innovation tends to be more developed for carrots, reinforcing higher movement in mainstream retail channels.
By Form Insights
Fresh accounted for the largest share of 62.9% in 2025. Fresh form leadership is reinforced by consumer preference for taste and texture, everyday cooking versatility, and the perception of higher quality compared to processed formats. Fresh form also benefits from improved sorting, grading, and packaging that extends shelf life and reduces in-store shrink. Frozen, canned, and dried formats remain important as convenience and pantry-stable options, especially for processors and institutional buyers.
By Application/End Use Insights
Retail demand anchors the market due to regular household purchasing and broad availability across modern retail and traditional channels. Food processing expands addressable demand by converting carrots and turnips into ingredients for prepared foods, frozen products, soups, and sauces. Export demand depends on standardized quality, cold-chain and storage strength, and the ability to supply consistent grades at scale. Shifts toward convenience foods and organized retail assortment planning support continued application diversification.
By Distribution Channel Insights
Specialty stores tend to lead channel value concentration because premium positioning, differentiated varieties, and curated produce quality attract higher-value purchasing. Fresh produce markets remain influential for local supply access and price-sensitive consumers, particularly in regions with strong traditional trade. Retail stores provide the highest volume scalability through promotions, consistent replenishment, and national distribution footprints. Channel performance is shaped by freshness management, shrink control, and packaging formats aligned with shopper missions.
Carrots and Turnips Market Drivers
Expansion of organized retail and packaged fresh produce penetration
Organized retail expansion supports predictable demand, stronger merchandising, and consistent quality expectations for carrots and turnips. Packaged fresh produce formats improve presentation, reduce handling losses, and simplify shopping decisions in high-traffic stores. Retail planograms and promotions increase category visibility and help stabilize weekly purchasing frequency. Supply chains benefit from standardized grading and pack sizes, improving throughput for large buyers. These dynamics raise the value captured per unit by enabling premium packaging and better shelf-life performance.
- For instance, Bolthouse Fresh Foods supplies retailers across North America with nearly 700 million pounds of carrots annually, and a documented case study of its baby-carrot plant described sorting by weight, size, and color plus output of about 4,200–4,500 cases per hour, or roughly 2.5 million pounds per day.
Increased preference for convenience-led meal preparation
Convenience-focused consumption supports higher turnover of washed, trimmed, and ready-to-cook vegetable formats. Carrots integrate well into quick cooking workflows, snacks, and multi-cuisine recipes, sustaining consistent household demand. Ready-to-use packs reduce preparation barriers and encourage repeat purchases among time-constrained consumers. Convenience trends also pull demand through food processing, where carrots and turnips are used in prepared meals and soups. Suppliers that align product specs to convenience use cases gain stronger retail placement and processing contracts.
- For instance, Bonduelle’s San Paolo fresh-cut facility runs 13 completely automated processing lines feeding 24 packing lines, has a production capability of 22,000 tons, and can deliver 115 million bags of fresh-cut product each year, showing how automation supports high-volume convenience produce formats.
Processing demand growth and ingredient pull-through
Food processing creates stable off-take demand that complements retail seasonality and supports bulk procurement. Carrots are used across soups, sauces, frozen blends, and prepared foods, creating year-round ingredient demand. Processing requirements incentivize consistent sizing, color, and quality, which strengthens the value of sorting and grading infrastructure. Contracting and forward purchasing can help stabilize farm revenues and reduce volatility. Processing growth also supports investments in storage, logistics, and throughput capacity.
Trade flows supported by better storage and distribution infrastructure
Export growth is enabled when producing regions can maintain quality during storage and long-haul logistics. Investments in cold storage, controlled environments, and packaging improve arrival quality and reduce spoilage risk. Export buyers typically require standardized grading, traceability, and consistent supply schedules, pushing suppliers toward stronger compliance and documentation. Regional production advantages can translate into export competitiveness, especially during off-season windows. Stronger infrastructure increases market access and supports higher-value sales into distant markets.
Carrots and Turnips Market Challenges
Carrots and turnips supply chains face variability driven by weather patterns, disease pressure, and yield fluctuations that can disrupt availability and pricing. Fresh produce logistics also remain sensitive to spoilage risks, with quality degradation affecting retailer acceptance and increasing shrink. The market is exposed to cost pressures from labor, packaging, and transport, which can compress margins for growers and packers. Meeting consistent retail specifications is challenging for smaller producers without strong grading and packing infrastructure.
- For instance, Tong Engineering’s Visar Sortop carrot optical sorter uses 360-degree imaging, detects defects to the nearest millimetre or gram, and inspects 1.8 metres of carrots per second, while its Poland-based washing and grading line handles up to 40 tons per hour with two 5-metre barrel washers and a hydro-cooler.
The market also faces fragmentation in certain regions where traditional channels dominate and supply standardization is limited. Price competition can be intense during peak harvest periods, increasing pressure to differentiate through quality, packaging, or value-added formats. Compliance requirements around food safety, residue limits, and traceability increase operational complexity. Export growth can be constrained by infrastructure gaps, trade policy changes, and inconsistent cold-chain performance that affects delivered quality.
Carrots and Turnips Market Trends and Opportunities
Value-added formats represent a major opportunity as buyers increasingly favor cleaned, trimmed, and portioned vegetables that reduce preparation time. Packaging innovation that improves shelf life and reduces moisture loss can enhance retail performance and reduce shrink. Premium positioning through differentiated varieties, quality grading, and branding can improve price realization for suppliers. These trends support investments in automated sorting, packing lines, and better storage systems to meet retailer and processor requirements.
Sustainability and waste-reduction initiatives are creating opportunities in supply chain efficiency and post-harvest handling. Improving storage conditions and shipment integrity can reduce spoilage and improve realized yields across the distribution chain. Traceability improvements and standardized quality documentation can support export readiness and strengthen retailer confidence. Partnerships with processors and retail chains can enable more stable contracting and better demand forecasting, improving planning across seasons.
- For instance, Walmart, working with IBM on a Hyperledger Fabric-based traceability system, reduced the time needed to trace the provenance of mangoes from about 7 days to 2.2 seconds, and the system now covers more than 25 products from 5 suppliers, demonstrating how digital traceability can accelerate source verification and support tighter supply-chain coordination.
Regional Insights
North America
North America demand is supported by organized retail penetration, consistent household consumption, and growing preference for packaged produce formats that reduce preparation time. Supply chains emphasize grading consistency and stable year-round availability, which supports strong alignment with large retail distribution footprints. Value-added and convenience-led formats provide differentiation and support category premiumization. The region accounted for 25.3% share in 2025.
Europe
Europe demand is supported by broad consumption across cuisines and steady purchasing through modern retail and local trade. Quality standards and supply compliance expectations support investment in post-harvest handling and packaging. Demand strength is also supported by food processing usage across prepared foods and ingredient applications. Europe represented 21.8% share in 2025.
Asia Pacific
Asia Pacific benefits from large-scale production and consumption, strong culinary integration, and high household penetration for root vegetables. The region’s scale supports diversified channels spanning modern retail and traditional markets, with increasing investments in storage and distribution infrastructure. Supply growth and consumption scale provide a base for export flows and processing demand. Asia Pacific held 41.6% share in 2025.
Latin America
Latin America demand is shaped by a mix of local consumption and selective export-oriented production pockets, depending on infrastructure and grading capabilities. Distribution often blends traditional markets with growing organized retail footprints in major urban centers. Opportunities are strongest where cold-chain and logistics improvements enable better quality stability and market reach. Latin America accounted for 6.7% share in 2025.
Middle East & Africa
Middle East & Africa demand is supported by urban food consumption and distribution through both retail stores and traditional fresh markets. Supply chains can be constrained by cold-chain coverage and import reliance in certain markets, creating emphasis on storage and logistics performance. Growth opportunities are linked to improving freshness management and retail modernization. Middle East & Africa represented 4.6% share in 2025.
Competitive Landscape
Competition in the Carrots and Turnips Market is shaped by scale, supply consistency, and the ability to meet retailer and processor specifications on size, quality, and delivery schedules. Large growers and packers compete through year-round availability, strong packing and grading capabilities, and value-added formats that improve shelf presence and reduce retailer shrink. Product differentiation often relies on packaging, freshness performance, and reliable procurement programs with retail and processing buyers. Distribution reach and logistics performance also influence competitive positioning across domestic and export markets.
Grimmway Farms competes through a scale-led fresh produce model with emphasis on consistent supply, quality control, and distribution reliability. Grimmway Farms positioning is strengthened by the ability to support large retail programs and maintain standardized grading that aligns with national accounts. Grimmway Farms also benefits when investments expand value-added capabilities and strengthen integration across packing, storage, and distribution. Grimmway Farms differentiation is typically reinforced through operational efficiency and supply assurance aligned with retailer requirements.
The industry research and growth report includes detailed analyses of the competitive landscape of the market and information about key companies, including:
- Grimmway Farms
- Bolthouse Farms, Inc.
- Dole plc
- Del Monte Pacific Limited
- Vilmorin-Mikado
- Bejo Zaden B.V.
- AgroFresh
- VegPro International
- Groupe Vegco
- Stokke Seeds
- Premium Fresh
- D’Arrigo Bros. of California, Inc.
- Jung Seed Company
- Willowbrook Foods
- Charles Hard Seed Company
Qualitative and quantitative analysis of companies has been conducted to help clients understand the wider business environment as well as the strengths and weaknesses of key industry players. Data is qualitatively analyzed to categorize companies as pure play, category-focused, industry-focused, and diversified; it is quantitatively analyzed to categorize companies as dominant, leading, strong, tentative, and weak.
Recent Developments
- In December 2025, BASF | Nunhems launched the Percyst brand of carrots, describing it as a breakthrough in carrot innovation after more than 20 years of research. The company said the new variety is the first carrot with intermediate resistance to Southern root-knot and root-knot nematodes, while also targeting strong flavor, color, and texture.
- In April 2025, The Verisem Group acquired the Blumen Vegetable Seeds business to strengthen its seed-sector expertise and expand its international reach. The company said the deal would help it provide more advanced and comprehensive seed solutions, making it a notable acquisition in the broader vegetable seeds space
Report Scope
| Report Attribute | Details |
| Market size value in 2025 | USD 4,087 million |
| Revenue forecast in 2032 | USD 5,379 million |
| Growth rate (CAGR) | 4% (2025–2032) |
| Base year | 2025 |
| Forecast period | 2026–2032 |
| Quantitative units | USD million |
| Segments covered | By Product/Type Outlook: Fresh Carrots, Fresh Turnips; By Form Outlook: Fresh, Frozen, Canned, Dried; By Application/End Use Outlook: Retail, Food Processing, Export; By Distribution Channel Outlook: Specialty Stores, Fresh Produce Markets, Retail Stores |
| Regional scope | North America, Europe, Asia Pacific, Latin America, Middle East & Africa |
| Key companies profiled | Grimmway Farms; Bolthouse Farms, Inc.; Dole plc; Del Monte Pacific Limited; Vilmorin-Mikado; Bejo Zaden B.V.; AgroFresh; VegPro International; Groupe Vegco; Stokke Seeds; Premium Fresh; D’Arrigo Bros. of California, Inc.; Jung Seed Company; Willowbrook Foods; Charles Hard Seed Company |
| No. of Pages | 326 |
Segmentation
By product/type
- Fresh Carrots
- Fresh Turnips
By form
- Fresh
- Frozen
- Canned
- Dried
By application/end use
- Retail
- Food Processing
- Export
By distribution channel
- Specialty Stores
- Fresh Produce Markets
- Retail Stores
By region
- North America
- U.S.
- Canada
- Mexico
- Europe
- Germany
- France
- U.K.
- Italy
- Spain
- Rest of Europe
- Asia Pacific
- China
- Japan
- India
- South Korea
- South-east Asia
- Rest of Asia Pacific
- Latin America
- Brazil
- Argentina
- Rest of Latin America
- Middle East & Africa
- GCC Countries
- South Africa
- Rest of the Middle East and Africa
Request a Free Sample
Fill in your details and we'll send you a free sample report.
- Sample data tables & charts
- Research methodology
Need a Custom Version of This Report?
Tailor the scope, geography, or segments to your exact requirements.
- Custom geography or segment scope
- Direct access to our analyst team
Frequently Asked Questions
What is the market size of Carrots and Turnips Market in 2025 and the forecast for 2032?
What is the CAGR for Carrots and Turnips Market during 2025–2032?
What is the largest segment in Carrots and Turnips Market?
What factors are driving Carrots and Turnips Market growth?
Which companies are covered in the Carrots and Turnips Market competitive landscape?
Which region leads the Carrots and Turnips Market in 2025?
Table of Content
Chapter 1. Report Introduction
- 1.1 Report Description & Purpose
- 1.1.1 Report Title & Market Definition
- 1.1.2 Unique Selling Propositions (USP) & Key Differentiators
- 1.1.3 Value Proposition for Stakeholders
- 1.2 Research Objectives
- 1.2.1 Market Sizing Objectives (Volume & Revenue)
- 1.2.2 Segmentation Objectives
- 1.2.3 Competitive Intelligence Objectives
- 1.2.4 Forecast & Scenario Objectives
- 1.3 Report Scope
- 1.3.1 Carrots and Turnips Scope – Types & Subtypes Covered
- 1.3.2 Geographic Scope – Regions & Countries Covered
- 1.3.3 Historical Period, Base Year & Forecast Period (2025; forecast to 2032)
- 1.3.4 Inclusions & Exclusions
- 1.4 HS Code & Classification Framework
- 1.5 Currency, Units & Pricing Basis
- 1.6 Target Stakeholders
- 1.7 Limitations & Assumptions
Chapter 2. Executive Summary
- 2.1 Global Carrots and Turnips Market Snapshot
- 2.1.1 Market Size – Historical (2025) & Forecast (2025-2032) (2025: USD 4,087 million → 2032: USD 5,379 million)
- 2.1.2 Volume & Revenue – Global Totals
- 2.1.3 Key Market Highlights – Top Five Facts
- 2.2 Carrots and Turnips Market Segmentation Snapshot
- 2.2.1 Market Split by Region – 2025 vs. 2032
- 2.3 Competitive Snapshot
- 2.3.1 Top 10 Players by Revenue Share – 2025
- 2.3.2 Top 10 Players by Volume Share – 2025
- 2.3.3 Recent Strategic Developments (18-Month Summary)
- 2.4 Key Investment Highlights & Strategic Conclusions
Chapter 3. Carrots and Turnips Market Dynamics & Industry Analysis
- 3.1 Market Overview & Context
- 3.1.1 Carrots and Turnips Market Position in the Broader Automotive Value Chain
- 3.1.2 OEM vs. Replacement Market Dynamics
- 3.1.3 Market Maturity & Development Stage by Region
- 3.2 Carrots and Turnips Market Drivers
- 3.3 Carrots and Turnips Market Restraints & Challenges
- 3.4 Carrots and Turnips Market Opportunities
- 3.5 Porter's Five Forces Analysis
- 3.5.1 Threat of New Entrants
- 3.5.2 Bargaining Power of Suppliers
- 3.5.3 Bargaining Power of Buyers
- 3.5.4 Threat of Substitutes
- 3.5.5 Competitive Rivalry – Intensity Assessment
- 3.6 Carrots and Turnips Value Chain Analysis
- 3.6.1 Upstream – Raw Material/Input Suppliers
- 3.6.1.1 Raw Material/Input 1
- 3.6.1.2 Raw Material/Input 2
- 3.6.1.3 Raw Material/Input 3
- 3.6.2 Midstream – Production/Manufacturing/Service Delivery
- 3.6.2.1 Production/Process Overview
- 3.6.2.2 Key Facility Locations & Capacity by Manufacturer
- 3.6.3 Downstream – Distribution & End Consumer
- 3.6.3.1 Primary Channel – B2B/OEM
- 3.6.3.2 Secondary Channels – Dealer, Retail, Online, Direct
- 3.6.4 Value Chain Profitability Analysis
- 3.6.1 Upstream – Raw Material/Input Suppliers
- 3.7 PESTEL Analysis
- 3.7.1 Political Factors
- 3.7.2 Economic Factors
- 3.7.3 Social Factors
- 3.7.4 Technological Factors
- 3.7.5 Environmental Factors
- 3.7.6 Legal Factors
- 3.8 Carrots and Turnips Supply Chain Analysis
- 3.8.1 Raw Material/Input Supply Risk Assessment
- 3.8.2 Manufacturing Concentration Risk (Geographic Exposure)
- 3.8.3 Trade Disruption Impact Analysis
- 3.9 Regulatory & Policy Landscape
Note: The regulatory and policy landscape section covers regulations based on their applicability to the market, Carrots and Turnips category, geography, and scope of the study. Only regulatory frameworks with a material impact on operations, compliance, trade, sustainability, or market access are analyzed in detail.
Chapter 4. Key Investment Pockets & Opportunity Analysis
- 4.1 Carrots and Turnips Market Attractiveness Analysis
- 4.1.1 By Region – Investment Attractiveness Matrix (Volume × CAGR)
- 4.2 Absolute Revenue Growth Opportunity
- 4.2.1 By Region – Absolute USD Growth Through 2032
- 4.3 Incremental Volume Opportunity
- 4.3.1 By Region – Incremental Volume Through 2032
- 4.3.2 Segment – Incremental Volume
- 4.4 Emerging Submarket Opportunity Deep Dive (Subject to Applicability)
- 4.5 Emerging Market Opportunity Scorecards
- 4.5.1 United States
- 4.5.2 Europe
- 4.5.3 Asia
- 4.5.4 Middle East & Africa
Note: Emerging Market Opportunity Scorecards will be included based on relevance and strategic importance. Regions listed are indicative and may vary depending on data availability and market dynamics.
Chapter 5. Carrots and Turnips Import-Export Analysis & Trade Flows
- 5.1 Global Trade Overview
- 5.1.1 Global Export Value by Country (2025)
- 5.1.2 Global Export Volume by Country (2025)
- 5.1.3 Global Import Value by Country (2025)
- 5.1.4 Global Import Volume by Country (2025)
- 5.1.5 Net Trade Balance by Country (2025)
- 5.2 Export Analysis – Segment
- 5.2.1 Type 1 (HS Code)
- 5.2.2 Type 2 (HS Code)
- 5.2.3 Type 3 (HS Code)
- 5.2.4 Type 4 (HS Code)
- 5.2.5 Type 5 (HS Code)
- 5.3 Import Analysis – Segment
- 5.3.1 Type 1 (HS Code)
- 5.3.2 Type 2 (HS Code)
- 5.3.3 Type 3 (HS Code)
- 5.3.4 Type 4 (HS Code)
- 5.3.5 Type 5 (HS Code)
- 5.4 Average Unit Trade Prices
- 5.4.1 Average Export Price – Segment & Country
- 5.4.2 Average Import Price – Segment & Source Country
- 5.4.3 Price Trends (2025)
- 5.5 Key Trade Route Analysis
- 5.5.1 Trade Route 1
- 5.5.2 Trade Route 2
- 5.5.3 Trade Route 3
- 5.5.4 Trade Route 4
- 5.5.5 Trade Route 5
- 5.6 Trade Policy Impact Assessment
- 5.6.1 US Anti-Dumping & Section 301 Tariffs
- 5.6.2 EU Customs Union Impact
- 5.6.3 Major Free Trade Agreements
- 5.6.4 USMCA Rules of Origin
Note: Trade policy analysis will be included only where relevant to the Carrots and Turnips market.
Chapter 6. Competitive Landscape & Company Benchmarking
- 6.1 Carrots and Turnips Market Concentration & Structure
- 6.1.1 Herfindahl-Hirschman Index (HHI) – vs. 2025
- 6.1.2 Tier 1, Tier 2 & Tier 3 Market Structure
- 6.1.3 Global, Regional & Local Player Dynamics
- 6.2 Carrots and Turnips Market Share Analysis – 2025
- 6.2.1 Global Revenue Share by Company
- 6.2.2 Global Volume Share by Company
- 6.2.3 Regional Revenue Share
- 6.2.4 Market Share Evolution ( vs. 2025)
- 6.2.5 OEM Segment Share by Company
- 6.2.6 Replacement Segment Share by Company
- 6.3 Production/Delivery Capacity & Facility Analysis
- 6.3.1 Global Installed Capacity
- 6.3.2 Capacity Utilization Rates
- 6.3.3 Production/Output Volume
- 6.3.4 Facility Locations & Capacity Map
- 6.3.5 Planned Capacity Additions
- 6.4 Carrots and Turnips Competitive Benchmarking Matrix
- 6.4.1 Revenue, Volume, CAGR & Profitability Comparison
- 6.4.2 Channel Revenue Mix
- 6.4.3 Geographic Revenue Exposure
- 6.4.4 R&D Intensity
- 6.4.5 Sustainability Maturity
- 6.5 Strategic Developments in Carrots and Turnips (Last 24 Months)
- 6.5.1 Mergers, Acquisitions & Divestments
- 6.5.2 New Carrots and Turnips Launches
- 6.5.3 Facility Expansions
- 6.5.4 Strategic Alliances, Joint Ventures & Partnerships
- 6.5.5 Distribution Expansion & Market Entry
- 6.5.6 Sustainability & ESG Initiatives
- 6.6 Competitive Strategy Mapping
- 6.6.1 Leader, Challenger, Follower & Niche Classification
- 6.6.2 Pricing Strategy Comparison
- 6.6.3 Channel Strategy Matrix
Note: Strategic developments are included based on their materiality and the availability of reliable information.
Chapter 7. Global Carrots and Turnips Market – By Distribution Channel
- 7.1 Segment Overview
- 7.1.1 Volume & Revenue Split by Channel (2025 & 2032)
- 7.1.2 Channel Mix Evolution (2025-2032)
Chapter 8. Regional Market Analysis – Global Overview
- 8.1 Global Regional Overview
- 8.1.1 Regional Volume Share
- 8.1.2 Regional Revenue Share
- 8.1.3 Regional Volume by Region
- 8.1.4 Regional Revenue by Region
- 8.1.5 Regional Forecast Through 2032
- 8.2 Cross-Regional Segment Analysis
- 8.2.1 By Distribution Channel
- 8.2.2 By Brand/Price Tier
Chapter 9. North America Carrots and Turnips Market
- 9.1 United States
- 9.2 Canada
- 9.3 Mexico
Chapter 10. Europe Carrots and Turnips Market
- 10.1 Germany
- 10.2 France
- 10.3 Italy
- 10.4 United Kingdom
- 10.5 Spain
- 10.6 Poland
- 10.7 Russia
- 10.8 Netherlands
- 10.9 Belgium
- 10.10 Sweden
- 10.11 Denmark
- 10.12 Norway
- 10.13 Rest of Europe
Chapter 11. Asia Pacific Carrots and Turnips Market
- 11.1 China
- 11.2 India
- 11.3 Japan
- 11.4 South Korea
- 11.5 Thailand
- 11.6 Indonesia
- 11.7 Vietnam
- 11.8 Malaysia
- 11.9 Australia
- 11.10 Rest of Asia Pacific
Chapter 12. Latin America Carrots and Turnips Market
- 12.1 Brazil
- 12.2 Argentina
- 12.3 Colombia
- 12.4 Chile
- 12.5 Rest of Latin America
Chapter 13. Middle East Carrots and Turnips Market
- 13.1 Saudi Arabia
- 13.2 United Arab Emirates
- 13.3 Turkey
- 13.4 Israel
- 13.5 Iran
- 13.6 Rest of the Middle East
Chapter 14. Africa Carrots and Turnips Market
- 14.1 South Africa
- 14.2 Egypt
- 14.3 Nigeria
- 14.4 Morocco
- 14.5 Rest of Africa
Chapter 15. Carrots and Turnips Company Profiles
- 15.1 [Company 01]
- 15.1.1 Company Overview
- 15.1.2 Key Management Personnel
- 15.1.3 Products & Services Portfolio
- 15.1.4 Financial Performance
- 15.1.5 Key Market Focus & Geographic Presence
- 15.1.6 Recent Developments & Strategic Initiatives
Note: The company profile list is preliminary and may change based on research findings, market developments, data availability, and client requirements.
Chapter 16. Appendices
- Appendix A – List of Abbreviations & Acronyms
- Appendix B – Industry Classification Code Reference – Full Series
- Appendix C – Production & Capacity Data Tables
- Appendix D – End-Use & Demand Base Tables
- Appendix E – Consumption & Replacement Rate Assumptions
- Appendix F – ASP Reference Tables
- Appendix G – Manufacturing & Facility Database
- Appendix H – Import-Export Data Tables
- Appendix I – Regulatory Summary Tables
- Appendix J – Primary Research Participant List (Anonymized)
- Appendix K – Primary Research Questionnaire Framework
- Appendix L – Data Sources & Bibliography
- Appendix M – Market Size Divergence & Source Comparison
Chapter 17. Research Methodology
- 17.1 Research Framework & Philosophy
- 17.2 Secondary Research – Sources, Hierarchy & Data Extraction
- 17.3 Data Modeling – Bottom-Up & Top-Down Market Sizing
- 17.4 Primary Research – Stakeholder Framework, LOI & Sample Sizes
- 17.5 Forecast Methodology – Regression, Scenario & Sensitivity Analysis
- 17.6 Quality Control – Four-Layer Validation Framework
- 17.7 Limitations & Standard Assumptions
- 17.8 Disclaimer
