
Chelated Iron Agriculture Micronutrient Market Overview:
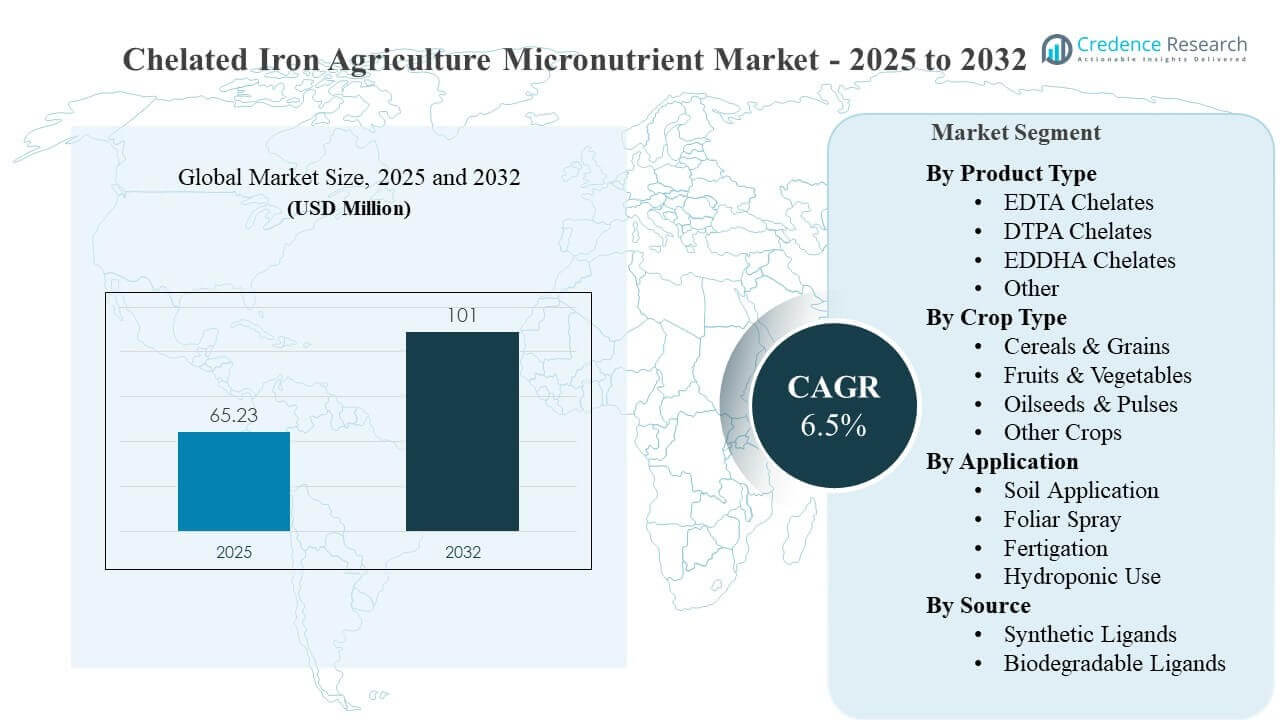
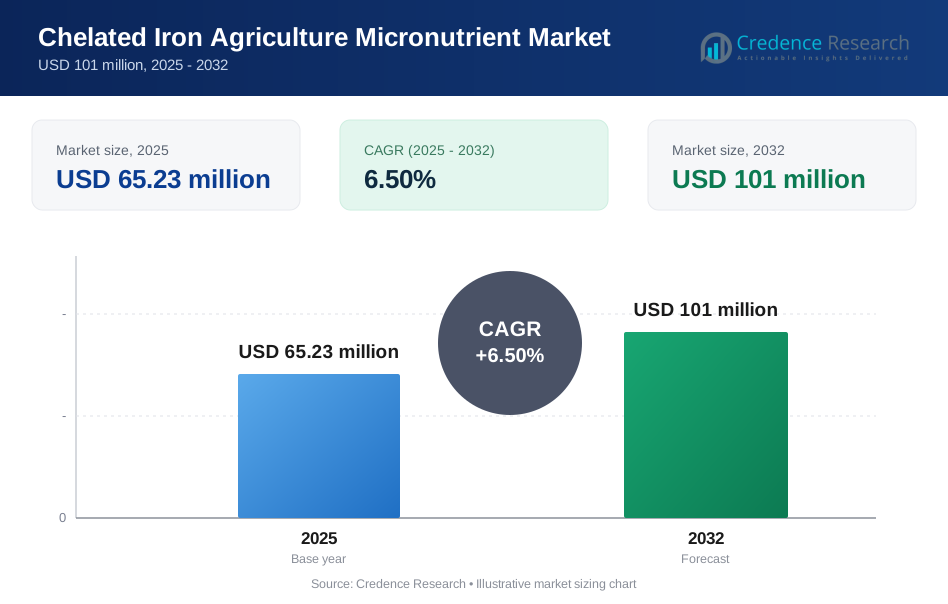
The global Chelated Iron Agriculture Micronutrient Market size was estimated at USD 65.23 million in 2025 and is expected to reach USD 101 million by 2032, growing at a CAGR of 6.5% from 2025 to 2032. Demand is primarily reinforced by the need to correct iron deficiency and chlorosis in soils and production systems where iron availability is structurally constrained, especially under alkaline conditions and intensive cropping. Wider deployment of precision irrigation and controlled-environment agriculture is also increasing the preference for stable, water-soluble chelated iron inputs that integrate cleanly into fertigation and greenhouse nutrition programs.
| REPORT ATTRIBUTE | DETAILS |
|---|---|
| Historical Period | 2020-2024 |
| Base Year | 2025 |
| Forecast Period | 2026-2032 |
| Chelated Iron Agriculture Micronutrient Market Size 2025 | USD 65.23 million |
| Chelated Iron Agriculture Micronutrient Market, CAGR | 6.5% |
| Chelated Iron Agriculture Micronutrient Market Size 2032 | USD 101 million |
Key Market Trends & Insights
- The market is projected to expand at a 6.5% CAGR during 2025–2032, reaching USD 101 million by 2032.
- Asia Pacific accounted for 31.4% of revenue in 2025, supported by faster growth in specialty nutrition adoption and expanding horticulture intensity.
- Soil Application held 49.6% share in 2025, reflecting its role as the default correction approach across broad-acre and many orchard systems.
- Synthetic Ligands represented 64.3% in 2025, indicating continued preference for established ligand chemistries and broad product availability.
- EDTA Chelates accounted for 41.1% in 2025, maintaining leadership due to widespread crop compatibility and entrenched channel programs.
Segment Analysis
Chelated iron adoption in agriculture is closely linked to nutrient-availability constraints, crop value density, and how precisely growers can manage delivery. In many production environments, chelated iron is positioned as a corrective and preventive input to reduce chlorosis risk, protect vegetative vigor, and stabilize yield and quality outcomes. The market benefits from the expansion of water-soluble fertilizer programs and integrated crop nutrition bundles that make micronutrient dosing more standardized. As agronomy practices professionalize, buyers increasingly evaluate products by ligand stability, compatibility with tank mixes and irrigation systems, and performance consistency across variable soil pH.
Purchasing behavior also reflects application practicality. Soil programs remain common because they align with conventional fertilizer placement and early-season correction routines, but fertigation and protected cultivation increase demand for chelates that stay soluble and perform reliably in irrigation water. Crop mix influences willingness to pay: higher-value fruits, vegetables, and protected crops typically justify premium chelated iron use more readily than broad-acre cropping. This strengthens demand for differentiated formulations and technical support services that help optimize timing, dose, and delivery method.
By Product Type Insights
EDTA Chelates accounted for the largest share of 41.1% in 2025. EDTA-based products remain widely adopted because they are broadly compatible with common crop nutrition programs and are routinely integrated into soluble fertilizer portfolios. Established manufacturing scale and distributor familiarity support availability across diverse channels. Many growers also prefer predictable handling and mixing performance, which reduces operational friction in multi-input nutrition schedules.
By Crop Type Insights
Cereals & Grains accounted for the largest share of 36.2% in 2025. Large planted area and the role of cereals in baseline nutrient correction programs sustain volume leadership. Commercial grain operations often adopt standardized nutrition protocols, which improves repeat purchasing and supports wider distribution coverage. Continued focus on yield stability and uniform stand development reinforces demand for reliable micronutrient correction in susceptible soils.
By Application Insights
Soil Application accounted for the largest share of 49.6% in 2025. Soil delivery remains the default approach because it fits conventional fertilization routines and can be implemented at scale with minimal operational change. It is commonly used for early-season correction and as part of broader fertility programs. However, intensification of drip irrigation and precision nutrition is steadily increasing interest in alternative delivery methods where faster response or improved uniformity is required.
By Source Insights
Synthetic Ligands accounted for the largest share of 64.3% in 2025. Synthetic ligand chemistries remain dominant due to their established performance profiles, cost structure advantages, and broad commercial availability. Buyers often prioritize predictable stability, compatibility, and consistent agronomic response, which favors incumbent ligand systems. At the same time, sustainability pressures and product differentiation strategies are supporting gradual adoption of biodegradable ligand alternatives in select programs.
Chelated Iron Agriculture Micronutrient Market Drivers
Structural iron unavailability in many agricultural soils
Chelated iron demand increases where soils restrict iron uptake and trigger chlorosis risks that reduce photosynthetic efficiency and crop vigor. Alkaline and calcareous soil conditions are particularly associated with persistent micronutrient availability constraints, which elevates the role of stabilized iron nutrition. Growers adopt chelated forms to improve uptake efficiency and reduce yield and quality variability tied to deficiency events. These dynamics are reinforced when production systems move toward higher intensity, tighter crop schedules, and greater reliance on predictable nutrient delivery.
- For instance, BASF’s Sequestrene 138 Fe is formulated with 6% chelated iron derived from EDDHA and is labeled as effective in soils with pH 7.0 and above, including alkaline and calcareous soils where iron chlorosis is commonly observed.
Expansion of high-value horticulture and quality-focused production
Rising cultivation of fruits, vegetables, and quality-sensitive crops increases the willingness to invest in premium micronutrient programs. Chelated iron supports coloration, canopy health, and uniform development, which can influence grade outcomes and marketability in many horticultural supply chains. In export- and retail-grade systems, nutrient-management precision becomes more closely linked to revenue outcomes. This environment favors chelated inputs that offer consistent performance and can be supported with technical advisory services.
Growth of fertigation, precision irrigation, and soluble nutrition programs
The spread of drip irrigation and precision nutrient delivery increases demand for products that remain soluble, stable, and compatible with irrigation systems. Chelated iron is often selected where precipitation risk, emitter clogging concerns, or variable water chemistry complicate micronutrient delivery. As growers adopt more data-driven fertigation schedules, micronutrients are increasingly dosed in smaller, controlled increments. This supports repeat usage and strengthens demand for chelated forms that integrate cleanly into routine irrigation-driven nutrition.
Product differentiation through ligand chemistry and formulation performance
Suppliers compete on stability, crop fit, and the ability to perform across different soil and water conditions. Innovation in ligand systems and formulation design supports better performance consistency and easier use in complex nutrition programs. Buyers respond to products that reduce management complexity, improve compatibility with other inputs, and deliver reliable visual and agronomic outcomes. These drivers collectively support market expansion and premiumization across distribution channels.
- For instance, Van Iperen states that Iron-EDDHA protects iron against precipitation up to pH 9 and HBED up to pH 12, with its top-grade Iron-EDDHA guaranteeing 4.8% ortho-ortho content, while Fertenia’s FERLAND line offers 6% EDDHA chelates with ortho-ortho levels ranging from 3.4% to 5.0% across product variants.
Chelated Iron Agriculture Micronutrient Market Challenges
Cost sensitivity remains a recurring constraint, particularly for broad-acre cropping and regions with lower input intensity. Chelated iron products can carry higher unit costs than non-chelated alternatives, making adoption dependent on clear deficiency risk, crop value, and agronomic advisory influence. In some markets, inconsistent awareness of micronutrient deficiency diagnostics can also limit proactive adoption. Additionally, product selection complexity ligand type, application method, and timing can create variability in outcomes when technical guidance is limited.
- For instance, Haifa Group's HaiFer™ Fe-EDDHA product line delivers 6% total iron with ortho-ortho chelated fractions that vary from 4.8% (HaiFer™ 48) to 5.5% (HaiFer™ 55) across product grades, illustrating how even within a single supplier's portfolio, selecting the incorrect ortho-ortho fraction for prevailing soil pH conditions can meaningfully undermine agronomic outcomes.
Regulatory and environmental scrutiny can also influence portfolio availability and reformulation priorities, especially where concerns exist around persistence or runoff impacts. Suppliers must balance performance, sustainability positioning, and compliance requirements while maintaining cost competitiveness. Logistics and channel fragmentation further complicate consistent market access in some developing regions. These factors can slow penetration despite strong underlying agronomic need.
Chelated Iron Agriculture Micronutrient Market Trends and Opportunities
One key trend is the shift toward integrated, program-based crop nutrition, where micronutrients are packaged with water-soluble fertilizers and delivered via standardized recommendations. This increases repeatability of dosing and strengthens demand for products that are easy to handle, mix, and apply in routine schedules. Suppliers that provide crop- and soil-specific advisory support can improve buyer confidence and reduce perceived complexity. As agronomic service models mature, chelated iron products are increasingly positioned as part of measurable crop performance programs.
- For instance, YaraTera Rexolin APN combines Fe 6.0%, Mn 2.4%, Zn 1.3%, Cu 0.25%, B 0.85%, and Mo 0.25% in a single microgranule, and Yara recommends continuous iron levels of 15 μmol/L Fe (0.8 mg/L) for hydroponic vegetable crops and 25-35 μmol/L Fe (1.4-2.0 mg/L) for flower crops, showing how chelated iron is being embedded into standardized, crop-specific nutrition programs.
Another opportunity is expanding adoption of biodegradable ligand systems in sustainability-sensitive channels and high-intensity production systems. Differentiation is emerging around environmental profile, residue considerations, and compatibility with stewardship requirements. Controlled-environment agriculture and hydroponic operations also offer premium opportunities because they require consistent solubility and tight nutrient control. These segments can support higher-margin products and longer-term customer relationships through technical support and tailored formulations.
Regional Insights
North America
North America represented 27.6% of the market in 2025, supported by established specialty crop nutrition practices and mature input distribution. Precision agriculture and structured agronomy programs encourage adoption of chelated micronutrients where deficiency risks affect crop quality and uniformity. Strong dealer networks and technical advisory services support consistent product placement across farms. Demand is also reinforced by increasing use of drip irrigation and soluble nutrition programs in high-value crop systems.
Europe
Europe accounted for 22.9% of revenue in 2025, underpinned by intensive horticulture and quality-driven production standards in many countries. Nutrition programs often emphasize product reliability, compliance alignment, and crop-specific performance, supporting demand for stable chelated iron solutions. Sustainability expectations and regulatory frameworks can increase interest in differentiated ligand systems and stewardship-oriented formulations. Protected cultivation in select markets further strengthens demand for precise, water-compatible chelated inputs.
Asia Pacific
Asia Pacific led with a 31.4% share in 2025, reflecting expanding adoption of specialty fertilizers, accelerating horticulture intensity, and modernization of irrigation and fertigation practices. Rapid growth in greenhouse farming and nutrition-managed cropping supports demand for stable, soluble chelated iron products. Diverse farming structures create uneven adoption, but premium programs typically scale fastest in organized supply chains. Suppliers that tailor crop- and country-specific recommendations can expand penetration across varied agronomic contexts.
Latin America
Latin America held 10.8% share in 2025, supported by export-oriented fruit production and plantation agriculture where nutrient management is closely tied to quality outcomes. Adoption is strongest in professionalized operations with access to technical advice and precision irrigation. However, variability in farm structure and input affordability can limit broader uptake in some areas. Growth is supported where fertigation expands and growers seek more consistent correction of micronutrient constraints.
Middle East & Africa
Middle East & Africa represented 7.3% of the market in 2025, with demand concentrated in intensive farming pockets and controlled-environment production. Alkaline soil conditions and water constraints in parts of the region can increase the agronomic value of chelated nutrition programs. Greenhouse expansion supports usage of stable, water-soluble micronutrients in precision delivery systems. Wider adoption remains constrained by affordability and uneven distribution coverage outside commercial production hubs.
Competitive Landscape
Competition centers on ligand chemistry performance, formulation stability, and application compatibility across soil, foliar, fertigation, and hydroponic use cases. Suppliers differentiate through portfolio breadth, distribution reach, agronomic advisory support, and integration into broader water-soluble fertilizer programs. Product positioning frequently emphasizes stability under challenging soil and water conditions, consistency of crop response, and ease of adoption within existing farm routines. Strategic focus often includes strengthening specialty nutrition portfolios, enhancing technical service capabilities, and building channel partnerships in high-growth regions.
Yara International ASA typically competes through integrated crop nutrition positioning, combining micronutrient offerings with broader fertilizer and advisory frameworks to support program-based adoption. The company’s approach tends to emphasize agronomy-led product placement, technical guidance around deficiency correction, and alignment with yield-and-quality outcomes in value-sensitive cropping systems. Portfolio integration with water-soluble and specialty programs supports cross-selling and recurring demand. This positioning can be particularly effective in regions where growers rely on structured recommendations and consistent nutrient delivery routines.
The industry research and growth report includes detailed analyses of the competitive landscape of the market and information about key companies, including:
- Yara International ASA
- BASF SE
- Haifa Group
- Nouryon Holding B.V.
- Syngenta Group
- The Mosaic Company
- Nufarm Limited
- Coromandel International Limited
- AkzoNobel N.V.
- Valagro S.p.A.
Qualitative and quantitative analysis of companies has been conducted to help clients understand the wider business environment as well as the strengths and weaknesses of key industry players. Data is qualitatively analyzed to categorize companies as pure play, category-focused, industry-focused, and diversified; it is quantitatively analyzed to categorize companies as dominant, leading, strong, tentative, and weak.
Recent Developments
- In October 2025, Shijiazhuang Han Hao Trade Co., Ltd. introduced the EDDHA Fe 6% Organic Chelated Iron Fertilizer, leveraging advanced chelation technology to ensure optimal iron availability for plants across a wide pH range. The product targets iron-deficient soils, particularly alkaline and calcareous soils where free iron is typically unavailable to plants. This launch reflects growing demand from Asian agricultural markets for high-performance, pH-stable chelated iron inputs.
- In October 2025, Nouryon actively promoted its HBED chelated iron product, distinguishing it as the only iron chelate worldwide featuring 100% ortho-ortho bonding, which makes iron fully bioavailable to plants. The company highlighted that HBED delivers more iron for plant uptake at lower dose rates compared to other iron fertilizers, reducing cost per hectare and environmental impact. HBED is a patented technology exclusively produced by Nouryon, with no competing supplier globally able to offer this specific iron chelate chemistry.
- In January 2025, Syngenta and Intrinsyx Bio announced a strategic collaboration to develop biological solutions that enhance nutrient uptake efficiency, specifically including iron, in greenhouse crops. The partnership focuses on co-developing microbial endophytes that synergize with chelated iron, extending root uptake efficiency and improving overall plant nutrition outcomes. This collaboration represents a broader industry trend of merging agritech innovation with traditional micronutrient expertise
Report Scope
| Report Attribute | Details |
| Market size value in 2025 | USD 65.23 million |
| Revenue forecast in 2032 | USD 101 million |
| Growth rate (CAGR) | 6.5% (2025–2032) |
| Base year | 2025 |
| Forecast period | 2026-2032 |
| Quantitative units | USD million |
| Segments covered | By Product Type Outlook: EDTA Chelates, DTPA Chelates, EDDHA Chelates, Other Chelated Iron Forms; By Crop Type Outlook: Cereals & Grains, Fruits & Vegetables, Oilseeds & Pulses, Other Crops; By Application Outlook: Soil Application, Foliar Spray, Fertigation, Hydroponic Use; By Source Outlook: Synthetic Ligands, Biodegradable Ligands |
| Regional scope | North America, Europe, Asia Pacific, Latin America, Middle East & Africa |
| Key companies profiled | Yara International ASA, BASF SE, Haifa Group, Nouryon Holding B.V., Syngenta Group, The Mosaic Company, Nufarm Limited, Coromandel International Limited, AkzoNobel N.V., Valagro S.p.A. |
| No. of Pages | 330 |
Segmentation
By Product Type
- EDTA Chelates
- DTPA Chelates
- EDDHA Chelates
- Other Chelated Iron Forms
By Crop Type
- Cereals & Grains
- Fruits & Vegetables
- Oilseeds & Pulses
- Other Crops
By Application
- Soil Application
- Foliar Spray
- Fertigation
- Hydroponic Use
By Source
- Synthetic Ligands
- Biodegradable Ligands
By Region
- North America
- U.S.
- Canada
- Mexico
- Europe
- Germany
- France
- U.K.
- Italy
- Spain
- Rest of Europe
- Asia Pacific
- China
- Japan
- India
- South Korea
- South-east Asia
- Rest of Asia Pacific
- Latin America
- Brazil
- Argentina
- Rest of Latin America
- Middle East & Africa
- GCC Countries
- South Africa
- Rest of the Middle East and Africa
Request a Free Sample
Fill in your details and we'll send you a free sample report.
- Sample data tables & charts
- Research methodology
Need a Custom Version of This Report?
Tailor the scope, geography, or segments to your exact requirements.
- Custom geography or segment scope
- Direct access to our analyst team
Frequently Asked Questions
What is the market size and forecast for the Chelated Iron Agriculture Micronutrient Market?
What is the growth rate (CAGR) for 2025–2032?
Which segment is the largest in the market?
What are the key factors driving market growth?
Which companies are leading in the competitive landscape?
Which region leads the market?
Table of Content
Chapter 1. Report Introduction
- 1.1 Report Description & Purpose
- 1.1.1 Report Title & Market Definition
- 1.1.2 Unique Selling Propositions (USP) & Key Differentiators
- 1.1.3 Value Proposition for Stakeholders
- 1.2 Research Objectives
- 1.2.1 Market Sizing Objectives (Volume & Revenue)
- 1.2.2 Segmentation Objectives
- 1.2.3 Competitive Intelligence Objectives
- 1.2.4 Forecast & Scenario Objectives
- 1.3 Report Scope
- 1.3.1 Chelated Iron Agriculture Micronutrient Scope – Types & Subtypes Covered
- 1.3.2 Geographic Scope – Regions & Countries Covered
- 1.3.3 Historical Period, Base Year & Forecast Period (2025; forecast to 2032)
- 1.3.4 Inclusions & Exclusions
- 1.4 HS Code & Classification Framework
- 1.5 Currency, Units & Pricing Basis
- 1.6 Target Stakeholders
- 1.7 Limitations & Assumptions
Chapter 2. Executive Summary
- 2.1 Global Chelated Iron Agriculture Micronutrient Market Snapshot
- 2.1.1 Market Size – Historical (2025) & Forecast (2025-2032) (2025: USD 65.23 million → 2032: USD 101 million)
- 2.1.2 Volume & Revenue – Global Totals
- 2.1.3 Key Market Highlights – Top Five Facts
- 2.2 Chelated Iron Agriculture Micronutrient Market Segmentation Snapshot
- 2.2.1 Market Split by Region – 2025 vs. 2032
- 2.3 Competitive Snapshot
- 2.3.1 Top 10 Players by Revenue Share – 2025
- 2.3.2 Top 10 Players by Volume Share – 2025
- 2.3.3 Recent Strategic Developments (18-Month Summary)
- 2.4 Key Investment Highlights & Strategic Conclusions
Chapter 3. Chelated Iron Agriculture Micronutrient Market Dynamics & Industry Analysis
- 3.1 Market Overview & Context
- 3.1.1 Chelated Iron Agriculture Micronutrient Market Position in the Broader Automotive Value Chain
- 3.1.2 OEM vs. Replacement Market Dynamics
- 3.1.3 Market Maturity & Development Stage by Region
- 3.2 Chelated Iron Agriculture Micronutrient Market Drivers
- 3.3 Chelated Iron Agriculture Micronutrient Market Restraints & Challenges
- 3.4 Chelated Iron Agriculture Micronutrient Market Opportunities
- 3.5 Porter's Five Forces Analysis
- 3.5.1 Threat of New Entrants
- 3.5.2 Bargaining Power of Suppliers
- 3.5.3 Bargaining Power of Buyers
- 3.5.4 Threat of Substitutes
- 3.5.5 Competitive Rivalry – Intensity Assessment
- 3.6 Chelated Iron Agriculture Micronutrient Value Chain Analysis
- 3.6.1 Upstream – Raw Material/Input Suppliers
- 3.6.1.1 Raw Material/Input 1
- 3.6.1.2 Raw Material/Input 2
- 3.6.1.3 Raw Material/Input 3
- 3.6.2 Midstream – Production/Manufacturing/Service Delivery
- 3.6.2.1 Production/Process Overview
- 3.6.2.2 Key Facility Locations & Capacity by Manufacturer
- 3.6.3 Downstream – Distribution & End Consumer
- 3.6.3.1 Primary Channel – B2B/OEM
- 3.6.3.2 Secondary Channels – Dealer, Retail, Online, Direct
- 3.6.4 Value Chain Profitability Analysis
- 3.6.1 Upstream – Raw Material/Input Suppliers
- 3.7 PESTEL Analysis
- 3.7.1 Political Factors
- 3.7.2 Economic Factors
- 3.7.3 Social Factors
- 3.7.4 Technological Factors
- 3.7.5 Environmental Factors
- 3.7.6 Legal Factors
- 3.8 Chelated Iron Agriculture Micronutrient Supply Chain Analysis
- 3.8.1 Raw Material/Input Supply Risk Assessment
- 3.8.2 Manufacturing Concentration Risk (Geographic Exposure)
- 3.8.3 Trade Disruption Impact Analysis
- 3.9 Regulatory & Policy Landscape
Note: The regulatory and policy landscape section covers regulations based on their applicability to the market, Chelated Iron Agriculture Micronutrient category, geography, and scope of the study. Only regulatory frameworks with a material impact on operations, compliance, trade, sustainability, or market access are analyzed in detail.
Chapter 4. Key Investment Pockets & Opportunity Analysis
- 4.1 Chelated Iron Agriculture Micronutrient Market Attractiveness Analysis
- 4.1.1 By Region – Investment Attractiveness Matrix (Volume × CAGR)
- 4.2 Absolute Revenue Growth Opportunity
- 4.2.1 By Region – Absolute USD Growth Through 2032
- 4.3 Incremental Volume Opportunity
- 4.3.1 By Region – Incremental Volume Through 2032
- 4.3.2 Segment – Incremental Volume
- 4.4 Emerging Submarket Opportunity Deep Dive (Subject to Applicability)
- 4.5 Emerging Market Opportunity Scorecards
- 4.5.1 United States
- 4.5.2 Europe
- 4.5.3 Asia
- 4.5.4 Middle East & Africa
Note: Emerging Market Opportunity Scorecards will be included based on relevance and strategic importance. Regions listed are indicative and may vary depending on data availability and market dynamics.
Chapter 5. Chelated Iron Agriculture Micronutrient Import-Export Analysis & Trade Flows
- 5.1 Global Trade Overview
- 5.1.1 Global Export Value by Country (2025)
- 5.1.2 Global Export Volume by Country (2025)
- 5.1.3 Global Import Value by Country (2025)
- 5.1.4 Global Import Volume by Country (2025)
- 5.1.5 Net Trade Balance by Country (2025)
- 5.2 Export Analysis – Segment
- 5.2.1 Type 1 (HS Code)
- 5.2.2 Type 2 (HS Code)
- 5.2.3 Type 3 (HS Code)
- 5.2.4 Type 4 (HS Code)
- 5.2.5 Type 5 (HS Code)
- 5.3 Import Analysis – Segment
- 5.3.1 Type 1 (HS Code)
- 5.3.2 Type 2 (HS Code)
- 5.3.3 Type 3 (HS Code)
- 5.3.4 Type 4 (HS Code)
- 5.3.5 Type 5 (HS Code)
- 5.4 Average Unit Trade Prices
- 5.4.1 Average Export Price – Segment & Country
- 5.4.2 Average Import Price – Segment & Source Country
- 5.4.3 Price Trends (2025)
- 5.5 Key Trade Route Analysis
- 5.5.1 Trade Route 1
- 5.5.2 Trade Route 2
- 5.5.3 Trade Route 3
- 5.5.4 Trade Route 4
- 5.5.5 Trade Route 5
- 5.6 Trade Policy Impact Assessment
- 5.6.1 US Anti-Dumping & Section 301 Tariffs
- 5.6.2 EU Customs Union Impact
- 5.6.3 Major Free Trade Agreements
- 5.6.4 USMCA Rules of Origin
Note: Trade policy analysis will be included only where relevant to the Chelated Iron Agriculture Micronutrient market.
Chapter 6. Competitive Landscape & Company Benchmarking
- 6.1 Chelated Iron Agriculture Micronutrient Market Concentration & Structure
- 6.1.1 Herfindahl-Hirschman Index (HHI) – vs. 2025
- 6.1.2 Tier 1, Tier 2 & Tier 3 Market Structure
- 6.1.3 Global, Regional & Local Player Dynamics
- 6.2 Chelated Iron Agriculture Micronutrient Market Share Analysis – 2025
- 6.2.1 Global Revenue Share by Company
- 6.2.2 Global Volume Share by Company
- 6.2.3 Regional Revenue Share
- 6.2.4 Market Share Evolution ( vs. 2025)
- 6.2.5 OEM Segment Share by Company
- 6.2.6 Replacement Segment Share by Company
- 6.3 Production/Delivery Capacity & Facility Analysis
- 6.3.1 Global Installed Capacity
- 6.3.2 Capacity Utilization Rates
- 6.3.3 Production/Output Volume
- 6.3.4 Facility Locations & Capacity Map
- 6.3.5 Planned Capacity Additions
- 6.4 Chelated Iron Agriculture Micronutrient Competitive Benchmarking Matrix
- 6.4.1 Revenue, Volume, CAGR & Profitability Comparison
- 6.4.2 Channel Revenue Mix
- 6.4.3 Geographic Revenue Exposure
- 6.4.4 R&D Intensity
- 6.4.5 Sustainability Maturity
- 6.5 Strategic Developments in Chelated Iron Agriculture Micronutrient (Last 24 Months)
- 6.5.1 Mergers, Acquisitions & Divestments
- 6.5.2 New Chelated Iron Agriculture Micronutrient Launches
- 6.5.3 Facility Expansions
- 6.5.4 Strategic Alliances, Joint Ventures & Partnerships
- 6.5.5 Distribution Expansion & Market Entry
- 6.5.6 Sustainability & ESG Initiatives
- 6.6 Competitive Strategy Mapping
- 6.6.1 Leader, Challenger, Follower & Niche Classification
- 6.6.2 Pricing Strategy Comparison
- 6.6.3 Channel Strategy Matrix
Note: Strategic developments are included based on their materiality and the availability of reliable information.
Chapter 7. Global Chelated Iron Agriculture Micronutrient Market – By Distribution Channel
- 7.1 Segment Overview
- 7.1.1 Volume & Revenue Split by Channel (2025 & 2032)
- 7.1.2 Channel Mix Evolution (2025-2032)
Chapter 8. Regional Market Analysis – Global Overview
- 8.1 Global Regional Overview
- 8.1.1 Regional Volume Share
- 8.1.2 Regional Revenue Share
- 8.1.3 Regional Volume by Region
- 8.1.4 Regional Revenue by Region
- 8.1.5 Regional Forecast Through 2032
- 8.2 Cross-Regional Segment Analysis
- 8.2.1 By Distribution Channel
- 8.2.2 By Brand/Price Tier
Chapter 9. North America Chelated Iron Agriculture Micronutrient Market
- 9.1 United States
- 9.2 Canada
- 9.3 Mexico
Chapter 10. Europe Chelated Iron Agriculture Micronutrient Market
- 10.1 Germany
- 10.2 France
- 10.3 Italy
- 10.4 United Kingdom
- 10.5 Spain
- 10.6 Poland
- 10.7 Russia
- 10.8 Netherlands
- 10.9 Belgium
- 10.10 Sweden
- 10.11 Denmark
- 10.12 Norway
- 10.13 Rest of Europe
Chapter 11. Asia Pacific Chelated Iron Agriculture Micronutrient Market
- 11.1 China
- 11.2 India
- 11.3 Japan
- 11.4 South Korea
- 11.5 Thailand
- 11.6 Indonesia
- 11.7 Vietnam
- 11.8 Malaysia
- 11.9 Australia
- 11.10 Rest of Asia Pacific
Chapter 12. Latin America Chelated Iron Agriculture Micronutrient Market
- 12.1 Brazil
- 12.2 Argentina
- 12.3 Colombia
- 12.4 Chile
- 12.5 Rest of Latin America
Chapter 13. Middle East Chelated Iron Agriculture Micronutrient Market
- 13.1 Saudi Arabia
- 13.2 United Arab Emirates
- 13.3 Turkey
- 13.4 Israel
- 13.5 Iran
- 13.6 Rest of the Middle East
Chapter 14. Africa Chelated Iron Agriculture Micronutrient Market
- 14.1 South Africa
- 14.2 Egypt
- 14.3 Nigeria
- 14.4 Morocco
- 14.5 Rest of Africa
Chapter 15. Chelated Iron Agriculture Micronutrient Company Profiles
- 15.1 [Company 01]
- 15.1.1 Company Overview
- 15.1.2 Key Management Personnel
- 15.1.3 Products & Services Portfolio
- 15.1.4 Financial Performance
- 15.1.5 Key Market Focus & Geographic Presence
- 15.1.6 Recent Developments & Strategic Initiatives
Note: The company profile list is preliminary and may change based on research findings, market developments, data availability, and client requirements.
Chapter 16. Appendices
- Appendix A – List of Abbreviations & Acronyms
- Appendix B – Industry Classification Code Reference – Full Series
- Appendix C – Production & Capacity Data Tables
- Appendix D – End-Use & Demand Base Tables
- Appendix E – Consumption & Replacement Rate Assumptions
- Appendix F – ASP Reference Tables
- Appendix G – Manufacturing & Facility Database
- Appendix H – Import-Export Data Tables
- Appendix I – Regulatory Summary Tables
- Appendix J – Primary Research Participant List (Anonymized)
- Appendix K – Primary Research Questionnaire Framework
- Appendix L – Data Sources & Bibliography
- Appendix M – Market Size Divergence & Source Comparison
Chapter 17. Research Methodology
- 17.1 Research Framework & Philosophy
- 17.2 Secondary Research – Sources, Hierarchy & Data Extraction
- 17.3 Data Modeling – Bottom-Up & Top-Down Market Sizing
- 17.4 Primary Research – Stakeholder Framework, LOI & Sample Sizes
- 17.5 Forecast Methodology – Regression, Scenario & Sensitivity Analysis
- 17.6 Quality Control – Four-Layer Validation Framework
- 17.7 Limitations & Standard Assumptions
- 17.8 Disclaimer
