
Agriculture in Israel Market Overview:
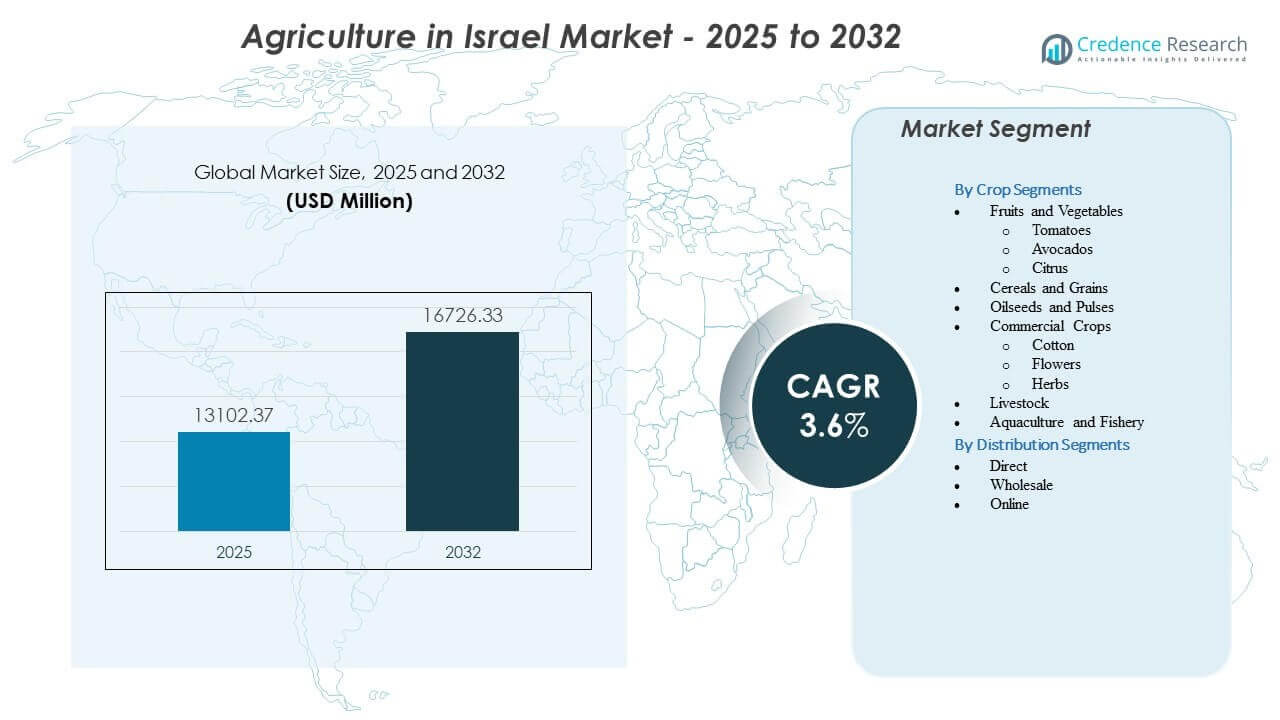
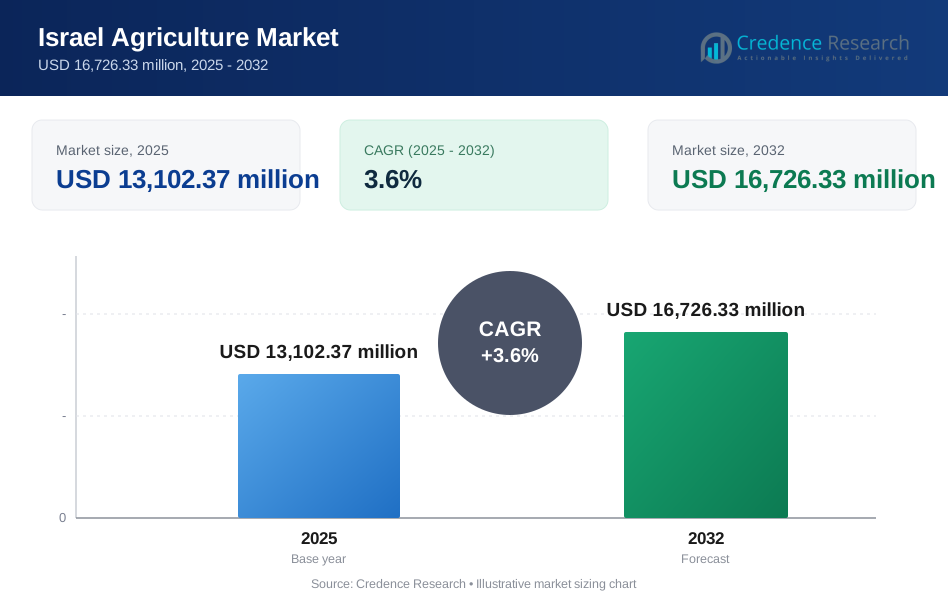
The Israel Agriculture Market is projected to grow from USD 13,102.37 million in 2025 to an estimated USD 16,726.33 million by 2032, with a compound annual growth rate (CAGR) of 3.6% from 2025 to 2032.
| REPORT ATTRIBUTE | DETAILS |
|---|---|
| Historical Period | 2020-2024 |
| Base Year | 2025 |
| Forecast Period | 2026-2032 |
| Agriculture in Israel Market Size 2025 | USD 13,102.37 million |
| Agriculture in Israel Market, CAGR | 3.6% |
| Agriculture in Israel Market Size 2032 | USD 16,726.33 million |
Agriculture in Israel Market Insights:
- Precision irrigation, controlled-environment systems, and digital crop intelligence continue to drive adoption across key production zones, supporting stronger yield stability.
- Rising demand for climate-resilient seeds, biological inputs, and advanced fertilizers strengthens technological investment at the farm level.
- Water scarcity, high infrastructure costs, and land availability constraints remain central restraints that influence long-term growth planning.
- The southern region leads adoption due to large-scale desert agriculture and advanced greenhouse operations that support both domestic and export supply.
- Northern areas maintain strong performance in fruits, vegetables, and dairy through favorable climatic conditions and established farm clusters.
- Central regions expand high-value herbs, flowers, and greenhouse crops, balancing national output while supporting strong domestic distribution networks.
Israel Agriculture Market Drivers
Strong Advancement of Water-Efficient Farming Technologies
Israel invests heavily in water-efficient tools that support crop growth under arid conditions. Irrigation companies expand sensor-based systems that reduce waste and improve water placement accuracy. Farmers rely on recycled water streams that support a large share of nationwide agricultural output. Research centers test membrane filtration units that raise water reuse reliability. Pilot sites deploy precision control valves that regulate flow based on soil feedback. Government programs encourage farms to adopt desalinated water for stable supply. Technology transfer offices help scale innovations to commercial farms. This shift strengthens the Israel Agriculture Market through consistently higher resource efficiency.
- For instance, Netafim’s drip irrigation systems improved water-use efficiency by up to 40% in field trials across southern Israel, while its integrated pressure-compensated emitters maintained uniform discharge across elevation changes, raising yield performance in controlled tests.
Rising Integration of Digital Crop Intelligence and Data Platforms
Farms adopt AI-powered platforms that guide planting windows and fertilizer timing. Satellite maps help growers detect stress zones before visible crop loss occurs. Sensor networks send real-time soil moisture alerts to field teams. Data tools improve yield predictability during volatile climate cycles. Drones deliver field analytics that cut scouting time across large farms. Farmers depend on cloud dashboards to track nutrient balance through each stage. Digital tools raise decision accuracy and help reduce production risks. These advances support strong momentum within the Israel Agriculture Market.
- For instance, CropX Technologies documented a 20% reduction in irrigation volume and an 8% rise in uniformity index after integrating its soil-sensor analytics across 12,000 monitored hectares, improving both sustainability and crop output stability.
Expansion of Government Programs Supporting High-Value Crop Production
Policy frameworks guide farms toward export-driven crops with higher margins. Training centers support growers who shift toward medicinal plants and specialty fruits. Subsidy schemes encourage adoption of protected cultivation structures. Export agencies help farmers meet strict international quality checks. Support programs fund research linked to plant genetics suited for desert climates. Local councils provide shared machinery centers for smaller growers. Grants reduce capital barriers for greenhouse development. This coordinated structure improves growth across the Israel Agriculture Market.
Growing Collaboration Between Research Institutes and Agri-Tech Startups
Innovation hubs link scientists with startup teams that test new biological and digital tools. Field trials help validate enzyme coatings that improve seed vigor under heat pressure. Universities share advanced labs that support rapid testing of nutrient-delivery materials. Partnerships speed up commercialization of robotics designed for fruit handling. Joint research focuses on salinity-tolerant crop breeds for harsh areas. Investors fund incubators that mentor new agri-tech groups working on desert agriculture. Cross-sector alliances raise technology adoption across rural regions. This environment boosts innovation strength within the Israel Agriculture Market.
Israel Agriculture Market Trends
Shift Toward Controlled Environment Agriculture and Climate-Resilient Designs
Growers expand greenhouse clusters that maintain steady yields through climate fluctuations. Climate screens help stabilize temperature during heat waves. LED systems support uniform lighting cycles that reduce energy waste. Hydroponic units raise output per square meter in dense farming zones. Growers deploy vertical stacks for herbs and leafy greens. Automation tools help manage irrigation and nutrient flow inside controlled structures. Farmers seek steady production schedules for export markets. These innovations shape long-term direction in the Israel Agriculture Market.
Rising Use of Biological Inputs and Low-Residue Crop Protection Systems
Producers adopt microbial blends that strengthen plant immunity under tough field conditions. Biological agents help reduce chemical load on sensitive crops. Field trials show strong potential for bio-fungal solutions in protected farming sites. Growers adopt residue-free options to meet strict export protocols. Input companies expand fermentation capacity to meet rising demand. Labs test new bacterial strains for desert-adapted crops. Farmers gain access to improved root inoculants for greenhouse vegetables. These new inputs influence modern cultivation in the Israel Agriculture Market.
- For instance, BioBee Sde Eliyahu Ltd. reported a 60–70% reduction in chemical pesticide use in vegetable and citrus farms after deploying its predatory mites and biological agents, validated through multi-season field adoption studies.
Increasing Adoption of Autonomous Field Equipment and Smart Robotics
Robotic harvesters reduce labor pressure during peak seasons. Guidance systems help tractors maintain accurate path alignment in uneven terrain. Smart sprayers adjust dosage in real time using camera recognition. Startups deploy lightweight robots for orchard monitoring tasks. Automation cuts repetitive manual work across several crop types. Farmers use autonomous weeders that identify harmful plants with high accuracy. Agri-tech firms test robots that pick delicate produce with minimal damage. These tools support next-generation production growth within the Israel Agriculture Market.
- For instance, Taranis demonstrated through audited performance trials that its high-resolution drone scouting system detects pest and nutrient stress at over 95% accuracy, reducing manual field scouting time by more than 75% for large farm operations.
Growing Focus on Export-Oriented Branding and Traceability Systems
Producers integrate QR-based tracking systems for foreign buyers. Digital labels help importers verify product origin and safety data. Certification programs support premium placement in global markets. Cold-chain upgrades maintain produce freshness during long transport routes. Companies strengthen brand identity for niche items such as specialty fruits. Exporters use blockchain to record handling steps across supply partners. Compliance platforms help farms meet rising international standards. These traceability improvements strengthen global competitiveness in the Israel Agriculture Market.
Israel Agriculture Market Challenges Analysis
Water Scarcity Pressures and High Infrastructure Dependence
Water access remains a persistent concern for several growing regions. Farms depend on desalinated sources that require strong capital planning. Rural areas face distribution constraints during peak demand seasons. Infrastructure upgrades extend over long timelines and raise operating costs. Growers must maintain strict control to avoid soil salinization under limited water cycles. Climate change intensifies drought patterns that stress outdoor fields. Desalination energy needs create budget strain for smaller farms. These resource constraints challenge long-term stability in the Israel Agriculture Market.
Rising Input Costs and Global Supply Chain Volatility
Farmers navigate unstable prices for fertilizers, greenhouse materials, and agrochemicals. Global shipping delays affect arrival times for essential farm components. Input fluctuations force frequent changes in production plans. Labor shortages increase wage pressure during harvest seasons. Export supply chains face bottlenecks linked to overseas logistics shifts. Cold-chain expansion requires heavy investment from producers. Imported technologies carry currency-linked risks. These economic barriers influence operational balance in the Israel Agriculture Market.
Israel Agriculture Market Opportunities
Scaling of Agri-Tech Export Solutions and Global Commercial Partnerships
Startups gain rising interest from global markets seeking desert agriculture expertise. Companies license irrigation software that improves yield stability in dry regions. Robotics developers secure pilot programs with foreign greenhouse networks. Export expansion strengthens revenue diversity for tech providers. Government missions support international promotion of local agri-tech innovations. Investors help startups enter new geographies with strong climate constraints. Foreign farms adopt Israeli irrigation models to improve resource efficiency. This momentum builds strong export potential for the Israel Agriculture Market.
Expansion of Climate-Smart Farming and Next-Generation Greenhouse Systems
Growers explore hybrid greenhouse models that integrate AI-driven microclimate tools. Low-energy cooling units help sustain sensitive varieties during heat waves. New materials reduce radiation stress across high-temperature zones. Farms invest in modular units that scale quickly for new crop lines. Automation supports better performance with limited labor supply. Plant breeders create heat-tolerant varieties suited for protected systems. Greenhouse clusters improve long-term production consistency. These advances create fresh opportunity areas within the Israel Agriculture Market.
Market Segmentation Analysis:
By Crop Segment
Crop diversity shapes the structure of the Israel Agriculture Market, with fruits and vegetables leading due to strong export links and climate-adapted production systems. Tomatoes, avocados, and citrus maintain steady output under protected cultivation and precision irrigation. Cereals and grains support domestic food security despite land and water limits that guide selective planting. Oilseeds and pulses gain relevance through soil-improving rotation cycles and rising interest in plant-based nutrition. Commercial crops such as cotton, flowers, and herbs strengthen export revenue through controlled-environment farming and strict quality protocols. Livestock contributes stable dairy and protein supply using advanced herd management tools. Aquaculture expands through recirculating systems that reduce water use and support consistent protein production. These categories together create a balanced foundation for national agricultural resilience and long-term productivity.
- For instance, Afimilk Ltd. reported that farms using its AfiFarm monitoring system achieved a documented 7–10% increase in milk yield after adopting automated health and fertility alerts, reinforcing productivity across livestock segments.
By Distribution Segment
Distribution strategies influence market reach in the Israel Agriculture Market, with direct, wholesale, and online channels serving different buyer groups. Direct distribution helps farms secure better margins through strong partnerships with retailers and institutional buyers who prioritize traceability and predictable quality. Wholesale networks manage large-volume movement from farms to domestic and export markets using cold-chain systems that protect perishable produce. Online distribution grows rapidly as consumers prefer digital access to fresh, organic, and specialty items supported by subscription-based delivery models. Farmers use digital tools to improve logistics, payment flow, and customer visibility. Each channel supports segment-specific demand patterns linked to urban growth, export expectations, and seasonal supply shifts. Together, these routes strengthen national supply chain efficiency and improve access to high-quality agricultural products.
- For instance, Phytech documented that farms using its plant-sensor platform reduced irrigation deviations by 15% and improved fruit size uniformity across export orchards, strengthening reliability within direct and wholesale supply chains.
Segmentation:
By Crop Segments
- Fruits and Vegetables
- Tomatoes
- Avocados
- Citrus
- Cereals and Grains
- Oilseeds and Pulses
- Commercial Crops
- Cotton
- Flowers
- Herbs
- Livestock
- Aquaculture and Fishery
By Distribution Segments
- Direct
- Wholesale
- Online
Regional Analysis:
The northern region holds an estimated 34% share of the Israel Agriculture Market, supported by favorable climate and strong water availability. Galilee and the Golan Heights maintain high output of fruits, vegetables, and dairy products. Higher rainfall reduces irrigation pressure compared with southern zones. Vineyards, orchards, and open-field vegetables remain key contributors. Farmers adopt integrated pest management to maintain crop quality in mixed terrains. Export-oriented producers depend on well-developed packaging and logistics hubs located in the region.
The central region accounts for roughly 29% of national agricultural output, driven by greenhouse clusters, protected cultivation, herbs, and floriculture. The coastal plain supports intensive horticulture that relies on automation and hydroponic systems. High-tech greenhouses improve productivity across herbs, specialty vegetables, and flowers. Urban proximity strengthens direct sales channels and contract farming with retail chains. Growers focus on residue control to meet export requirements. This region supports the evolving structure of the Israel Agriculture Market through innovation-led production models.
The southern region, including the Negev and the Arava, holds close to 37% share, reflecting its dominance in desert agriculture and advanced irrigation deployment. Farmers use precision drip systems and climate-controlled cultivation to overcome harsh weather and low rainfall. Date production, tomatoes, and specialty vegetables thrive under protected environments. Water recycling and desalinated supply networks support scale expansion. Research centers in the region guide adoption of climate-resilient varieties. Strong export orientation strengthens the region’s strategic importance.
Key Player Analysis:
- Netafim (Orbia Group)
- Haifa Group
- ADAMA Agricultural Solutions Ltd.
- ICL Group
- BioBee Sde Eliyahu Ltd.
- Evogene Ltd.
- CropX Technologies
- Rivulis Irrigation
- Phytech
- Taranis
- Afimilk Ltd.
- Hishtil
Competitive Analysis:
Competition in the Israel Agriculture Market is driven by technology providers, greenhouse developers, irrigation companies, agri-tech startups, and integrated farming groups. Firms strengthen their position through advanced irrigation tools that improve water efficiency under arid conditions. Technology developers invest in AI-based systems that monitor soil, climate, and crop stress levels to support yield stability. Greenhouse solution providers supply turnkey structures that meet strict export standards. Equipment manufacturers expand their portfolios toward precision tools that guide nutrient and moisture control. Input suppliers compete through specialized seeds, biological agents, and controlled-environment formulations that fit desert farming. Agri-tech startups gain traction through automation, robotics, and digital platforms that help producers manage labor gaps and production risk. Export-focused growers differentiate through quality certification, traceability, and strict compliance with international standards. This structure pushes firms to strengthen innovation pipelines and maintain consistent field performance.
Recent Developments:
- In December 2025, ATGC Biotech Pvt. Ltd. of India and Luxembourg Industries Ltd. of Israel launched Semiophore Ltd., a 50-50 joint venture for manufacturing semiochemical crop protection technologies. Announced at the First International Science & Technology Clusters Conference in New Delhi, this partnership marks the first production of Indian semiochemical tech in Israel, building on prior Indo-Israel agricultural programs.
- In September 2025, CropX Technologies, an Israeli agtech firm, acquired Acclym (formerly Agritask) to expand its digital farm management platform for global food and beverage enterprises. This marks CropX's seventh acquisition, integrating Acclym's agricultural intelligence solutions used by clients like AB InBev and Nestlé to advance sustainability and regenerative agriculture.
- In October 2024, Netafim, part of Orbia's Precision Agriculture business, announced a strategic partnership with Phytech to integrate real-time plant monitoring into its GrowSphere irrigation system, enhancing precision farming for crops worldwide.
- In October 2024, Phytech partnered with Orbia Netafim to embed its plant-based irrigation recommendations into GrowSphere, enabling farmers to optimize water use and achieve sustainable digital transformation.
Report Coverage:
The research report offers an in-depth analysis based on Crop Segments and Distribution Segments. It details leading market players, providing an overview of their business, product offerings, investments, revenue streams, and key applications. Additionally, the report includes insights into the competitive environment, SWOT analysis, current market trends, as well as the primary drivers and constraints. Furthermore, it discusses various factors that have driven market expansion in recent years. The report also explores market dynamics, regulatory scenarios, and technological advancements that are shaping the industry. It assesses the impact of external factors and global economic changes on market growth. Lastly, it provides strategic recommendations for new entrants and established companies to navigate the complexities of the market.
Future Outlook:
- The Israel Agriculture Market is set to strengthen its position through wider deployment of precision irrigation tools that improve crop stability across diverse climates.
- High-tech greenhouse expansion will deepen across central and southern regions, supporting premium fruits, herbs, and floriculture exports.
- Digital platforms will gain broader adoption, allowing farms to automate field monitoring and enhance crop decision accuracy.
- Biological inputs will see stronger uptake as growers focus on residue control and export compliance.
- Aquaculture will expand through advanced recirculating systems that raise protein output with lower water use.
- Seed and biotech innovation will accelerate through industry–research partnerships targeting drought and salinity resilience.
- Traceability tools will grow across all distribution channels to meet strict quality validation for global buyers.
- Online sales platforms will expand reach for specialty produce and organic categories.
- Desert agriculture zones will secure greater investment, strengthening national food resilience.
- Technology providers and irrigation leaders will shape long-term competitiveness through integrated farm management systems.
Request a Free Sample
Fill in your details and we'll send you a free sample report.
- Sample data tables & charts
- Research methodology
Need a Custom Version of This Report?
Tailor the scope, geography, or segments to your exact requirements.
- Custom geography or segment scope
- Direct access to our analyst team
Frequently Asked Questions
What is the current market size for the Agriculture in Israel Market, and what is its projected size in 2032?
At what Compound Annual Growth Rate is the Agriculture in Israel Market projected to grow between 2025 and 2032?
Which Agriculture in Israel Market segment held the largest share in 2025?
What are the primary factors fueling the growth of the Agriculture in Israel Market?
Who are the leading companies in the Agriculture in Israel Market?
Which region commanded the largest share of the Agriculture in Israel Market in 2025?
Table of Content
Chapter 1. Report Introduction
- 1.1 Report Description & Purpose
- 1.1.1 Report Title & Market Definition
- 1.1.2 Unique Selling Propositions (USP) & Key Differentiators
- 1.1.3 Value Proposition for Stakeholders
- 1.2 Research Objectives
- 1.2.1 Market Sizing Objectives (Volume & Revenue)
- 1.2.2 Segmentation Objectives
- 1.2.3 Competitive Intelligence Objectives
- 1.2.4 Forecast & Scenario Objectives
- 1.3 Report Scope
- 1.3.1 Israel Agriculture Scope – Types & Subtypes Covered
- 1.3.2 Geographic Scope – Regions & Countries Covered
- 1.3.3 Historical Period, Base Year & Forecast Period (2025; forecast to 2032)
- 1.3.4 Inclusions & Exclusions
- 1.4 HS Code & Classification Framework
- 1.5 Currency, Units & Pricing Basis
- 1.6 Target Stakeholders
- 1.7 Limitations & Assumptions
Chapter 2. Executive Summary
- 2.1 Global Israel Agriculture Market Snapshot
- 2.1.1 Market Size – Historical (2025) & Forecast (2025-2032) (2025: USD 13,102.37 million → 2032: USD 16,726.33 million)
- 2.1.2 Volume & Revenue – Global Totals
- 2.1.3 Key Market Highlights – Top Five Facts
- 2.2 Israel Agriculture Market Segmentation Snapshot
- 2.2.1 Market Split by Region – 2025 vs. 2032
- 2.3 Competitive Snapshot
- 2.3.1 Top 10 Players by Revenue Share – 2025
- 2.3.2 Top 10 Players by Volume Share – 2025
- 2.3.3 Recent Strategic Developments (18-Month Summary)
- 2.4 Key Investment Highlights & Strategic Conclusions
Chapter 3. Israel Agriculture Market Dynamics & Industry Analysis
- 3.1 Market Overview & Context
- 3.1.1 Israel Agriculture Market Position in the Broader Automotive Value Chain
- 3.1.2 OEM vs. Replacement Market Dynamics
- 3.1.3 Market Maturity & Development Stage by Region
- 3.2 Israel Agriculture Market Drivers
- 3.3 Israel Agriculture Market Restraints & Challenges
- 3.4 Israel Agriculture Market Opportunities
- 3.5 Porter's Five Forces Analysis
- 3.5.1 Threat of New Entrants
- 3.5.2 Bargaining Power of Suppliers
- 3.5.3 Bargaining Power of Buyers
- 3.5.4 Threat of Substitutes
- 3.5.5 Competitive Rivalry – Intensity Assessment
- 3.6 Israel Agriculture Value Chain Analysis
- 3.6.1 Upstream – Raw Material/Input Suppliers
- 3.6.1.1 Raw Material/Input 1
- 3.6.1.2 Raw Material/Input 2
- 3.6.1.3 Raw Material/Input 3
- 3.6.2 Midstream – Production/Manufacturing/Service Delivery
- 3.6.2.1 Production/Process Overview
- 3.6.2.2 Key Facility Locations & Capacity by Manufacturer
- 3.6.3 Downstream – Distribution & End Consumer
- 3.6.3.1 Primary Channel – B2B/OEM
- 3.6.3.2 Secondary Channels – Dealer, Retail, Online, Direct
- 3.6.4 Value Chain Profitability Analysis
- 3.6.1 Upstream – Raw Material/Input Suppliers
- 3.7 PESTEL Analysis
- 3.7.1 Political Factors
- 3.7.2 Economic Factors
- 3.7.3 Social Factors
- 3.7.4 Technological Factors
- 3.7.5 Environmental Factors
- 3.7.6 Legal Factors
- 3.8 Israel Agriculture Supply Chain Analysis
- 3.8.1 Raw Material/Input Supply Risk Assessment
- 3.8.2 Manufacturing Concentration Risk (Geographic Exposure)
- 3.8.3 Trade Disruption Impact Analysis
- 3.9 Regulatory & Policy Landscape
Note: The regulatory and policy landscape section covers regulations based on their applicability to the market, Israel Agriculture category, geography, and scope of the study. Only regulatory frameworks with a material impact on operations, compliance, trade, sustainability, or market access are analyzed in detail.
Chapter 4. Key Investment Pockets & Opportunity Analysis
- 4.1 Israel Agriculture Market Attractiveness Analysis
- 4.1.1 By Region – Investment Attractiveness Matrix (Volume × CAGR)
- 4.2 Absolute Revenue Growth Opportunity
- 4.2.1 By Region – Absolute USD Growth Through 2032
- 4.3 Incremental Volume Opportunity
- 4.3.1 By Region – Incremental Volume Through 2032
- 4.3.2 Segment – Incremental Volume
- 4.4 Emerging Submarket Opportunity Deep Dive (Subject to Applicability)
- 4.5 Emerging Market Opportunity Scorecards
- 4.5.1 United States
- 4.5.2 Europe
- 4.5.3 Asia
- 4.5.4 Middle East & Africa
Note: Emerging Market Opportunity Scorecards will be included based on relevance and strategic importance. Regions listed are indicative and may vary depending on data availability and market dynamics.
Chapter 5. Israel Agriculture Import-Export Analysis & Trade Flows
- 5.1 Global Trade Overview
- 5.1.1 Global Export Value by Country (2025)
- 5.1.2 Global Export Volume by Country (2025)
- 5.1.3 Global Import Value by Country (2025)
- 5.1.4 Global Import Volume by Country (2025)
- 5.1.5 Net Trade Balance by Country (2025)
- 5.2 Export Analysis – Segment
- 5.2.1 Type 1 (HS Code)
- 5.2.2 Type 2 (HS Code)
- 5.2.3 Type 3 (HS Code)
- 5.2.4 Type 4 (HS Code)
- 5.2.5 Type 5 (HS Code)
- 5.3 Import Analysis – Segment
- 5.3.1 Type 1 (HS Code)
- 5.3.2 Type 2 (HS Code)
- 5.3.3 Type 3 (HS Code)
- 5.3.4 Type 4 (HS Code)
- 5.3.5 Type 5 (HS Code)
- 5.4 Average Unit Trade Prices
- 5.4.1 Average Export Price – Segment & Country
- 5.4.2 Average Import Price – Segment & Source Country
- 5.4.3 Price Trends (2025)
- 5.5 Key Trade Route Analysis
- 5.5.1 Trade Route 1
- 5.5.2 Trade Route 2
- 5.5.3 Trade Route 3
- 5.5.4 Trade Route 4
- 5.5.5 Trade Route 5
- 5.6 Trade Policy Impact Assessment
- 5.6.1 US Anti-Dumping & Section 301 Tariffs
- 5.6.2 EU Customs Union Impact
- 5.6.3 Major Free Trade Agreements
- 5.6.4 USMCA Rules of Origin
Note: Trade policy analysis will be included only where relevant to the Israel Agriculture market.
Chapter 6. Competitive Landscape & Company Benchmarking
- 6.1 Israel Agriculture Market Concentration & Structure
- 6.1.1 Herfindahl-Hirschman Index (HHI) – vs. 2025
- 6.1.2 Tier 1, Tier 2 & Tier 3 Market Structure
- 6.1.3 Global, Regional & Local Player Dynamics
- 6.2 Israel Agriculture Market Share Analysis – 2025
- 6.2.1 Global Revenue Share by Company
- 6.2.2 Global Volume Share by Company
- 6.2.3 Regional Revenue Share
- 6.2.4 Market Share Evolution ( vs. 2025)
- 6.2.5 OEM Segment Share by Company
- 6.2.6 Replacement Segment Share by Company
- 6.3 Production/Delivery Capacity & Facility Analysis
- 6.3.1 Global Installed Capacity
- 6.3.2 Capacity Utilization Rates
- 6.3.3 Production/Output Volume
- 6.3.4 Facility Locations & Capacity Map
- 6.3.5 Planned Capacity Additions
- 6.4 Israel Agriculture Competitive Benchmarking Matrix
- 6.4.1 Revenue, Volume, CAGR & Profitability Comparison
- 6.4.2 Channel Revenue Mix
- 6.4.3 Geographic Revenue Exposure
- 6.4.4 R&D Intensity
- 6.4.5 Sustainability Maturity
- 6.5 Strategic Developments in Israel Agriculture (Last 24 Months)
- 6.5.1 Mergers, Acquisitions & Divestments
- 6.5.2 New Israel Agriculture Launches
- 6.5.3 Facility Expansions
- 6.5.4 Strategic Alliances, Joint Ventures & Partnerships
- 6.5.5 Distribution Expansion & Market Entry
- 6.5.6 Sustainability & ESG Initiatives
- 6.6 Competitive Strategy Mapping
- 6.6.1 Leader, Challenger, Follower & Niche Classification
- 6.6.2 Pricing Strategy Comparison
- 6.6.3 Channel Strategy Matrix
Note: Strategic developments are included based on their materiality and the availability of reliable information.
Chapter 7. Global Israel Agriculture Market – By Distribution Channel
- 7.1 Segment Overview
- 7.1.1 Volume & Revenue Split by Channel (2025 & 2032)
- 7.1.2 Channel Mix Evolution (2025-2032)
Chapter 8. Regional Market Analysis – Global Overview
- 8.1 Global Regional Overview
- 8.1.1 Regional Volume Share
- 8.1.2 Regional Revenue Share
- 8.1.3 Regional Volume by Region
- 8.1.4 Regional Revenue by Region
- 8.1.5 Regional Forecast Through 2032
- 8.2 Cross-Regional Segment Analysis
- 8.2.1 By Distribution Channel
- 8.2.2 By Brand/Price Tier
Chapter 9. North America Israel Agriculture Market
- 9.1 United States
- 9.2 Canada
- 9.3 Mexico
Chapter 10. Europe Israel Agriculture Market
- 10.1 Germany
- 10.2 France
- 10.3 Italy
- 10.4 United Kingdom
- 10.5 Spain
- 10.6 Poland
- 10.7 Russia
- 10.8 Netherlands
- 10.9 Belgium
- 10.10 Sweden
- 10.11 Denmark
- 10.12 Norway
- 10.13 Rest of Europe
Chapter 11. Asia Pacific Israel Agriculture Market
- 11.1 China
- 11.2 India
- 11.3 Japan
- 11.4 South Korea
- 11.5 Thailand
- 11.6 Indonesia
- 11.7 Vietnam
- 11.8 Malaysia
- 11.9 Australia
- 11.10 Rest of Asia Pacific
Chapter 12. Latin America Israel Agriculture Market
- 12.1 Brazil
- 12.2 Argentina
- 12.3 Colombia
- 12.4 Chile
- 12.5 Rest of Latin America
Chapter 13. Middle East Israel Agriculture Market
- 13.1 Saudi Arabia
- 13.2 United Arab Emirates
- 13.3 Turkey
- 13.4 Israel
- 13.5 Iran
- 13.6 Rest of the Middle East
Chapter 14. Africa Israel Agriculture Market
- 14.1 South Africa
- 14.2 Egypt
- 14.3 Nigeria
- 14.4 Morocco
- 14.5 Rest of Africa
Chapter 15. Israel Agriculture Company Profiles
- 15.1 [Company 01]
- 15.1.1 Company Overview
- 15.1.2 Key Management Personnel
- 15.1.3 Products & Services Portfolio
- 15.1.4 Financial Performance
- 15.1.5 Key Market Focus & Geographic Presence
- 15.1.6 Recent Developments & Strategic Initiatives
Note: The company profile list is preliminary and may change based on research findings, market developments, data availability, and client requirements.
Chapter 16. Appendices
- Appendix A – List of Abbreviations & Acronyms
- Appendix B – Industry Classification Code Reference – Full Series
- Appendix C – Production & Capacity Data Tables
- Appendix D – End-Use & Demand Base Tables
- Appendix E – Consumption & Replacement Rate Assumptions
- Appendix F – ASP Reference Tables
- Appendix G – Manufacturing & Facility Database
- Appendix H – Import-Export Data Tables
- Appendix I – Regulatory Summary Tables
- Appendix J – Primary Research Participant List (Anonymized)
- Appendix K – Primary Research Questionnaire Framework
- Appendix L – Data Sources & Bibliography
- Appendix M – Market Size Divergence & Source Comparison
Chapter 17. Research Methodology
- 17.1 Research Framework & Philosophy
- 17.2 Secondary Research – Sources, Hierarchy & Data Extraction
- 17.3 Data Modeling – Bottom-Up & Top-Down Market Sizing
- 17.4 Primary Research – Stakeholder Framework, LOI & Sample Sizes
- 17.5 Forecast Methodology – Regression, Scenario & Sensitivity Analysis
- 17.6 Quality Control – Four-Layer Validation Framework
- 17.7 Limitations & Standard Assumptions
- 17.8 Disclaimer
