
Anti-Hyperglycemic Agents Market Overview:
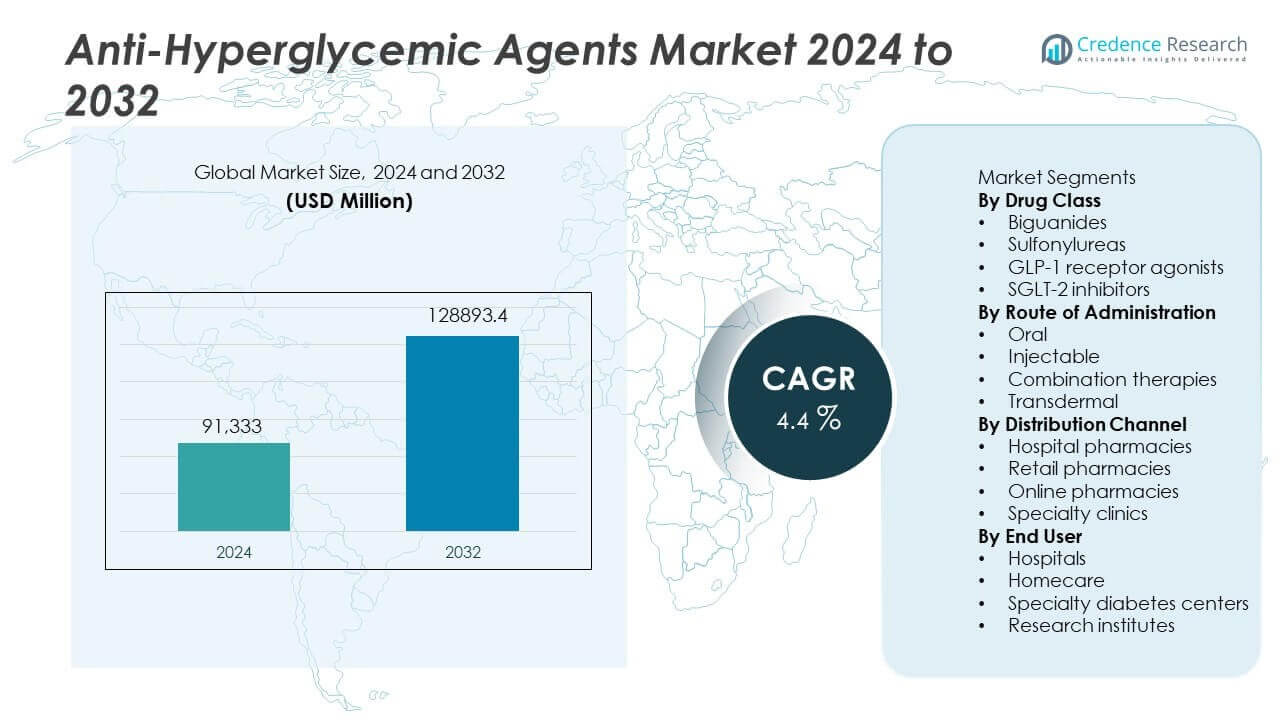
The Anti-Hyperglycemic Agents market size stood at USD 91,333 million in 2024. Analysts expect the market value to rise to USD 128,893.4 million by 2032. The industry is set to grow at a CAGR of 4.4% during the forecast period.
| REPORT ATTRIBUTE | DETAILS |
|---|---|
| Historical Period | 2020-2023 |
| Base Year | 2024 |
| Forecast Period | 2025-2032 |
| Anti-Hyperglycemic Agents Market Size 2024 | USD 91,333 million |
| Anti-Hyperglycemic Agents Market, CAGR | 4.4% |
| Anti-Hyperglycemic Agents Market Size 2032 | USD 128,893.4 million |
Anti-Hyperglycemic Agents Market Insights
- Growing diabetes prevalence and stronger therapy adoption support demand, with biguanides holding a 32% share due to wide clinical use and cost benefits.
- Trends favor GLP-1 and SGLT-2 therapies as patients seek weight support, improved glycemic stability, and fewer side effects, boosting long-term treatment value.
- Leading companies expand portfolios and digital care support, while high drug costs and safety concerns limit uptake, especially in lower-income markets.
- North America leads with a 38% share, followed by Europe at 29% and Asia Pacific at 24%, supported by broad access, rising diagnosis, and expanding retail pharmacy distribution.
Anti-Hyperglycemic Agents Market Segmentation Analysis:
By Drug Class
Biguanides hold the leading share of 32% in the Anti-Hyperglycemic Agents market due to strong demand for metformin-based treatment. The category benefits from high physician trust, low cost, and a well-established safety record. GLP-1 receptor agonists show fast growth as patients and clinicians favor therapies that support weight control and stronger glycemic outcomes. SGLT-2 inhibitors expand on rising prescription rates for renal and cardiovascular protection. Sulfonylureas maintain steady sales in cost-sensitive regions. Continued research activity, wider patient pools, and favorable diabetes guidelines support drug class expansion and boost long-term therapy use.
- For instance, Novo Nordisk showed semaglutide reduced HbA1c from 8.1 to near 6.5 in SUSTAIN-1 with 388 patients.
By Route of Administration
Oral formulations command a dominant 68% share in the Anti-Hyperglycemic Agents market, driven by patient comfort, simpler dosing, and broad availability. Tablets and capsules remain key first-line options for type 2 diabetes care and enable strong adherence. Injectable products gain momentum as GLP-1 treatments record higher prescription volumes. Combination therapies grow as physicians aim to improve glycemic stability and reduce treatment steps. Transdermal formats remain limited but offer future potential for needle-free delivery. Rising diagnosis rates, supportive reimbursement, and continued therapy refinement strengthen the long-term use of oral anti-hyperglycemic agents.
- For instance, Eli Lilly’s tirzepatide lowered HbA1c from 8.28 to near 6.0 in SURPASS-2 with 1,879 participants.
By Distribution Channel
Retail pharmacies lead the Anti-Hyperglycemic Agents market with a 54% share, supported by high prescription turnover, strong community presence, and accessible medication refill services. Hospital pharmacies play a key role in inpatient care, new diabetes case management, and therapy initiation. Online pharmacies show rapid growth as buyers seek home delivery and broader price choices. Specialty clinics drive tailored treatment and support complex therapy plans. Expanding diabetes screening, better insurance coverage, and rising treatment awareness sustain demand across channels and reinforce the dominant position of retail outlets in therapy distribution.
Key Growth Drivers
Rising Diabetes Prevalence
The steady increase in global diabetes cases drives higher demand for anti-hyperglycemic therapies. Growing lifestyle risks, aging demographics, and higher obesity levels expand patient numbers across regions. More people require regular treatment and long-term prescription plans, increasing medication consumption. Healthcare systems improve diagnosis and screening programs, enabling earlier treatment initiation. Governments and private insurers expand reimbursement coverage, supporting patient access and therapy continuity. These factors strengthen market volume and encourage further drug development.
- For instance, Merck reported that sitagliptin maintained a significant HbA1c reduction in a large-scale clinical study, confirming its value in long-term diabetes care.
Advancement in Drug Innovation
New drug classes and improved clinical outcomes support faster market expansion. GLP-1 receptor agonists and SGLT-2 inhibitors offer enhanced weight control, strong glycemic stability, and reduced cardiovascular risk, increasing physician confidence. Longer dosing intervals and fixed-dose combinations help improve adherence and patient satisfaction. Ongoing clinical trials create pathways for broader indications and new therapeutic uses. Strong R&D investments and product launches enhance treatment options and support market competitiveness.
- For instance, AstraZeneca confirmed dapagliflozin reduced hospitalization risk for heart failure by 26 events per 1,000 patient-years in DECLARE-TIMI 58 with 17,160 participants.
Growing Focus on Patient-Centered Care
Healthcare providers increasingly prioritize therapies that improve long-term patient outcomes. Physicians shift toward treatment models that support personalized dosing, multidrug regimens, and patient lifestyle needs. Digital monitoring tools and telemedicine solutions boost adherence and help optimize decision-making. Education programs increase patient engagement and support treatment continuity. These developments improve disease control, reduce complications, and raise therapy penetration, contributing to sustained market growth.
Key Trends & Opportunities
Shift Toward Combination and Advanced Therapies
Combination treatments gain popularity as clinicians seek stronger glycemic performance with fewer side effects. Rapid uptake of GLP-1 and SGLT-2 products demonstrates shifting clinical preference toward advanced therapies. Long-acting formulations improve convenience and reduce dosing frequency, attracting patients seeking simpler regimens. Ongoing research offers new drug pairings that target weight reduction and cardiovascular protection. These innovations provide stronger market appeal and expand commercial opportunity.
- For instance, Novo Nordisk reported that semaglutide significantly reduced HbA1c and achieved substantial mean weight loss in the SUSTAIN-6 trial involving thousands of patients, confirming strong outcomes for advanced GLP-1 therapy.
Expanding Digital and Remote Care Integration
Digital support tools offer new opportunities for therapy personalization and disease tracking. Telehealth models enable regular monitoring and physician follow-up, improving treatment continuity. Patient apps and connected devices enhance glucose reporting and medication reminders. Pharmacists and clinicians also adopt digital tools to streamline dosing adjustments. This trend supports better adherence and treatment success, opening broader avenues for data-driven therapy delivery and value-based outcomes.
- For instance, Roche demonstrated clinical improvements using its Accu-Chek digital health solutions in a large-scale patient evaluation, proving measurable benefits in remote diabetes management.
Key Challenges
High Therapy Costs and Limited Affordability
Innovative anti-hyperglycemic therapies often carry high treatment costs and increase the financial burden on patients and healthcare systems. Pricing barriers restrict adoption of advanced drug classes, especially in low-income and underinsured regions. Some patients switch or discontinue therapy due to cost concerns, limiting long-term disease control. Although reimbursement structures improve access, gaps remain for newer medications. These financial constraints may limit market penetration and slow growth.
Safety Concerns and Side Effect Management
Some anti-hyperglycemic drugs raise safety issues, including risks associated with hypoglycemia, weight gain, and gastrointestinal effects. Physicians often reconsider certain therapies based on patient comorbidities and tolerance levels. Regulatory scrutiny remains strong as safety profiles evolve with real-world data. Side effects can disrupt adherence and reduce therapy persistence, particularly among older patients. These challenges may hinder uptake of selected drug classes and increase the need for careful clinical decision-making.
Regional Analysis
North America
North America leads the Anti-Hyperglycemic Agents market with a 38% share driven by strong adoption of advanced therapies such as GLP-1 receptor agonists and SGLT-2 inhibitors. The region benefits from robust healthcare infrastructure, high diagnosis rates, and growing spending on diabetes treatment. Supportive reimbursement, physician preference for newer drug classes, and strong focus on disease management boost market demand. Patient awareness and ongoing R&D investment also enhance uptake. Expanding obese and aging populations further support long-term therapy use, sustaining the region’s dominant position.
Europe
Europe holds a 29% share of the Anti-Hyperglycemic Agents market due to wide access to standard oral therapies and rising uptake of innovative injectables. Strong national healthcare systems and policy support ease patient access to diabetes care. Increased use of combination drugs and updated clinical guidelines enhance treatment coverage. Growing cardiovascular risk management and expanding elderly demographics fuel prescription demand. The region continues to emphasize safe and cost-effective therapy, strengthening its steady market contribution.
Asia Pacific
Asia Pacific accounts for a 24% share of the Anti-Hyperglycemic Agents market supported by rapid population growth, rising diabetes incidence, and expanding healthcare access. Urbanization, lifestyle shifts, and increasing obesity accelerate treatment needs. Wider insurance enrollment and generic drug availability encourage therapy uptake. Higher investment in retail pharmacy networks and growing digital care channels improve distribution reach. Although pricing sensitivity remains, rising awareness and better diagnosis rates reinforce positive long-term prospects for the region.
Latin America
Latin America holds a 6% share of the Anti-Hyperglycemic Agents market driven by gradually improving access to diabetes care. Urban populations and rising metabolic risk factors expand therapy demand. Public health programs and broader pharmacy penetration improve treatment availability. Economic pressures and affordability challenges limit advanced drug uptake, favoring oral therapies. Education initiatives and screening expansion support future market potential.
Middle East & Africa
The Middle East & Africa region represents a 3% share of the Anti-Hyperglycemic Agents market supported by increasing investment in healthcare infrastructure and stronger chronic disease management programs. Rising obesity and limited physical activity raise diabetes prevalence. Access to advanced treatment remains concentrated in urban centers, while affordability influences therapy selection. Growing private healthcare facilities and wider pharmacy distribution improve patient reach. Awareness programs and early diagnosis efforts support steady, long-term growth.
Anti-Hyperglycemic Agents Market Segmentations:
By Drug Class
- Biguanides
- Sulfonylureas
- GLP-1 receptor agonists
- SGLT-2 inhibitors
By Route of Administration
- Oral
- Injectable
- Combination therapies
- Transdermal
By Distribution Channel
- Hospital pharmacies
- Retail pharmacies
- Online pharmacies
- Specialty clinics
By End User
- Hospitals
- Homecare
- Specialty diabetes centers
- Research institutes
By Geography
- North America
- U.S.
- Canada
- Mexico
- Europe
- Germany
- France
- U.K.
- Italy
- Spain
- Rest of Europe
- Asia Pacific
- China
- Japan
- India
- South Korea
- South-east Asia
- Rest of Asia Pacific
- Latin America
- Brazil
- Argentina
- Rest of Latin America
- Middle East & Africa
- GCC Countries
- South Africa
- Rest of the Middle East and Africa
Competitive Landscape
Competitive landscape analysis shows leading companies such as Novo Nordisk, Eli Lilly and Company, Sanofi, Merck, AstraZeneca, Johnson & Johnson, Boehringer Ingelheim, Takeda, Pfizer, and Bayer driving innovation and commercial strength in the Anti-Hyperglycemic Agents market. Major players expand product portfolios through investments in advanced drug classes, especially GLP-1 and SGLT-2 therapies, to improve outcomes and align with evolving clinical guidelines. Many companies strengthen market positions through strategic partnerships, R&D programs, and continuous product approvals. Increased focus on long-acting injectables, weight management benefits, and cardiovascular protection supports differentiation. Competitive activity also includes emphasis on fixed-dose combinations to improve adherence and extend treatment value. Growing biosimilar entry and price pressure influence commercial strategy, particularly in mature product segments. Companies also enhance patient support programs and digital care platforms to maintain loyalty. Ongoing clinical trials and product innovation continue to shape future competitive dynamics.
Key Player Analysis
- Novo Nordisk
- Eli Lilly and Company
- Sanofi
- Merck & Co., Inc.
- AstraZeneca
- Johnson & Johnson
- Boehringer Ingelheim
- Takeda Pharmaceutical Company
- Pfizer Inc.
- Bayer AG
Recent Developments
- In December 2025, Novo Nordisk is planning to launch Ozempic in India to expand access to its diabetes and weight-loss treatment.
- In December 2025, Eli Lilly and Company and Novo Nordisk submitted new advanced weight-loss/diabetes drugs to the FDA, including Lilly’s orforglipron pill.
- In December 2025, Merck & Co., Inc. also agreed to U.S. pricing deals lowering costs for Merck diabetes drugs including Januvia and Janumet.
Report Coverage
The research report offers an in-depth analysis based on Drug Class, Route of Administration, Distribution Channel, End User and Geography. It details leading market players, providing an overview of their business, product offerings, investments, revenue streams, and key applications. Additionally, the report includes insights into the competitive environment, SWOT analysis, current market trends, as well as the primary drivers and constraints. Furthermore, it discusses various factors that have driven market expansion in recent years. The report also explores market dynamics, regulatory scenarios, and technological advancements that are shaping the industry. It assesses the impact of external factors and global economic changes on market growth. Lastly, it provides strategic recommendations for new entrants and established companies to navigate the complexities of the market.
Future Outlook
- Treatment adoption will rise with growing diabetes awareness and screening.
- New drug classes will gain share as clinical outcomes improve.
- Oral and injectable combinations will support better adherence.
- Digital monitoring and telehealth links will enhance treatment decisions.
- Cardiovascular and renal benefits will drive preference for advanced therapies.
- Biosimilars will expand access in cost-sensitive markets.
- Patient-centric care models will shape dosing and delivery needs.
- Retail and online pharmacies will increase therapy reach.
- Weight-focused therapies will see stronger demand across key regions.
- R&D investment will produce longer-acting and safer treatment options.
Request a Free Sample
Fill in your details and we'll send you a free sample report.
- Sample data tables & charts
- Research methodology
Need a Custom Version of This Report?
Tailor the scope, geography, or segments to your exact requirements.
- Custom geography or segment scope
- Direct access to our analyst team
Frequently Asked Questions
What is the current market size for Anti-Hyperglycemic Agents market, and what is its projected size in 2032?
At what Compound Annual Growth Rate is the Anti-Hyperglycemic Agents market projected to grow between 2024 and 2032?
Which Anti-Hyperglycemic Agents market segment held the largest share in 2024?
What are the primary factors fueling the growth of the Anti-Hyperglycemic Agents market?
Who are the leading companies in the Anti-Hyperglycemic Agents market?
Which region commanded the largest share of the Anti-Hyperglycemic Agents market in 2024?
Table of Content
Chapter 1. Report Introduction
- 1.1 Report Description & Purpose
- 1.1.1 Report Title & Market Definition
- 1.1.2 Unique Selling Propositions (USP) & Key Differentiators
- 1.1.3 Value Proposition for Stakeholders
- 1.2 Research Objectives
- 1.2.1 Market Sizing Objectives (Volume & Revenue) (Volume Where Applicable)
- 1.2.2 Segmentation Objectives
- 1.2.3 Competitive Intelligence Objectives
- 1.2.4 Forecast & Scenario Objectives
- 1.3 Report Scope
- 1.3.1 Anti-Hyperglycemic Agents Scope – Segments & Subsegments Covered
- 1.3.2 Geographic Scope – Regions & Countries Covered
- 1.3.3 Historical Period, Base Year & Forecast Period (2024; forecast to 2032)
- 1.3.4 Inclusions & Exclusions
- 1.4 Industry Classification & Applicable Codes
- 1.5 Currency, Measurement Units & Valuation Basis
- 1.6 Target Stakeholders
- 1.7 Limitations & Assumptions
Chapter 2. Executive Summary
- 2.1 Global Anti-Hyperglycemic Agents Market Snapshot
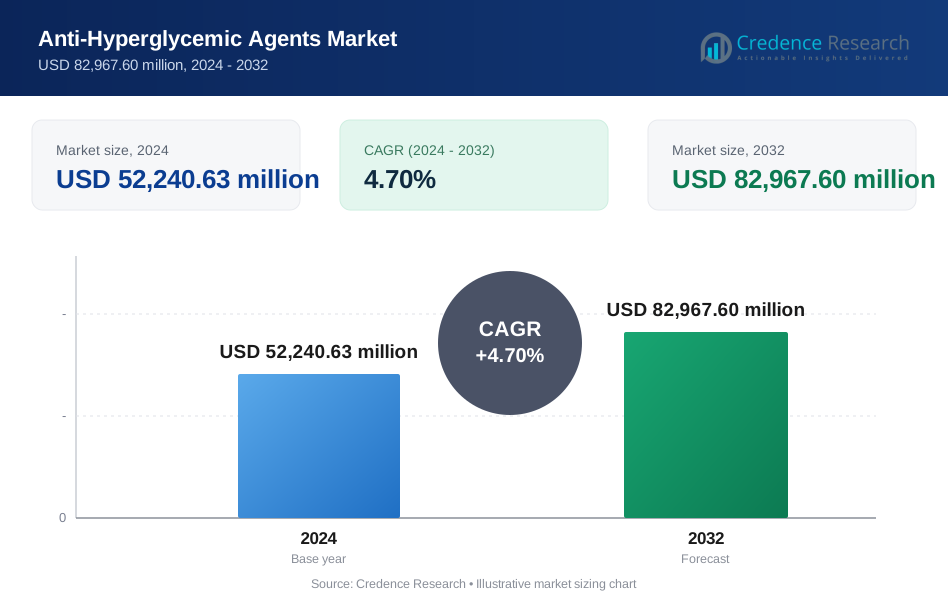
- 2.1.1 Market Size – Historical (2024) & Forecast (2024-2032) (2024: USD 52,240.63 million → 2032: USD 82,967.60 million)
- 2.1.2 Volume & Revenue – Global Totals (Volume Where Applicable)
- 2.1.3 Key Market Highlights – Top Five Facts
- 2.2 Anti-Hyperglycemic Agents Market Segmentation Snapshot
- 2.2.1 Market Split by Region – 2024 vs. 2032
- 2.3 Competitive Snapshot
- 2.3.1 Top 10 Players by Revenue Share – 2024
- 2.3.2 Top 10 Players by Volume Share – 2024 (Volume Where Applicable)
- 2.3.3 Recent Strategic Developments (18-Month Summary)
- 2.4 Key Investment Highlights & Strategic Conclusions
Chapter 3. Anti-Hyperglycemic Agents Market Dynamics & Industry Analysis
- 3.1 Market Overview & Context
- 3.1.1 Anti-Hyperglycemic Agents Market Position in the Broader Industry Value Chain
- 3.1.2 Demand Structure & Purchasing Dynamics
- 3.1.3 Market Maturity & Development Stage by Region
- 3.2 Anti-Hyperglycemic Agents Market Drivers
- 3.3 Anti-Hyperglycemic Agents Market Restraints & Challenges
- 3.4 Anti-Hyperglycemic Agents Market Opportunities
- 3.5 Porter's Five Forces Analysis
- 3.5.1 Threat of New Entrants
- 3.5.2 Bargaining Power of Suppliers
- 3.5.3 Bargaining Power of Buyers
- 3.5.4 Threat of Substitutes
- 3.5.5 Competitive Rivalry – Intensity Assessment
- 3.6 Anti-Hyperglycemic Agents Value Chain Analysis
- 3.6.1 Upstream – Key Inputs, Resources & Suppliers
- 3.6.1.1 Key Input/Resource 1
- 3.6.1.2 Key Input/Resource 2
- 3.6.1.3 Key Input/Resource 3
- 3.6.2 Midstream – Core Operations & Value Creation
- 3.6.2.1 Operating Model & Process Overview
- 3.6.2.2 Key Operating Locations & Capabilities by Company
- 3.6.3 Downstream – Market Channels & End Users
- 3.6.3.1 Direct Sales & Customer Engagement Channels
- 3.6.3.2 Indirect Sales, Intermediaries & Partner Channels
- 3.6.4 Value Chain Profitability Analysis
- 3.6.1 Upstream – Key Inputs, Resources & Suppliers
- 3.7 PESTEL Analysis
- 3.7.1 Political Factors
- 3.7.2 Economic Factors
- 3.7.3 Social Factors
- 3.7.4 Technological Factors
- 3.7.5 Environmental Factors
- 3.7.6 Legal Factors
- 3.8 Anti-Hyperglycemic Agents Supply Chain Analysis
- 3.8.1 Critical Input & Resource Availability Risk Assessment
- 3.8.2 Supplier & Operational Concentration Risk (Geographic Exposure)
- 3.8.3 Supply & Service Disruption Impact Analysis
- 3.9 Regulatory & Policy Landscape
Note: The regulatory and policy landscape section covers regulations based on their applicability to the market, Anti-Hyperglycemic Agents category, geography, and scope of the study. Only regulatory frameworks with a material impact on operations, compliance, trade, sustainability, or market access are analyzed in detail.
Chapter 4. Key Investment Pockets & Opportunity Analysis
- 4.1 Anti-Hyperglycemic Agents Market Attractiveness Analysis
- 4.1.1 By Region – Investment Attractiveness Matrix (Market Size × CAGR)
- 4.2 Absolute Revenue Growth Opportunity
- 4.2.1 By Region – Absolute Revenue Growth Through 2032
- 4.3 Incremental Demand Opportunity
- 4.3.1 By Region – Incremental Demand Through 2032
- 4.3.2 Segment – Incremental Demand
- 4.4 Emerging Submarket Opportunity Deep Dive (Subject to Applicability)
- 4.5 Priority Market Opportunity Scorecards
- 4.5.1 United States
- 4.5.2 Europe
- 4.5.3 Asia
- 4.5.4 Middle East & Africa
Note: Priority market opportunity scorecards reflect the geographic scope and strategic relevance of the study. Listed markets are indicative and may be adapted to the industry.
Chapter 5. Anti-Hyperglycemic Agents Cross-Border Trade & Market Access Analysis
- 5.1 International Trade & Cross-Border Activity Overview
- 5.1.1 Global Export Value by Country (2024)
- 5.1.2 Global Export Volume by Country (2024) (Volume Where Applicable)
- 5.1.3 Global Import Value by Country (2024)
- 5.1.4 Global Import Volume by Country (2024) (Volume Where Applicable)
- 5.1.5 Net Trade Balance by Country (2024)
- 5.2 Export Analysis – Segment
- 5.2.1 Category 1 (Applicable Classification Code)
- 5.2.2 Category 2 (Applicable Classification Code)
- 5.2.3 Category 3 (Applicable Classification Code)
- 5.2.4 Category 4 (Applicable Classification Code)
- 5.2.5 Category 5 (Applicable Classification Code)
- 5.3 Import Analysis – Segment
- 5.3.1 Category 1 (Applicable Classification Code)
- 5.3.2 Category 2 (Applicable Classification Code)
- 5.3.3 Category 3 (Applicable Classification Code)
- 5.3.4 Category 4 (Applicable Classification Code)
- 5.3.5 Category 5 (Applicable Classification Code)
- 5.4 Cross-Border Pricing & Transaction Benchmarks
- 5.4.1 Export Pricing – Segment & Country
- 5.4.2 Import Pricing – Segment & Source Country
- 5.4.3 Price Trends (2024)
- 5.5 Key Cross-Border Trade & Delivery Routes
- 5.5.1 Cross-Border Trade/Delivery Route 1
- 5.5.2 Cross-Border Trade/Delivery Route 2
- 5.5.3 Cross-Border Trade/Delivery Route 3
- 5.5.4 Cross-Border Trade/Delivery Route 4
- 5.5.5 Cross-Border Trade/Delivery Route 5
- 5.6 Trade Policy & Market Access Impact Assessment
- 5.6.1 Tariff & Non-Tariff Barriers
- 5.6.2 Regional Trade & Economic Integration Frameworks
- 5.6.3 Bilateral & Multilateral Trade Agreements
- 5.6.4 Cross-Border Operating, Licensing & Localization Requirements
Note: This chapter applies where cross-border trade or delivery is relevant to Anti-Hyperglycemic Agents. Goods, services, and digital offerings are assessed using applicable classifications and transaction measures. Import-export volumes, trade balances, and route analyses are included only where meaningful to the market.
Chapter 6. Competitive Landscape & Company Benchmarking
- 6.1 Anti-Hyperglycemic Agents Market Concentration & Structure
- 6.1.1 Herfindahl-Hirschman Index (HHI) – vs. 2024
- 6.1.2 Leading, Mid-Sized & Emerging Player Structure
- 6.1.3 Global, Regional & Local Player Dynamics
- 6.2 Anti-Hyperglycemic Agents Market Share Analysis – 2024
- 6.2.1 Global Revenue Share by Company
- 6.2.2 Global Volume Share by Company (Volume Where Applicable)
- 6.2.3 Regional Revenue Share
- 6.2.4 Market Share Evolution ( vs. 2024)
- 6.2.5 Company Market Share by Key Segment
- 6.2.6 Company Market Share by Customer Group
- 6.3 Operating Scale, Capacity & Infrastructure Analysis
- 6.3.1 Global Operating Scale & Supply Capacity
- 6.3.2 Resource Utilization & Operating Efficiency
- 6.3.3 Output, Service Delivery & Activity Metrics
- 6.3.4 Operating Footprint & Infrastructure Map
- 6.3.5 Planned Operational & Capacity Expansion
- 6.4 Anti-Hyperglycemic Agents Competitive Benchmarking Matrix
- 6.4.1 Revenue, Growth, Profitability & Operating Metric Comparison
- 6.4.2 Channel Revenue Mix
- 6.4.3 Geographic Revenue Exposure
- 6.4.4 R&D Intensity
- 6.4.5 Sustainability Maturity
- 6.5 Strategic Developments in Anti-Hyperglycemic Agents (Last 24 Months)
- 6.5.1 Mergers, Acquisitions & Divestments
- 6.5.2 New Products, Services & Solutions in Anti-Hyperglycemic Agents
- 6.5.3 Operational & Infrastructure Expansions
- 6.5.4 Strategic Alliances, Joint Ventures & Partnerships
- 6.5.5 Distribution Expansion & Market Entry
- 6.5.6 Sustainability & ESG Initiatives
- 6.6 Competitive Strategy Mapping
- 6.6.1 Leader, Challenger, Follower & Niche Classification
- 6.6.2 Pricing Strategy Comparison
- 6.6.3 Channel Strategy Matrix
Note: Strategic developments are included based on their materiality and the availability of reliable information.
Chapter 7. Global Anti-Hyperglycemic Agents Market – By Sales & Delivery Channel
- 7.1 Segment Overview
- 7.1.1 Volume & Revenue Split by Channel (2024 & 2032) (Volume Where Applicable)
- 7.1.2 Channel Mix Evolution (2024-2032)
Chapter 8. Regional Market Analysis – Global Overview
- 8.1 Global Regional Overview
- 8.1.1 Regional Volume Share (Volume Where Applicable)
- 8.1.2 Regional Revenue Share
- 8.1.3 Regional Volume by Region (Volume Where Applicable)
- 8.1.4 Regional Revenue by Region
- 8.1.5 Regional Forecast Through 2032
- 8.2 Cross-Regional Segment Analysis
- 8.2.1 By Sales & Delivery Channel
- 8.2.2 By Competitive Positioning & Price Tier
Chapter 9. North America Anti-Hyperglycemic Agents Market
- 9.1 United States
- 9.2 Canada
- 9.3 Mexico
Chapter 10. Europe Anti-Hyperglycemic Agents Market
- 10.1 Germany
- 10.2 France
- 10.3 Italy
- 10.4 United Kingdom
- 10.5 Spain
- 10.6 Poland
- 10.7 Russia
- 10.8 Netherlands
- 10.9 Belgium
- 10.10 Sweden
- 10.11 Denmark
- 10.12 Norway
- 10.13 Rest of Europe
Chapter 11. Asia Pacific Anti-Hyperglycemic Agents Market
- 11.1 China
- 11.2 India
- 11.3 Japan
- 11.4 South Korea
- 11.5 Thailand
- 11.6 Indonesia
- 11.7 Vietnam
- 11.8 Malaysia
- 11.9 Australia
- 11.10 Rest of Asia Pacific
Chapter 12. Latin America Anti-Hyperglycemic Agents Market
- 12.1 Brazil
- 12.2 Argentina
- 12.3 Colombia
- 12.4 Chile
- 12.5 Rest of Latin America
Chapter 13. Middle East Anti-Hyperglycemic Agents Market
- 13.1 Saudi Arabia
- 13.2 United Arab Emirates
- 13.3 Turkey
- 13.4 Israel
- 13.5 Iran
- 13.6 Rest of the Middle East
Chapter 14. Africa Anti-Hyperglycemic Agents Market
- 14.1 South Africa
- 14.2 Egypt
- 14.3 Nigeria
- 14.4 Morocco
- 14.5 Rest of Africa
Chapter 15. Anti-Hyperglycemic Agents Company Profiles
- 15.1 [Company 01]
- 15.1.1 Company Overview
- 15.1.2 Key Management Personnel
- 15.1.3 Products & Services Portfolio
- 15.1.4 Financial Performance
- 15.1.5 Key Market Focus & Geographic Presence
- 15.1.6 Recent Developments & Strategic Initiatives
Note: The company profile list is preliminary and may change based on research findings, market developments, data availability, and client requirements.
Chapter 16. Appendices
- Appendix A – List of Abbreviations & Acronyms
- Appendix B – Industry Classification Code Reference – Full Series
- Appendix C – Supply, Output & Operating Capacity Data Tables
- Appendix D – End-Use & Demand Base Tables
- Appendix E – Demand, Adoption & Usage Assumptions
- Appendix F – Pricing & Revenue Metric Reference Tables
- Appendix G – Company Operations & Infrastructure Database
- Appendix H – Cross-Border Trade & Activity Data Tables (Where Applicable)
- Appendix I – Regulatory Summary Tables
- Appendix J – Primary Research Participant List (Anonymized)
- Appendix K – Primary Research Questionnaire Framework
- Appendix L – Data Sources & Bibliography
- Appendix M – Market Size Divergence & Source Comparison
Chapter 17. Research Methodology
- 17.1 Research Framework & Philosophy
- 17.2 Secondary Research – Sources, Hierarchy & Data Extraction
- 17.3 Data Modeling – Bottom-Up & Top-Down Market Sizing
- 17.4 Primary Research – Stakeholder Framework, LOI & Sample Sizes
- 17.5 Forecast Methodology – Regression, Scenario & Sensitivity Analysis
- 17.6 Quality Control – Four-Layer Validation Framework
- 17.7 Limitations & Standard Assumptions
- 17.8 Disclaimer
